
Everybody on the Internet is telling you to trade a breakout of an Inside Bar. For example:
The “Inside Bar Trading Strategy”
Inside Bars (And How to Trade Them)
Inside bars (by definition) are completely overlapped by the prior bar and must be considered to be a small trading range.
With two and more consecutive Inside Bars (II, III) even more overlap is created and more caution is needed trading a breakout.
Trading ranges are areas of equilibrium/”magnets”, where two-sided trading took place and have the tendency to pull price back into them after a breakout. According to Al Brooks 80% of trading range breakout attempts fail.
Trading ranges are best traded by taking failed Breakouts (fBO) of the extreme of the trading range, e.g. sell above (SA) and buy below (BB) or by taking a breakout pullback (BO PB) of the trading range.
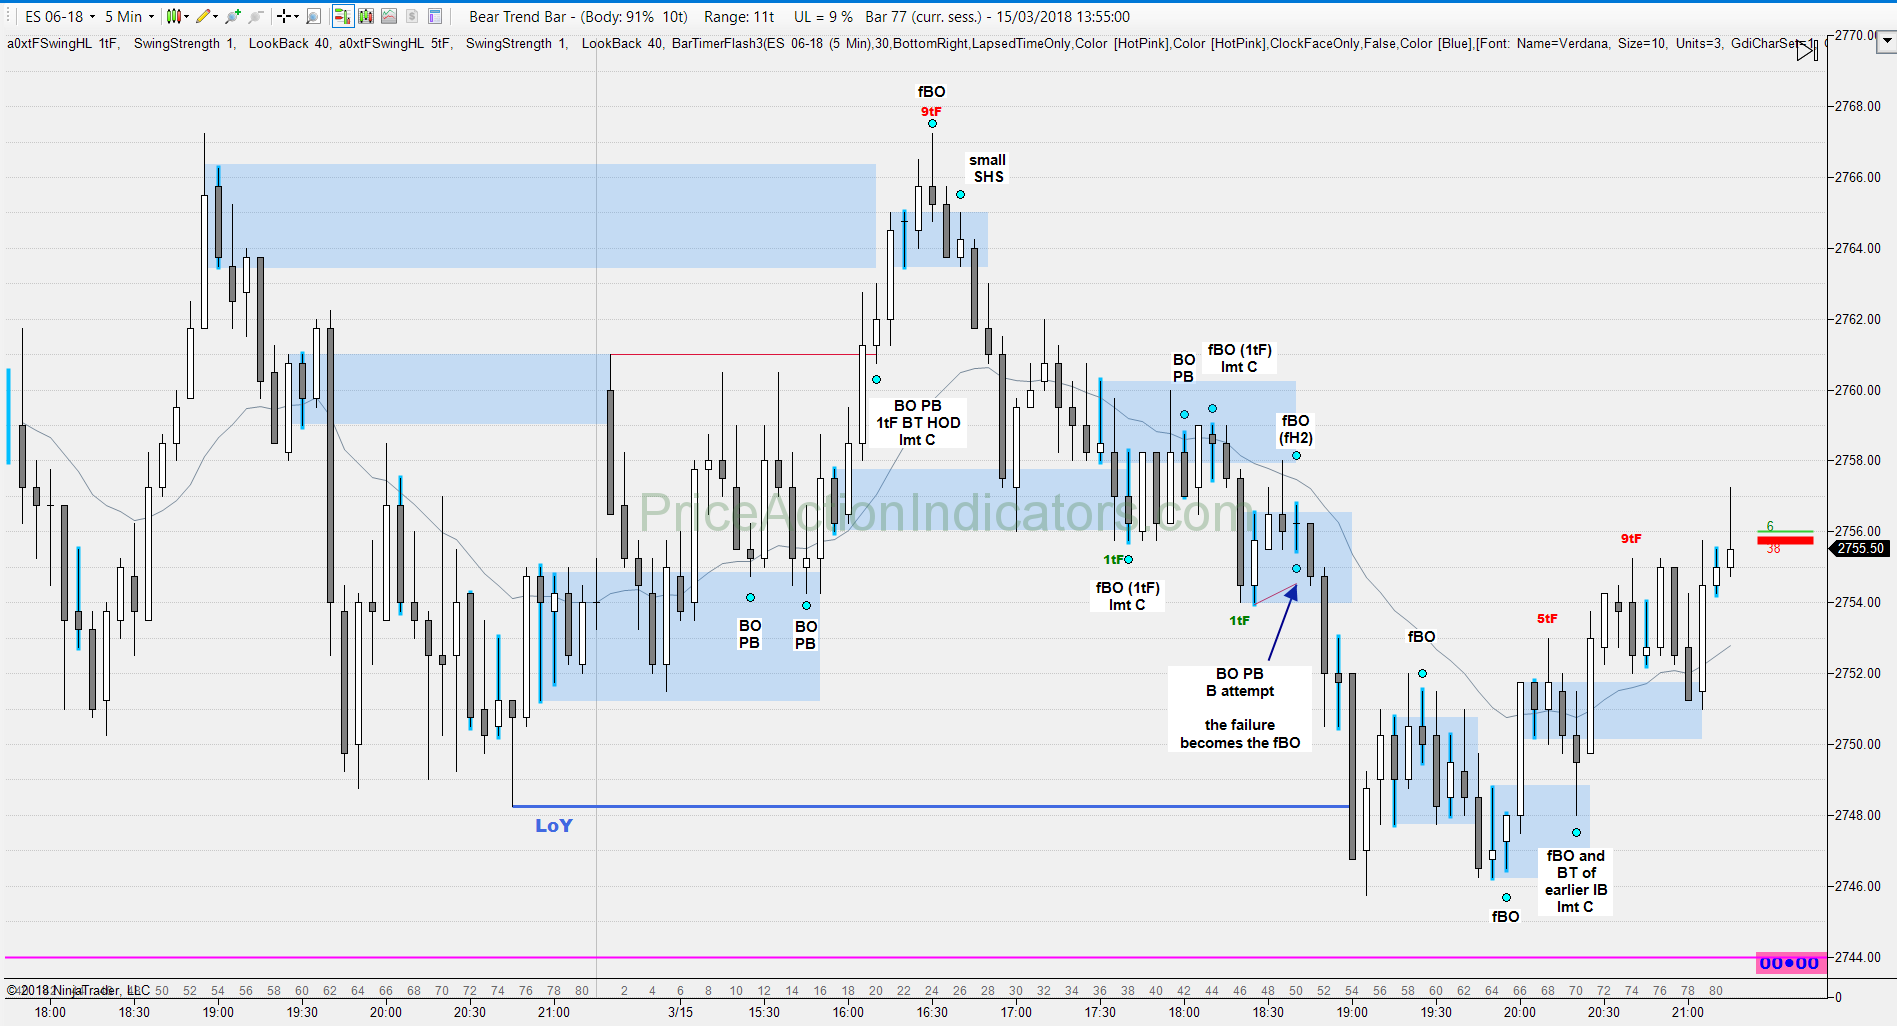
On this chart I highlighted a couple of Inside Bars and how you might trade “around” them using the above mentioned techniques
The blue boxes try to highlight the equilibrium/”magnet” effect of these small trading ranges.
As a side note:
Some people even tell you, that “on lower time frames there are just too many inside bars and many of them are meaningless…”. If you look close enough at Price Action, there are literally NO MEANINGLESS BARS or TICKS, as every single tick is a contract/volume traded and a trader expressing his/her view about the future Price Action.