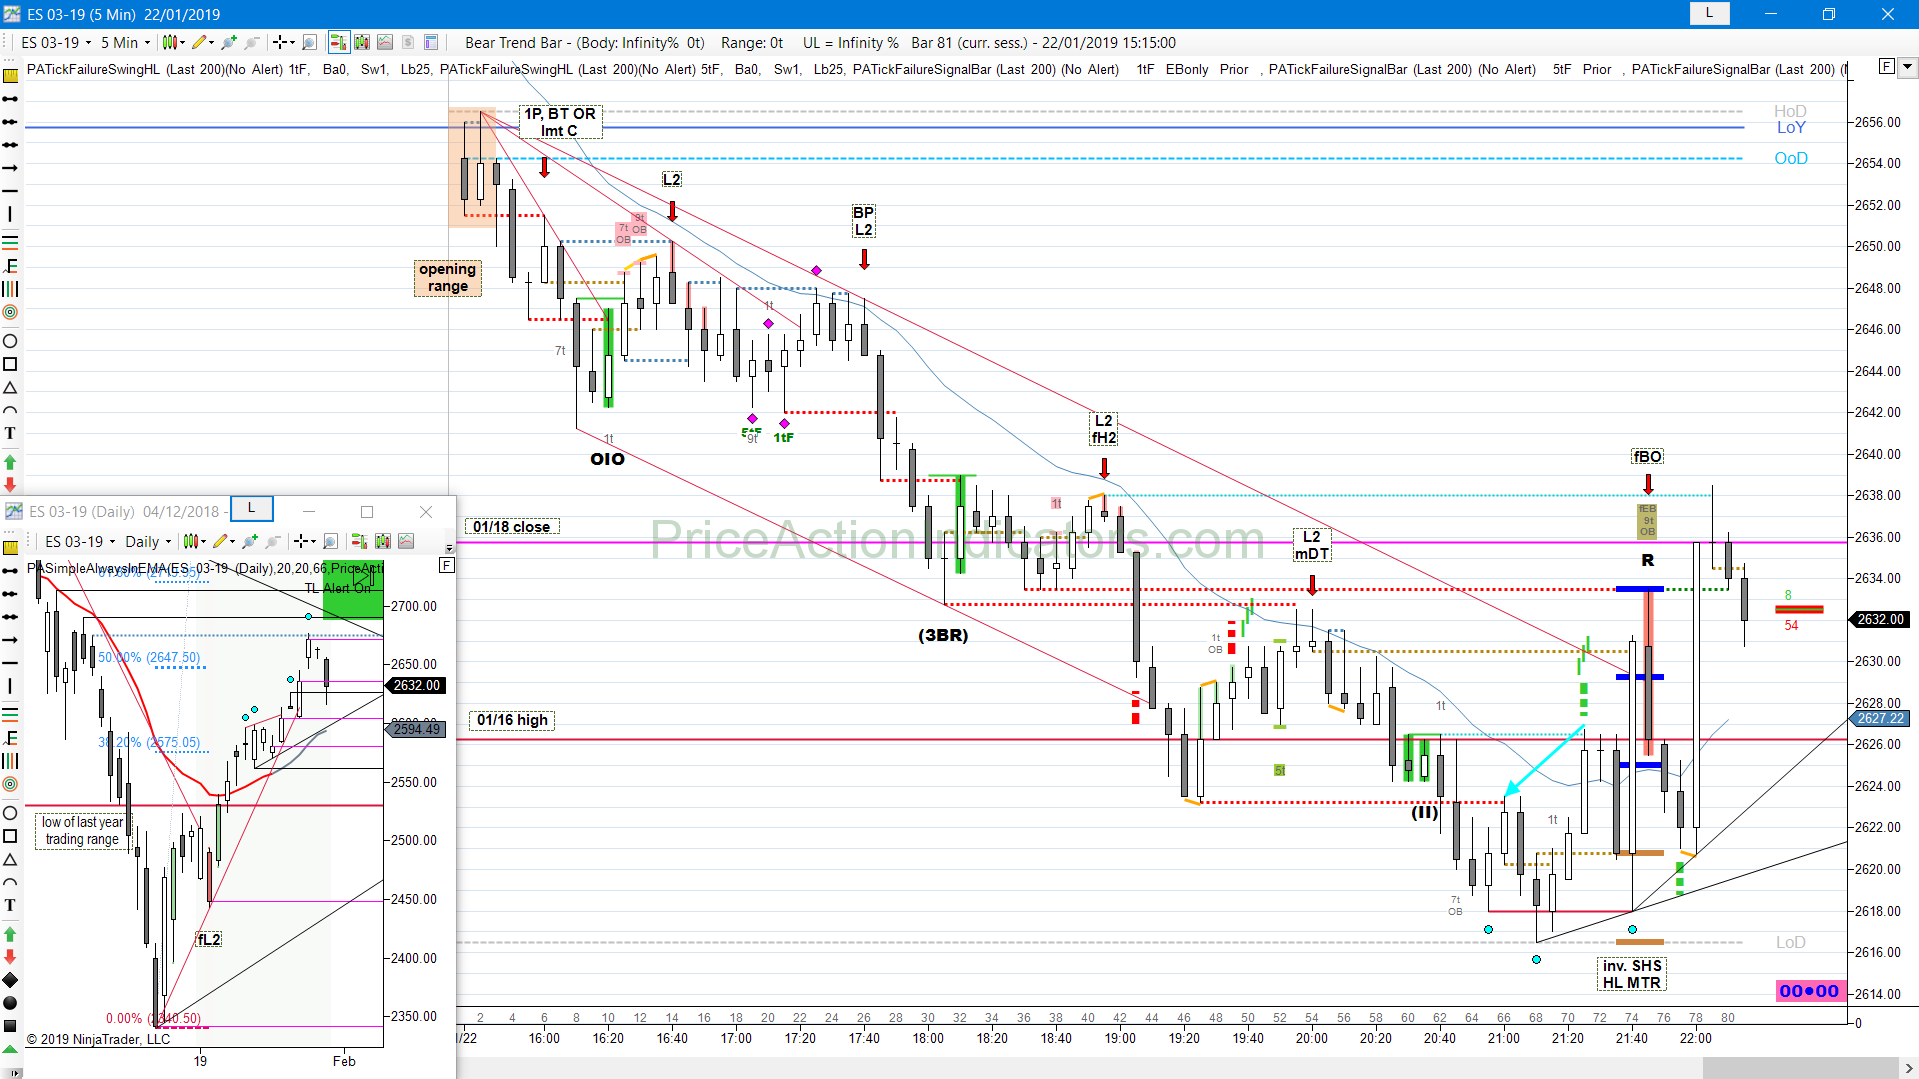
Bear gap, below LOY, opening range, 1P, BT, L2, fH2, bear CH, inv. SHS, HL MTR, fBO
try to stay with trend all day
daily chart
Always In Long (AIL) since 01/04
sellers at the Friday close, see yesterday’s post

for NinjaTrader® – Forget Squiggly Lines!
Bear gap, below LOY, opening range, 1P, BT, L2, fH2, bear CH, inv. SHS, HL MTR, fBO
try to stay with trend all day
daily chart
Always In Long (AIL) since 01/04
sellers at the Friday close, see yesterday’s post
Bear gap, mid range, fBO, fL2
even on a holiday price action is working nicely, just smaller moves

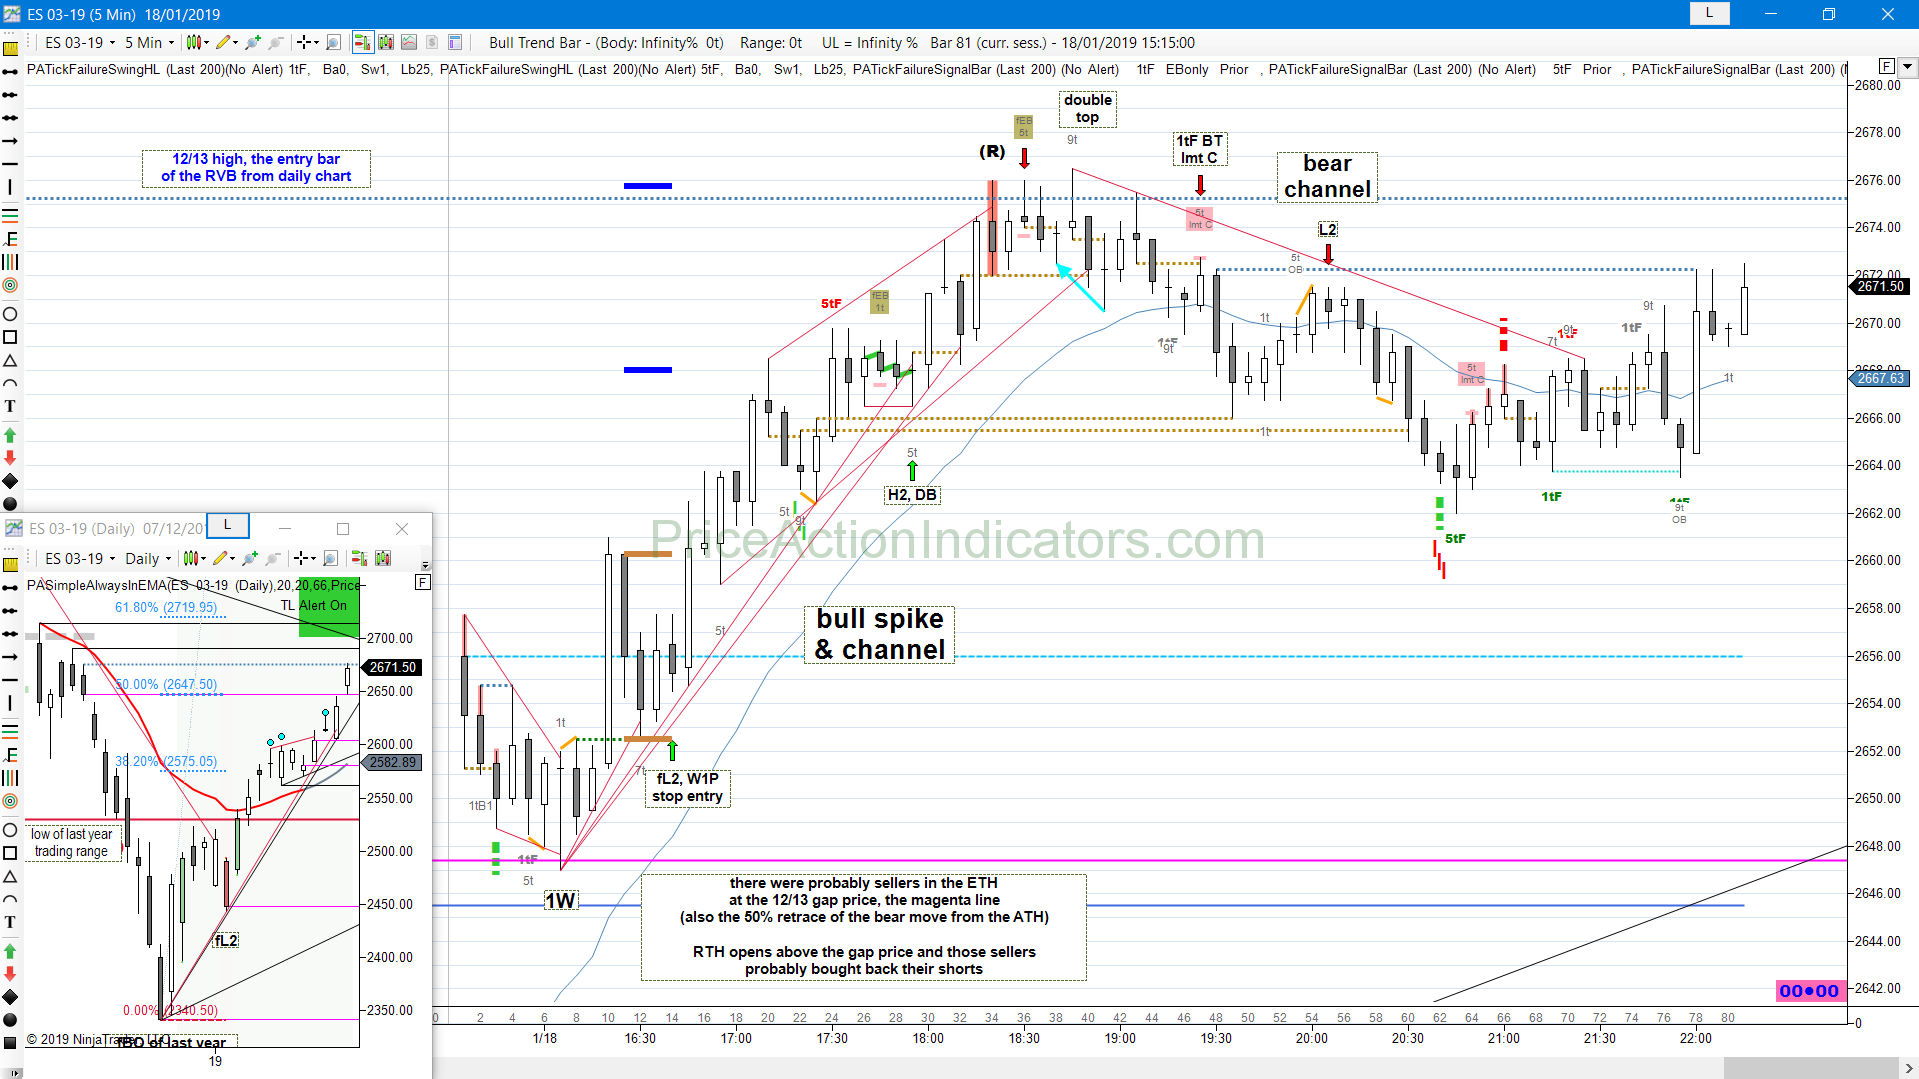
Bull gap, above HOY, 1W, W1P, fL2, H2, DB, DT, 1tF BT, bear CH, L2
there were probably sellers in the ETH at the 12/13 gap price, the magenta line (also the 50% retrace of the bear move from the ATH)
RTH opens above the gap price and those sellers probably bought back their shorts
daily chart
Always In Long (AIL) since 01/04
more up, but close just below the high of the Entry Bar (12/13) from the 12/12 LH,
classic location for sellers (Entry Bar highs and lows are support and resistance as well – 1tF EB), check out the numerous examples on the 5min chart
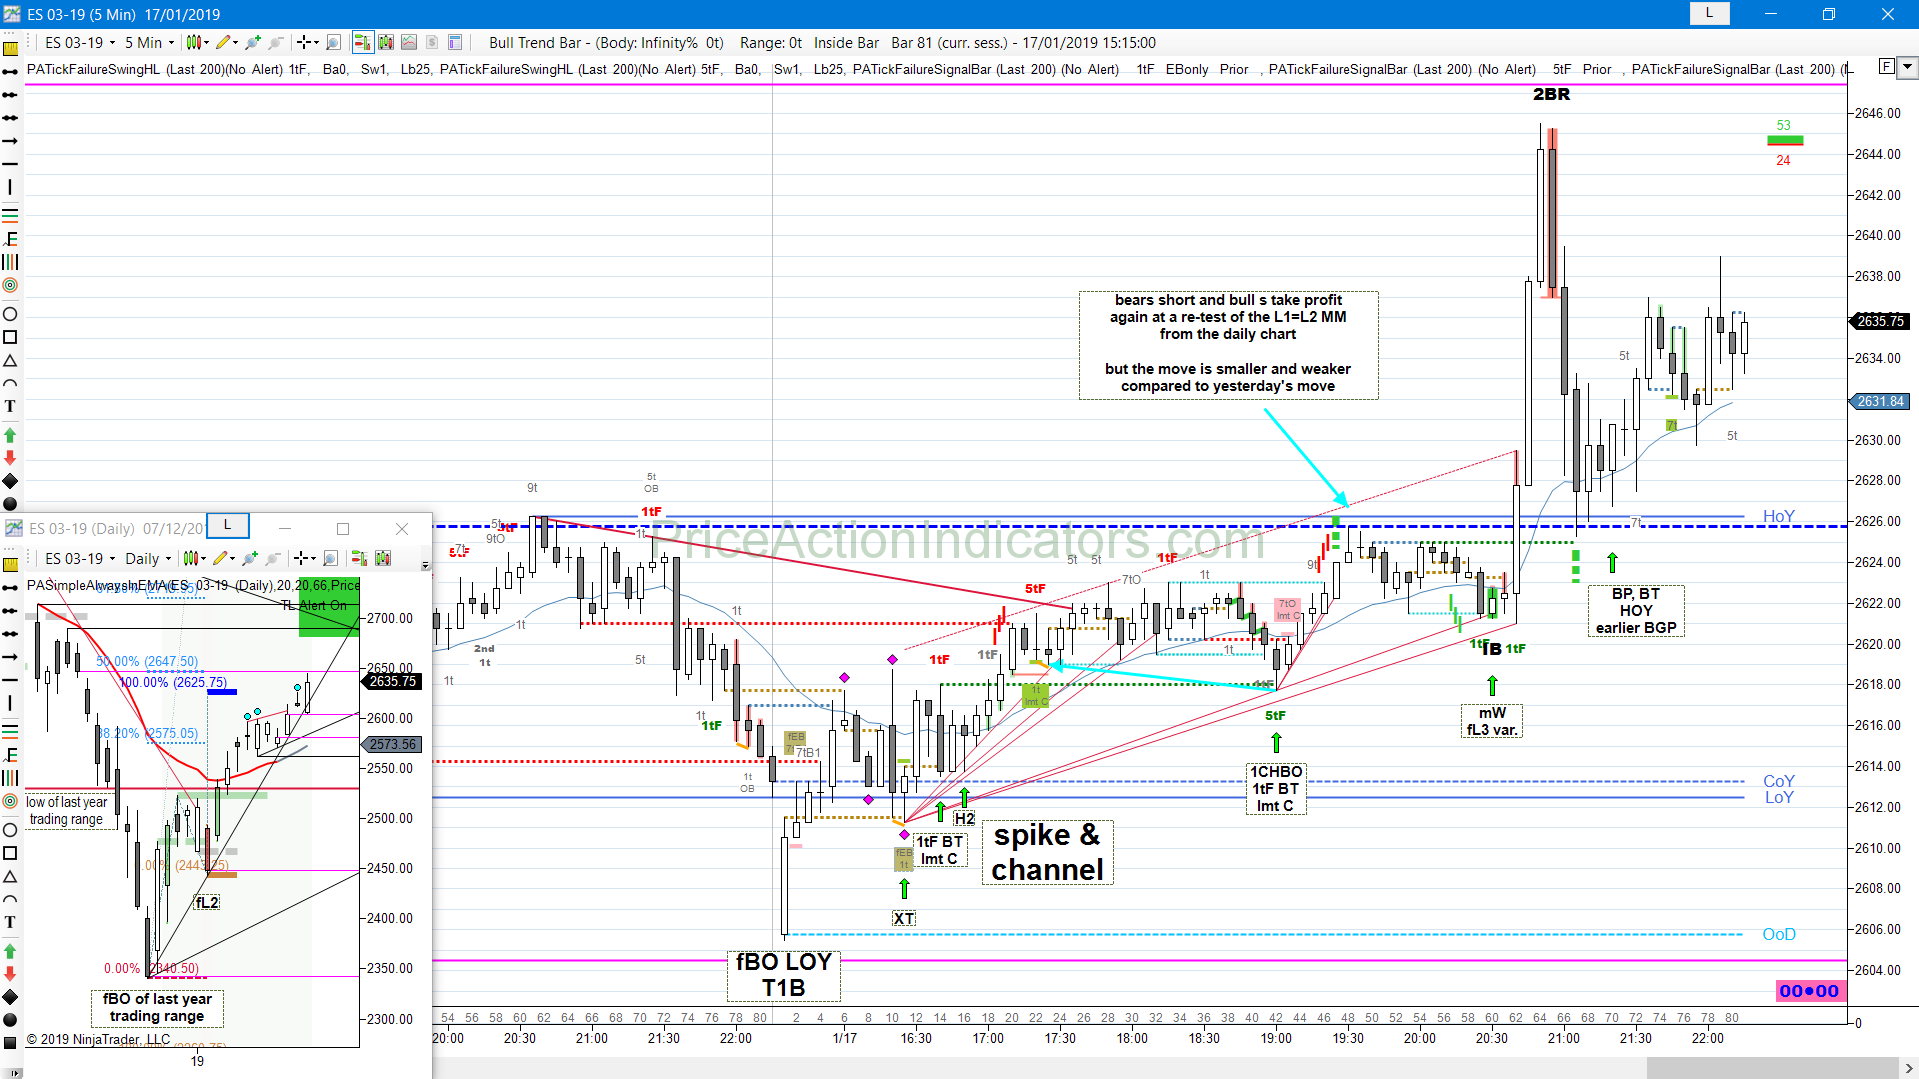
Bear gap, below LOY, fBO, T1B, XT, SC, 1tF BT, H2, 1CHBO, mW, fL3, BP
bears short and bulls take profit again at a re-test of the L1=L2 MM (2626) from the daily chart, but the move is smaller and weaker compared to yesterday’s move
daily chart
Always In Long (AIL) since 01/04
buyers at and below the bull trend line
the bear RVB failed
a gap close with 12/13 (we missed it by two points today) is also a 50% PB of the down move from the ATH
In a Trend
An expanding triangle (XT) signals the end of a bull trend by taking out a higher low (HL) and vice versa on a bear.
Expanding triangles can occur as a couple of overlapping bars like on 2019/01/14 or as (easier to see) an expanding range with higher highs and lower lows like today. Continue reading “Expanding Triangles signal the End of a Trend”