
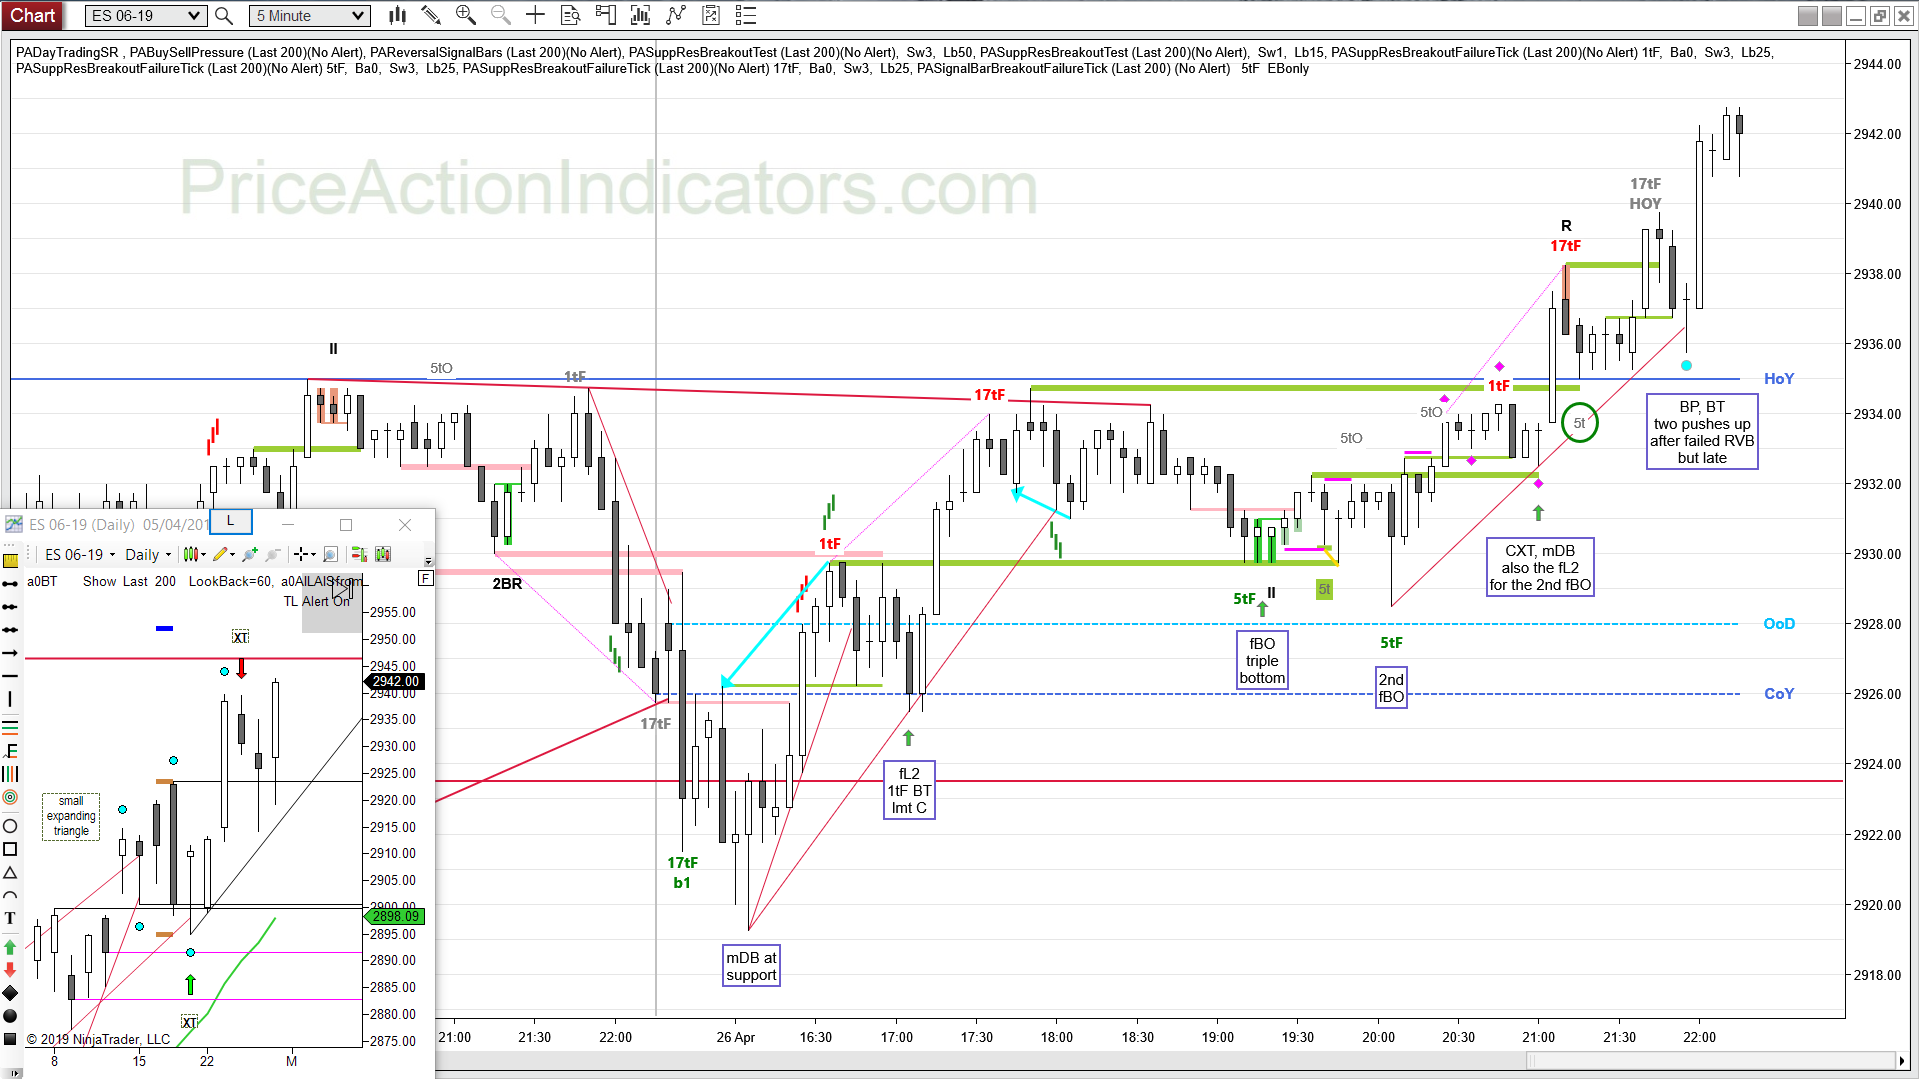
Continuation, mDB, fL2, 1tF BT, fBO, CXT, BP, BT
The Reversal Signal Bars indicator, one of our Price Action Indicators, gave a RVB reversal signal pattern after the fBO of the HOY (also a 17tF of the last SH from the Support and Resistance – Breakout Failure Tick indicator).
But, after having a 5tF on the EB (the green circle) and no BO on the next bar you need to look to exit.
The Signal Bar – Breakout Failure Tick indicator warned a trader of that possible 5tF.
daily chart
Always In Long (AIL) since 03/29 – now almost 30 days
Buyers at last weeks high stopped a 2nd push down by the bears
ATH here we come, next bull target after that might be a MM of the failed XT at around 2950
but my long term target is around 3100, see here why
because of b76 being only 1t lower than HOY
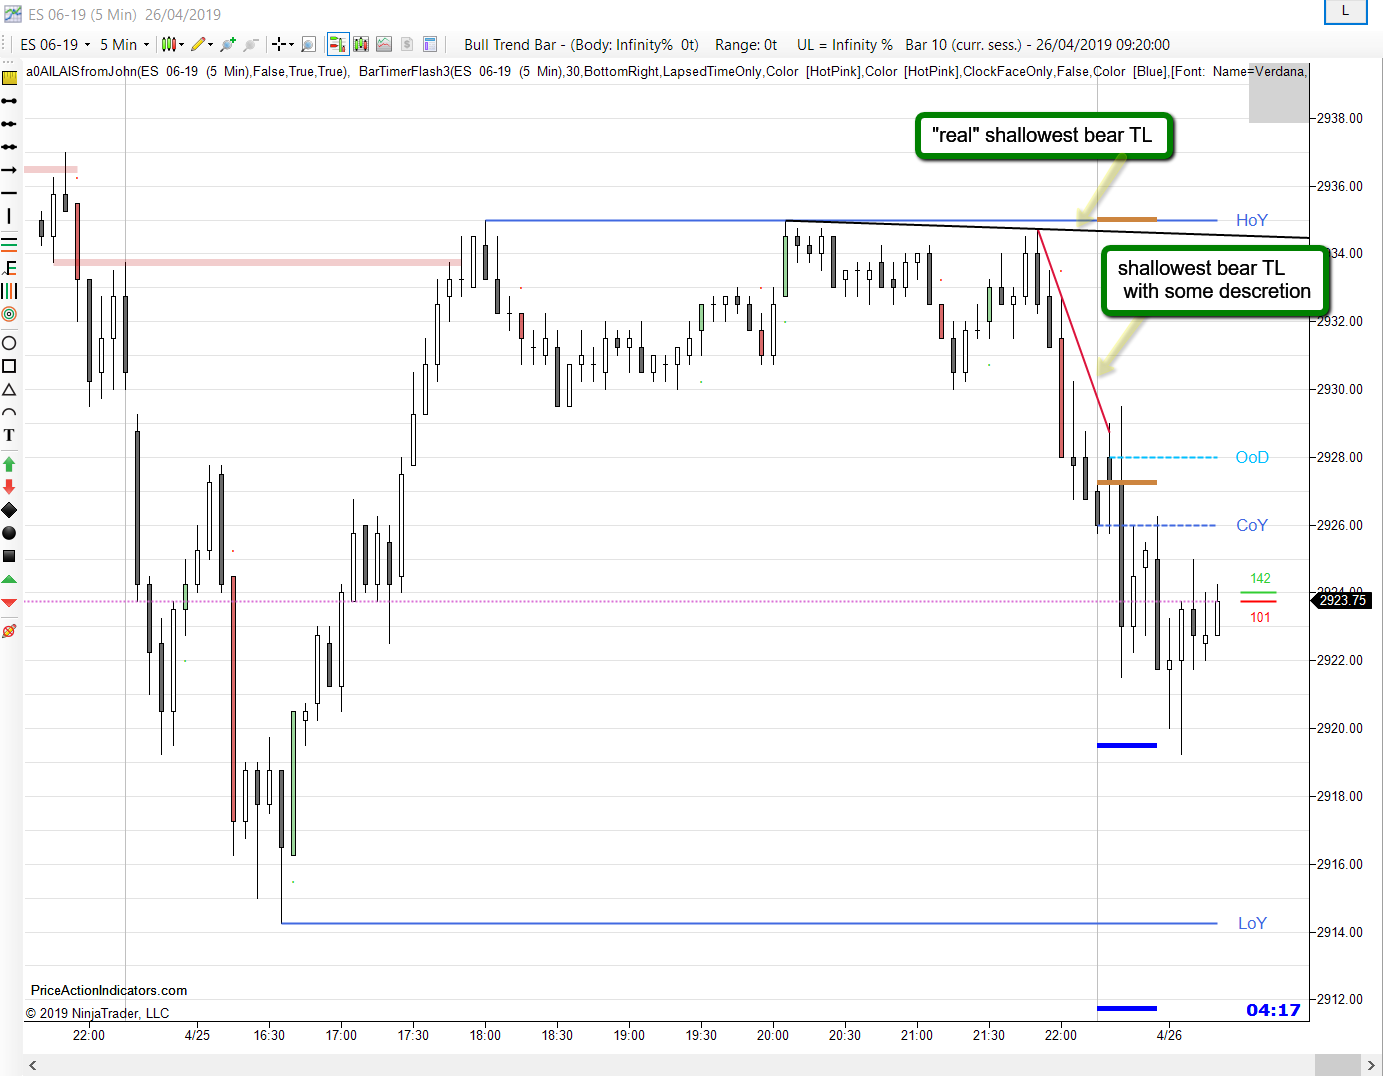
I’d use some discretion when drawing the shallowest bear TL from yesterday
also see that nice risk based MM
the push just before the COY means you got SA the prior bar, especially if that is a with trend bar, the logical stop for that trade is above the SH or HOY
here the SH (b76) worked for PT at IR=1 to the tick