Continuation, mDB, HL MTR, L2, fEB, BP, SC, CXT
trading range day
daily chart
Always In Long (AIL) since 03/29
Inside bar, but also a mDT at resistance


for NinjaTrader® – Forget Squiggly Lines!
Continuation, mDB, HL MTR, L2, fEB, BP, SC, CXT
trading range day
daily chart
Always In Long (AIL) since 03/29
Inside bar, but also a mDT at resistance
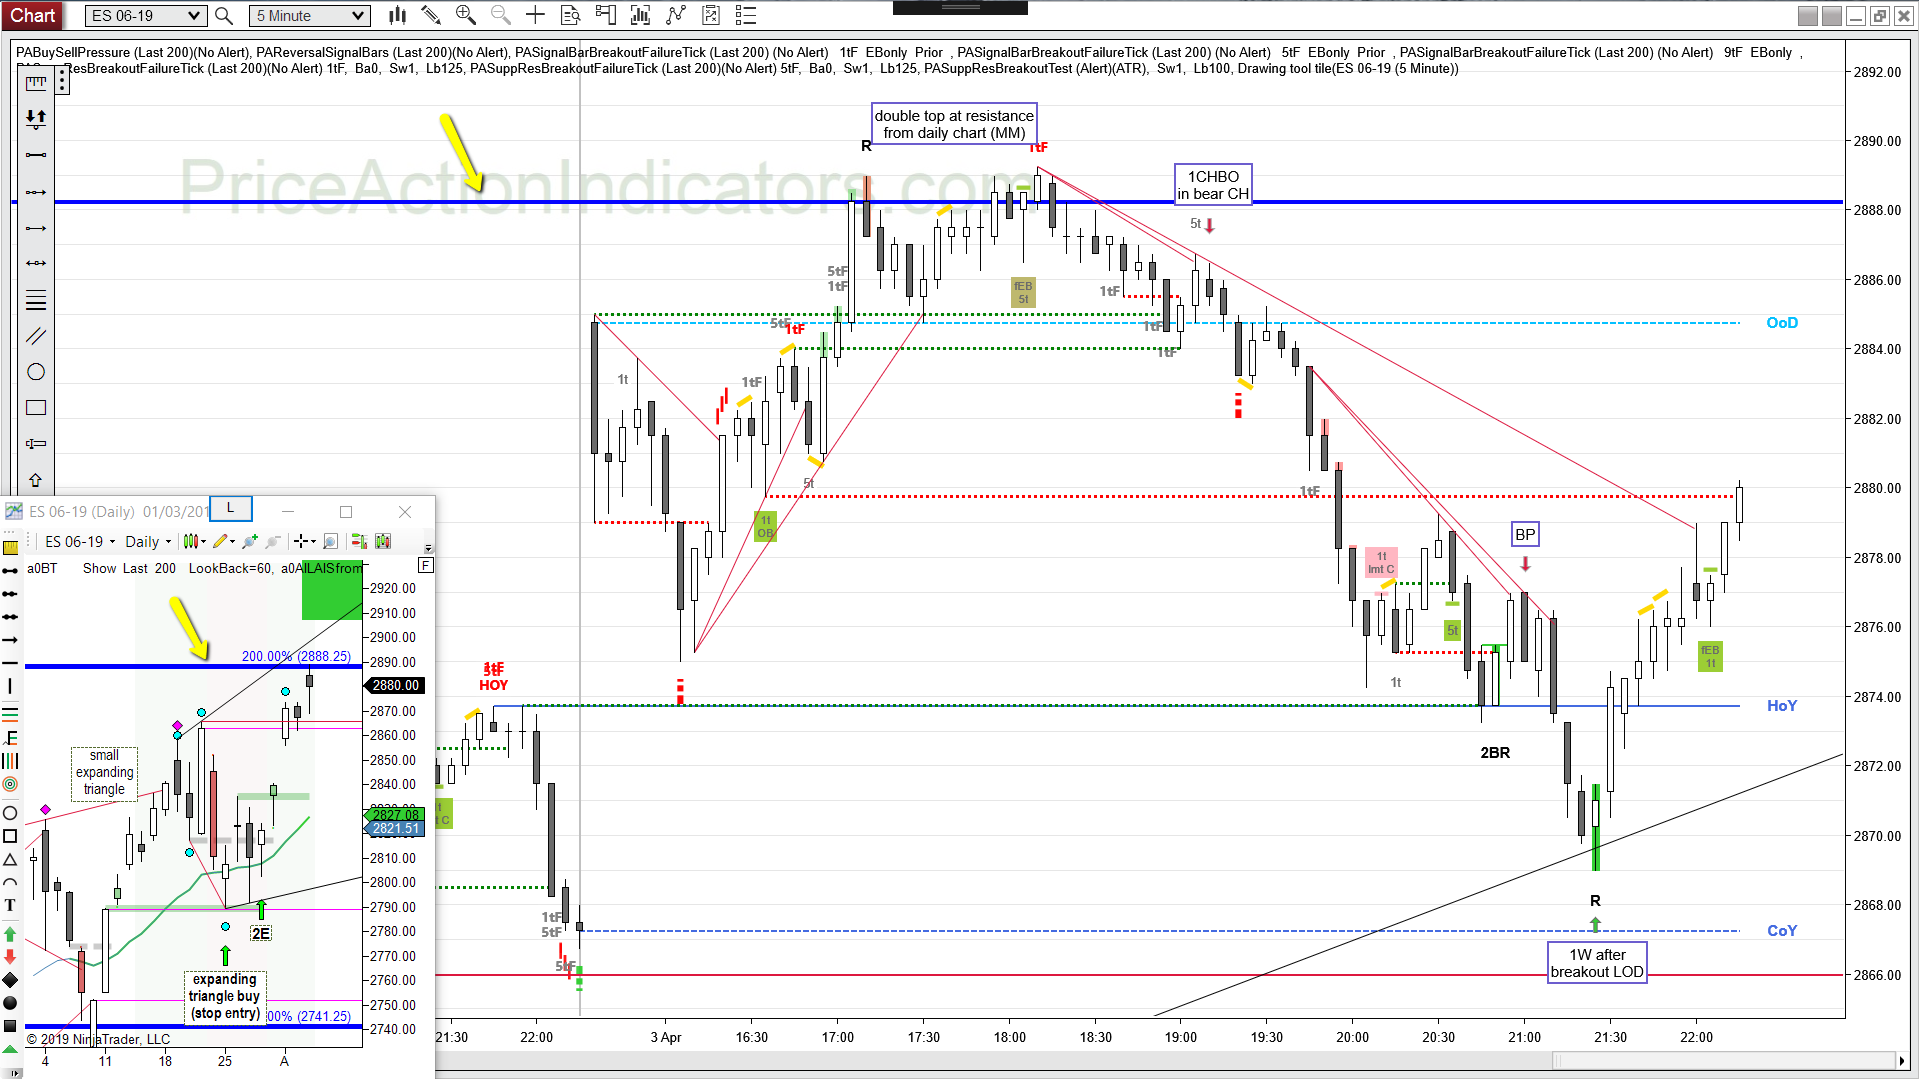
Bull gap, above HOY, bear CH, WfBO, DT, 1CHBO, BP, 1W
trading range day, sellers above HOY
LOD was at the shallowest bull trend line from yesterday
daily chart
Always In Long (AIL) since 03/29
some bulls take profits at 2 x measured move (MM) of the initial risk for the traders who bought the 1st pullback after the failed L2 (the trend origin) in the current bull
see more details here (the MM on the future is at 2888.25, the blue line):
https://twitter.com/PA_Indicators/status/1113055893891895297
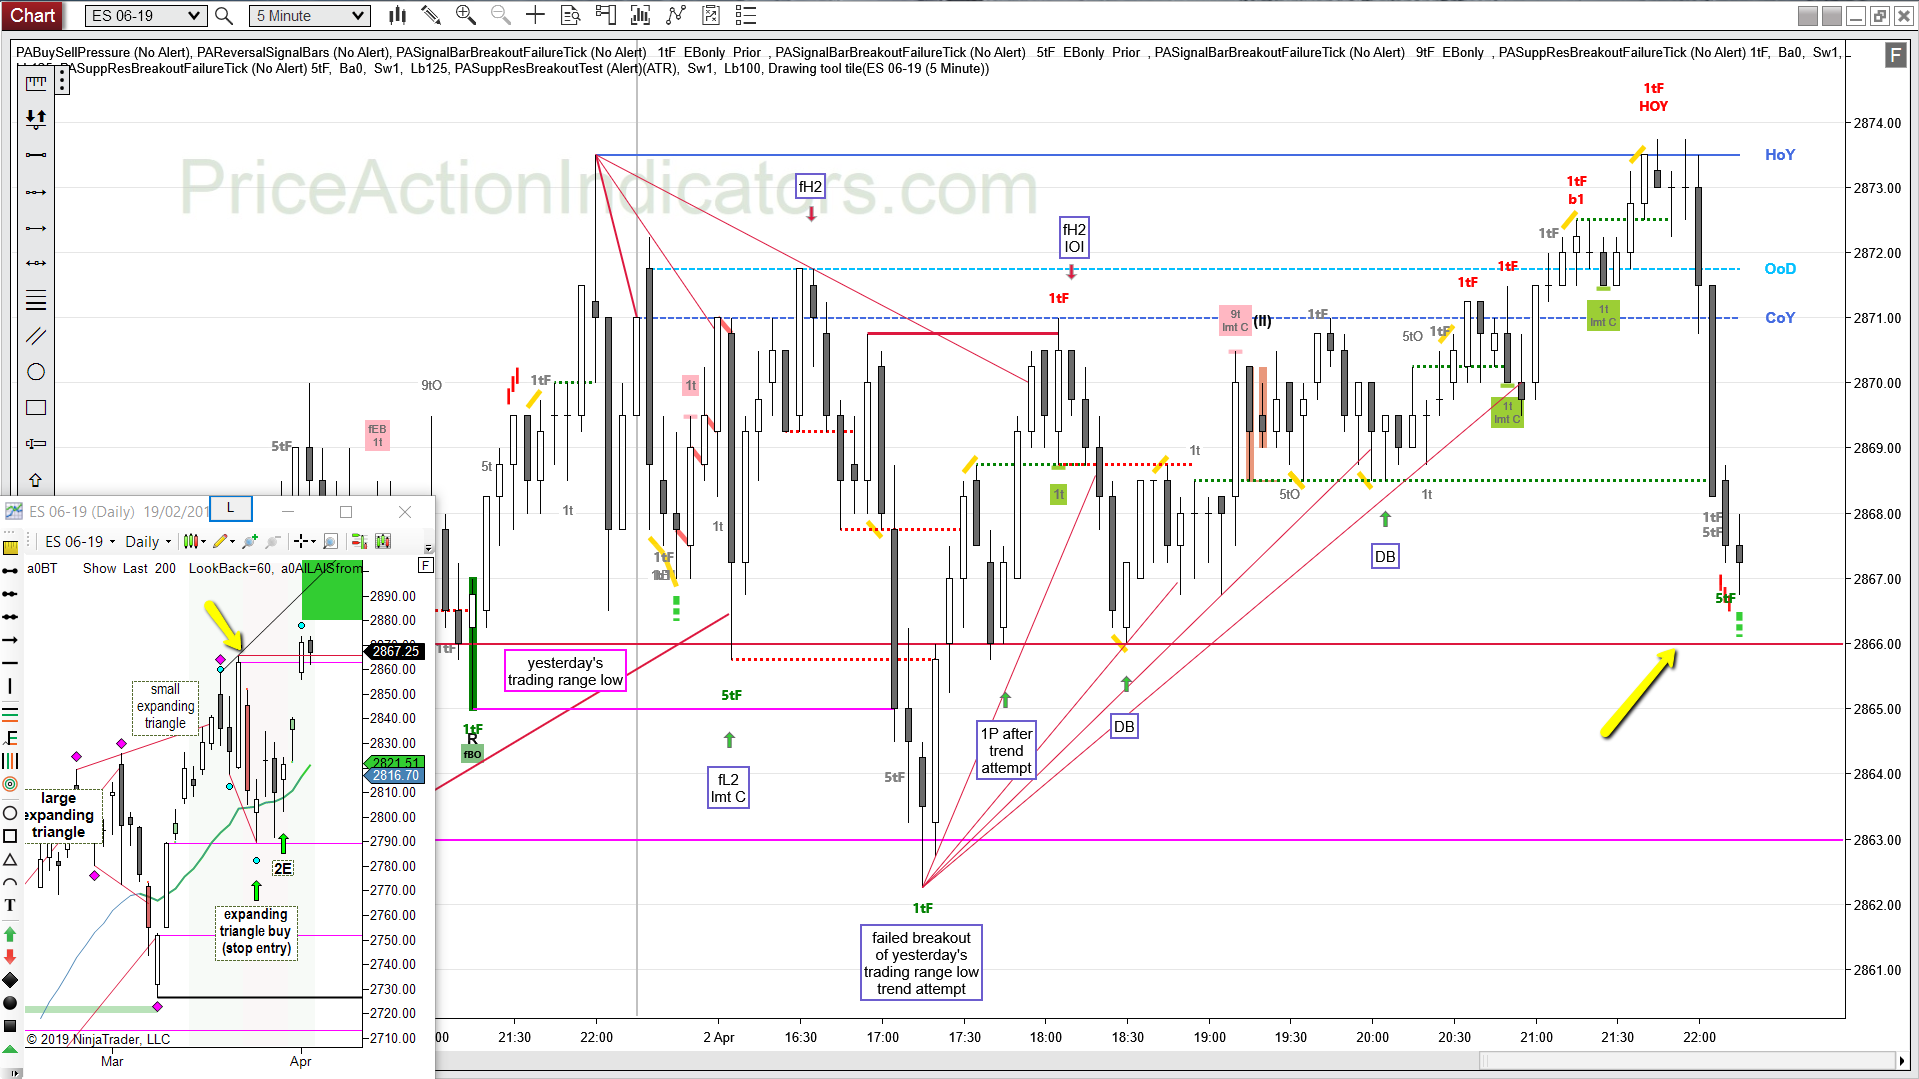
Continuation, fL2, fH2, fBO, 1P, DB
trading range day, sellers above HOY just before the close
daily chart
Always In Long (AIL) since 03/29
micro double top, but close above the old extreme of the bull (red line)
probably a breakout test of the gap close price (magenta line), which means bears started to short at that price, scaled in higher and took profits at their 1st entry
2880 might see some more profit taking (PT) by the bulls https://twitter.com/PA_Indicators/status/1113055893891895297
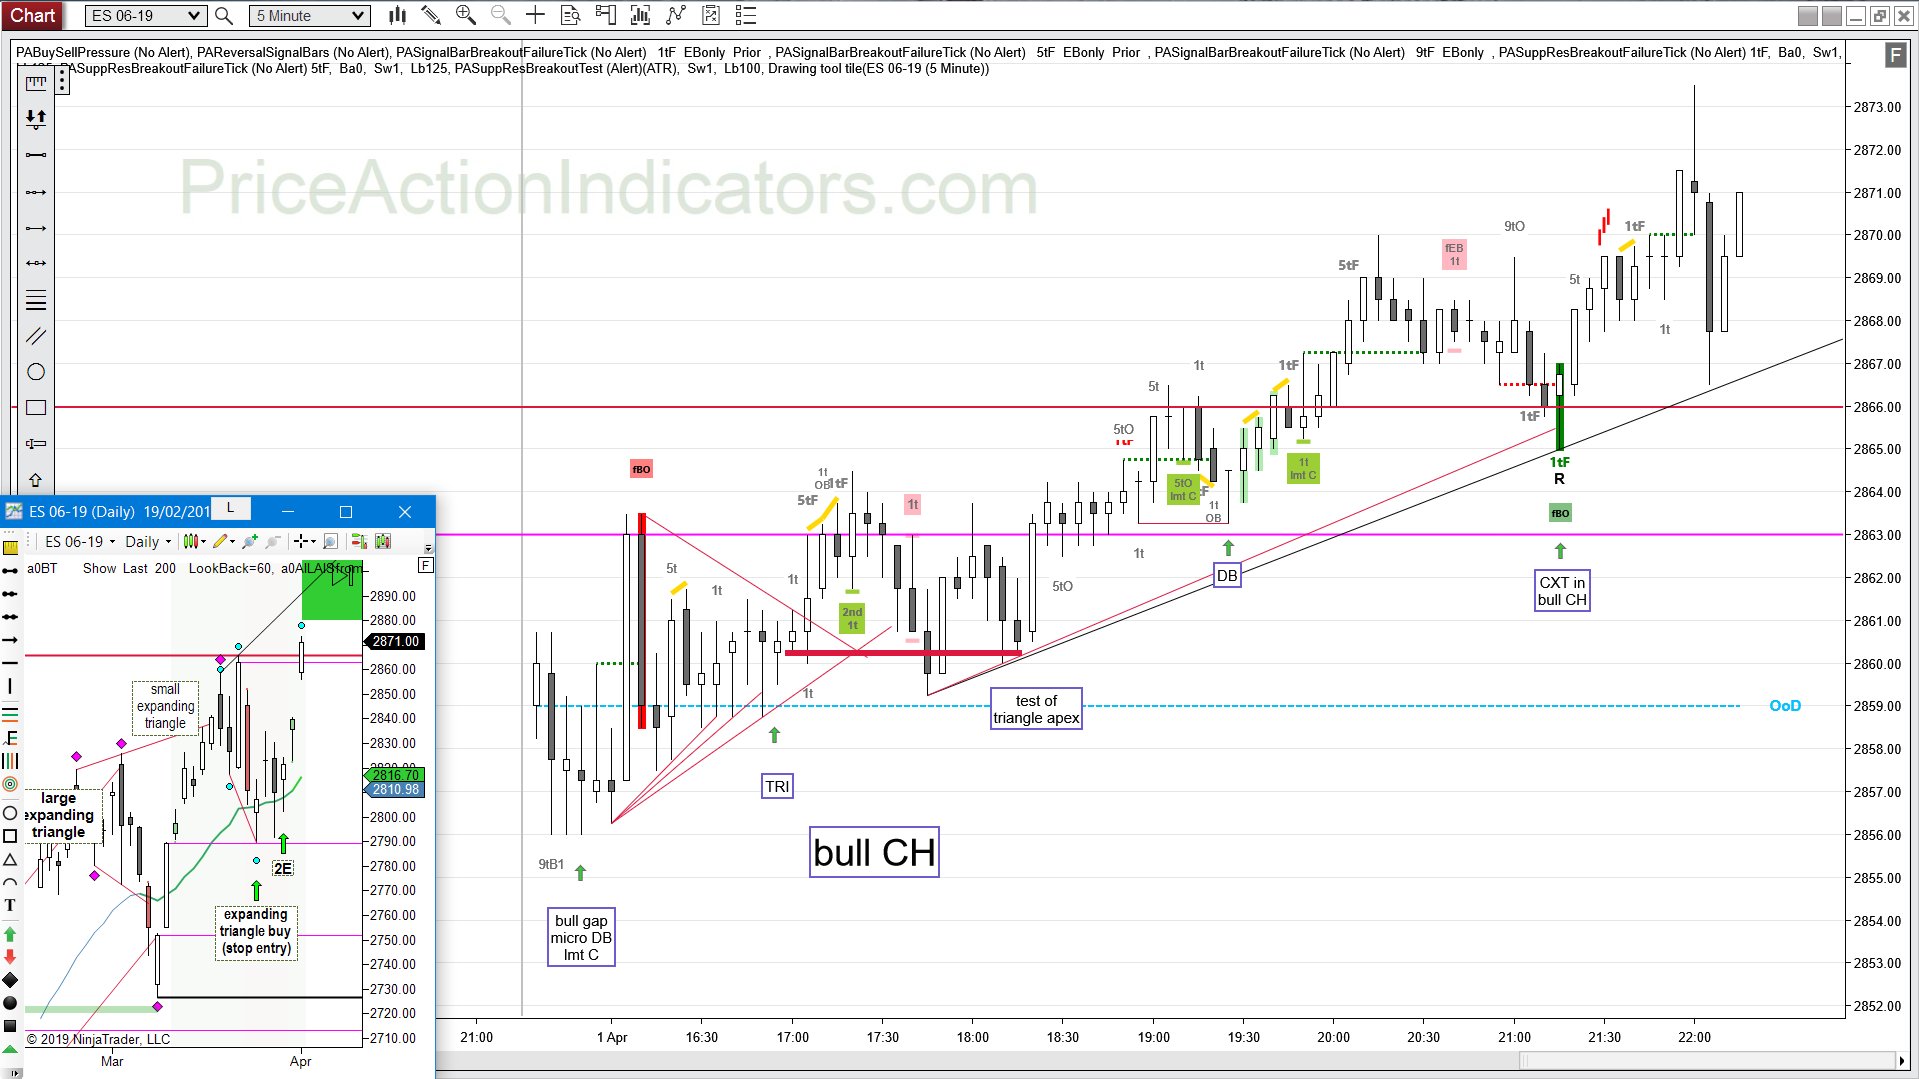
Bull gap, above HOY, mDB, TRI, bull CH, DB, CXT
relentless bull channel, buy at or near the TL, especially multi-push moves
daily chart
Always In Long (AIL) since 03/29
follow through and breakout to a new extreme of the bull move