
Bull gap, above HOY, fBO, bear CH, fH2, DB, fL2, BT, H2
shallowest trend lines from yesterday
The Buy Sell Pressure indicator gave nice heads up during the spike up from the DB at the HOY. Increasing bull bodies, decreasing tails and decreasing overlap indicating high probability for a 2nd leg up.

daily chart
Always In Long (AIL) since 07/01
bull BO bar, but weak body
1st weekly close above 3k
A couple of trade management notes about the 5 min chart.
After two failed attempts the ES often let’s you out gracefully at -1t or -2t, if that trade was reasonable. Here are two nice examples from today:
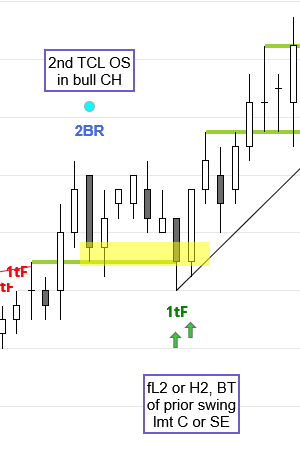
A 2nd TCL OS in a channel is a reasonable trade, especially with a good looking SB. If you shorted the 2BR at the TCL and saw the 1tF of the prior swing on the second push you need to look to exit (we’re still in a bull CH – and that can go on forever).
Also, after two attempts price cannot close back below the prior BO point (the green line).
Here the market gives you the opportunity to exit at -1t if you took a SE below the 2BR and a BE exit, if you took the more aggressive lmt C entry.
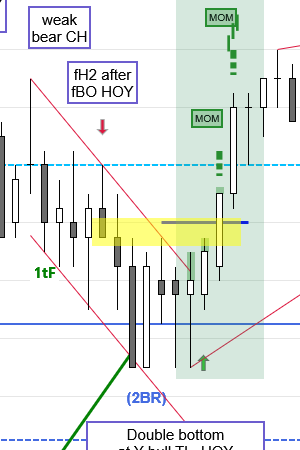
After the 2nd fBO at HOY and a DT, price formed a bear CH. The 1st PB to the TL of the bear CH is a reasonable trade (also a shaved close RVB, fEB and fH2). I took that trade too.
After two pushes dn bulls got a DB at the HOY (trend termination at support).
Again, the market let’s you out at -2 t or -1t (if you took the SB lmt C, which was reasonable, because it was a failed EB (fEB)).