E-mini ES 2019/08/27

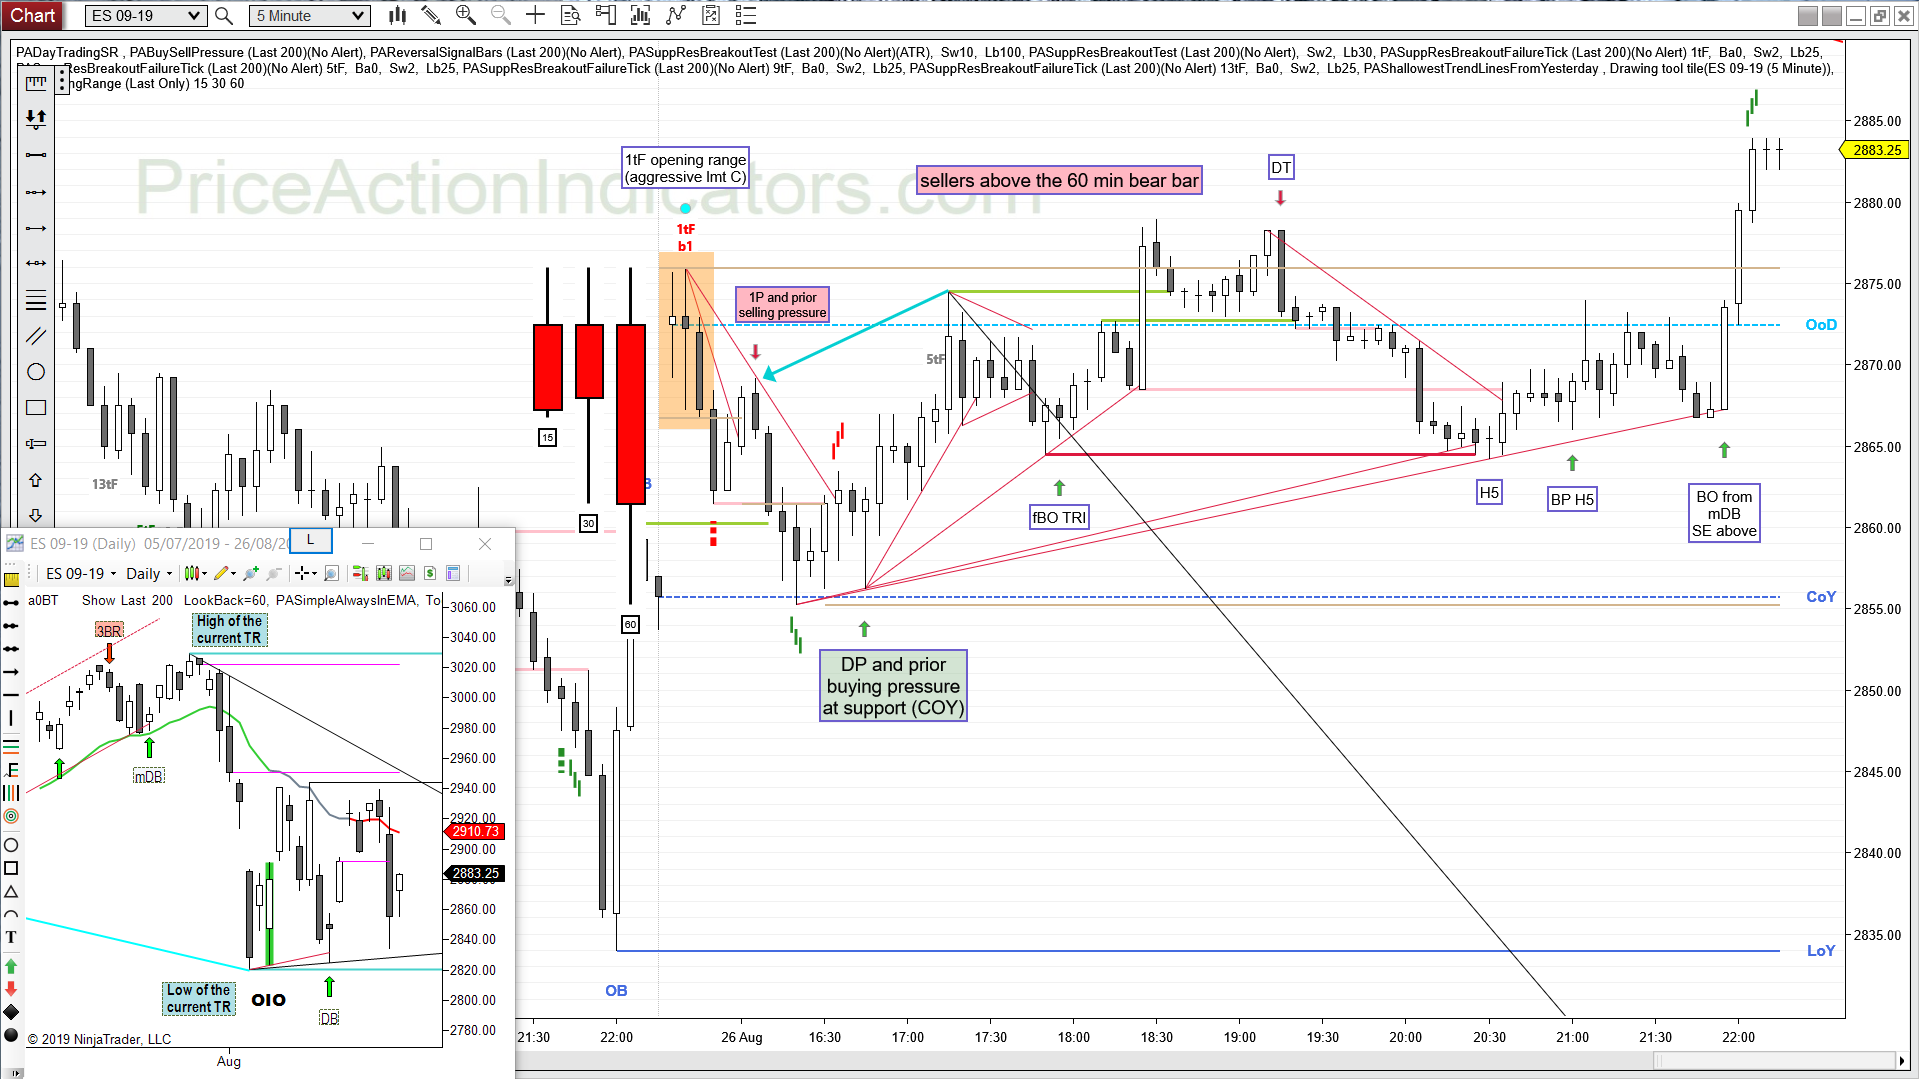
Bull gap, mid range, Opening Range, bear CH, mDT, L2, L3, TCLOS, DB, 1W, DT, 2E, HL MTR, fBO, mW

again very nice PA around the open

daily chart
Always In Short (AIS) since 08/23
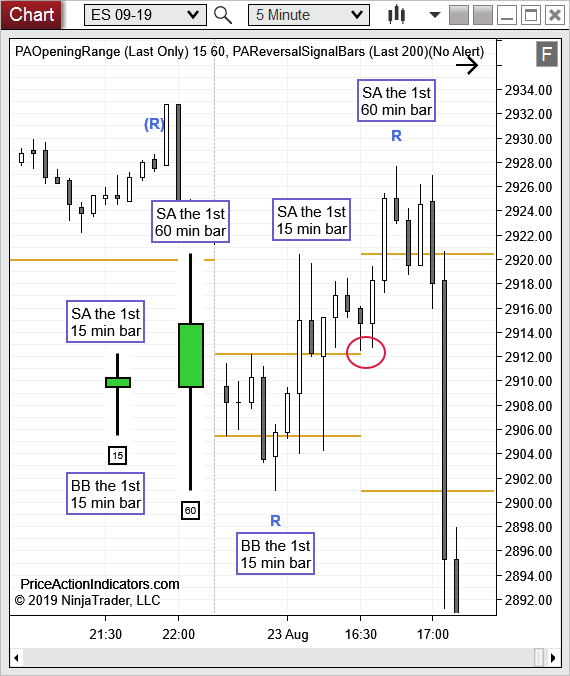
Failed Entry Bar for yesterday’s bull Inside Bar


Bar 1 is the Opening Range
we get a couple of failed breakouts (magenta markers) above and below
the Opening Range becomes larger each time
until the 1st successful breakout (BO + FT) below the 60 min bar

E-mini ES 2019/08/26

Bull gap, mid range, Opening Range, 1P, DB, DP, fBO TRI, DT, H5, BP, mDB

the DB at COY is probably an OIO, a reversal pattern (although mid range of the prior day, if you trade the RTH chart)
I expected Brs from the daily chart at the COY
bears buy back shorts and bulls B a close near the TR low

daily chart
Always In Short (AIS) since 08/23
bull Inside Bar
bulls see a double bottom pullback (DP)

E-mini ES 2019/08/23

Bear gap, mid range, Opening Range, 1fBO, 1tF EB, BT, 1W, DT, W1P, SC, bear CH, mDT, L2

daily chart
Always In Short (AIS) since today
we closed the gap with the 08/15 close
bear Trend Bar closing near the low of last weeks range
three OL bars on the weekly chart, probably BB


it doesn’t get any better than that on the Opening Range
the 1st 15 min bar of the day is a trading range bar, Buyers Below (BB) and Sellers Above (SA)
then there is a Breakout Test of the High of the Opening Range (red circle)
the 1st 60 min bar of the day is a trading range bar too, Sellers Above (SA)

The Reversal Signal Bars indicator, one of our Price Action Indicators, gave two RVB signals, one below the Opening Range and one at the HOD.


E-mini ES 2019/08/22

Bull gap, above HOY, T1B, SX, DB, fBO, SC, mDB, mDT, XT, H3, fL1

the OOD right at the gap price (prior resistance turns into support), the swift move higher and the high of last week magnet made me tap into that bull trap
fortunately I exit below b2

two more or less scratches put me in the right direction on the bull SC after the SX

daily chart
Always In Long (AIL) since 08/19
we closed the gap with the 08/13 close
bear TR bar near the top of last weeks range


E-mini ES 2019/08/21

Bull gap, mid range, Opening Range, bear MC, 1IB, fBO, 1tF BT, DT, DB
FOMC report, small Trading Range day

Nice confirmation from the BuySell Pressure Indicator and the 5 tick failure on the fBO of the Opening Range.
The three higher time frames (15, 30 and 60 minutes) had trading range bars for the 1st bar. This might have been an early indication to look for fBO at the extremes of the day.

daily chart
Always In Long (AIL) since 08/19
another attempt to close that gap with the 08/13 close