Bull gap, above HOY, fBO, T1B, DB, XT, DT, mDB, mDT, TRI
Brs at the OOW
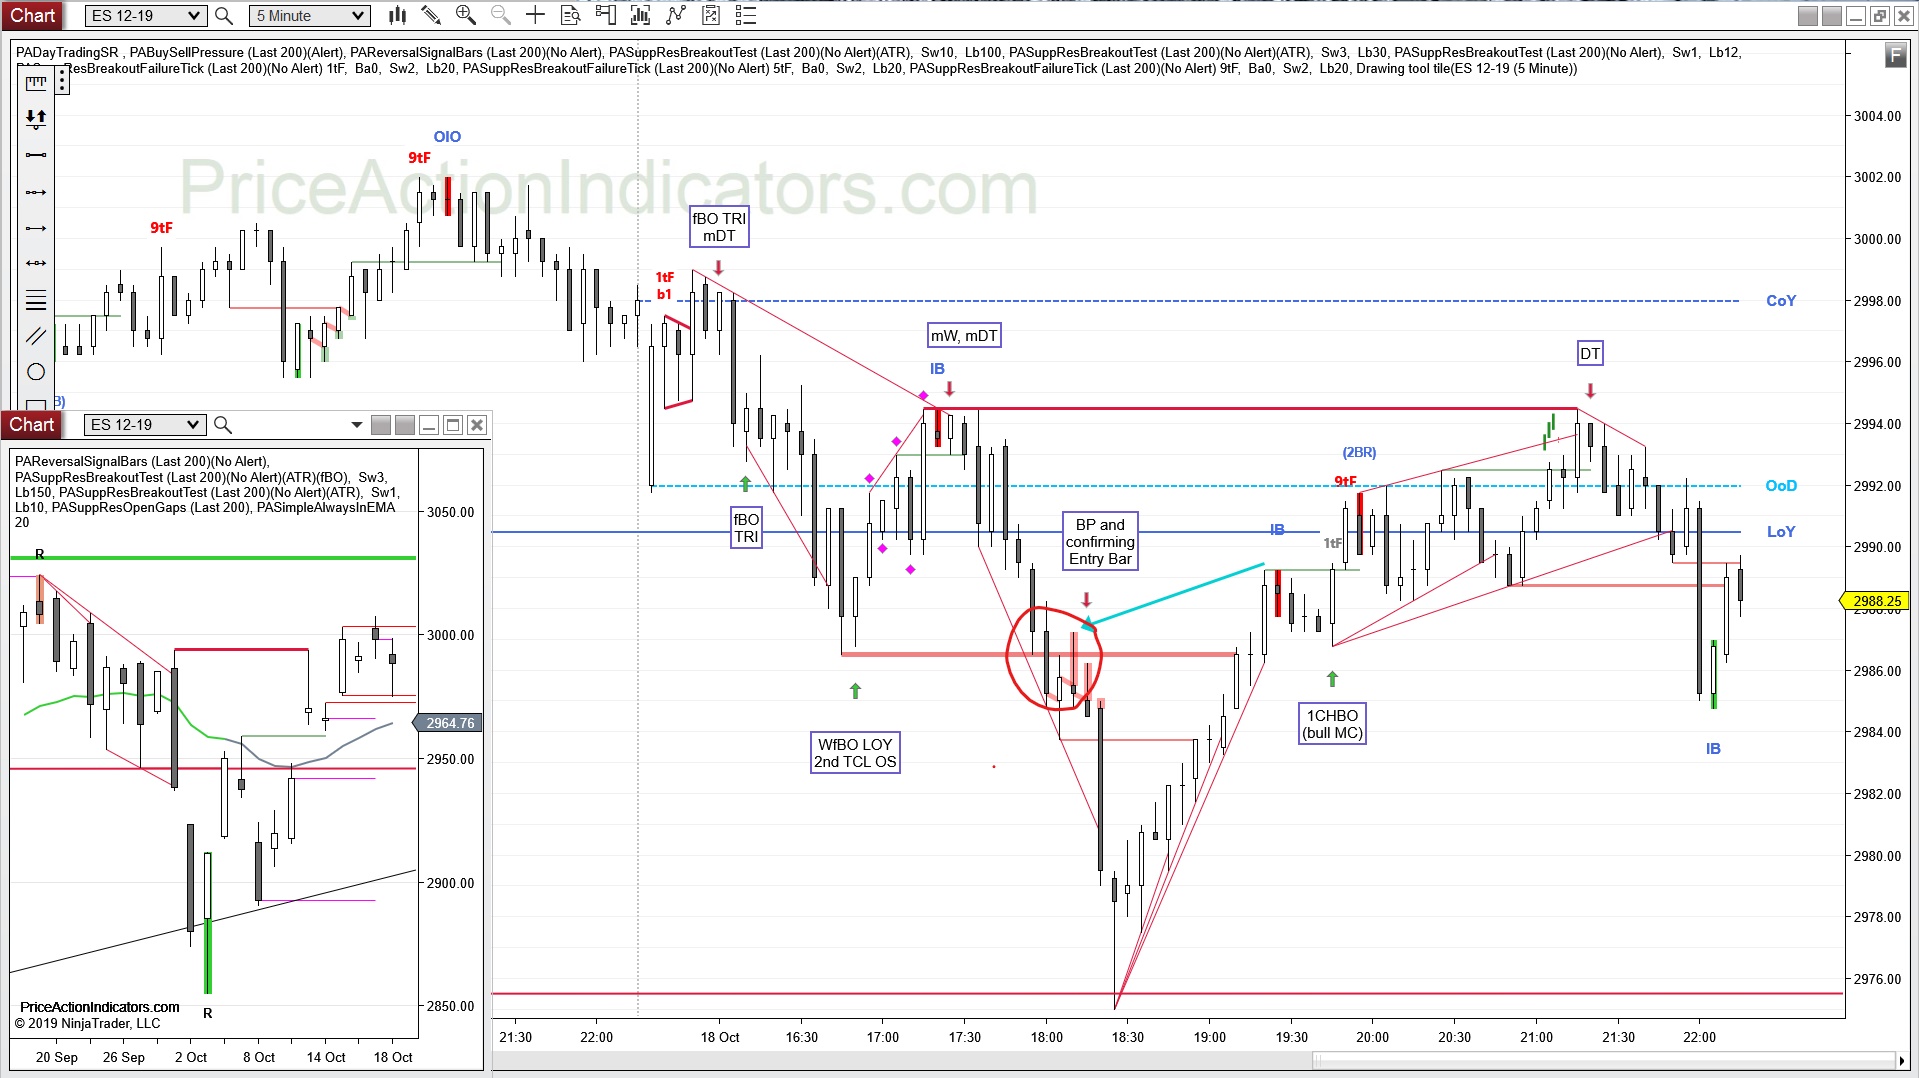
Nice Buying Pressure (Buyers on the close of the prior bar and shrinking bear bodies) in that bear spike from the Double Top Lower High when we got close to support (the Open of the week).
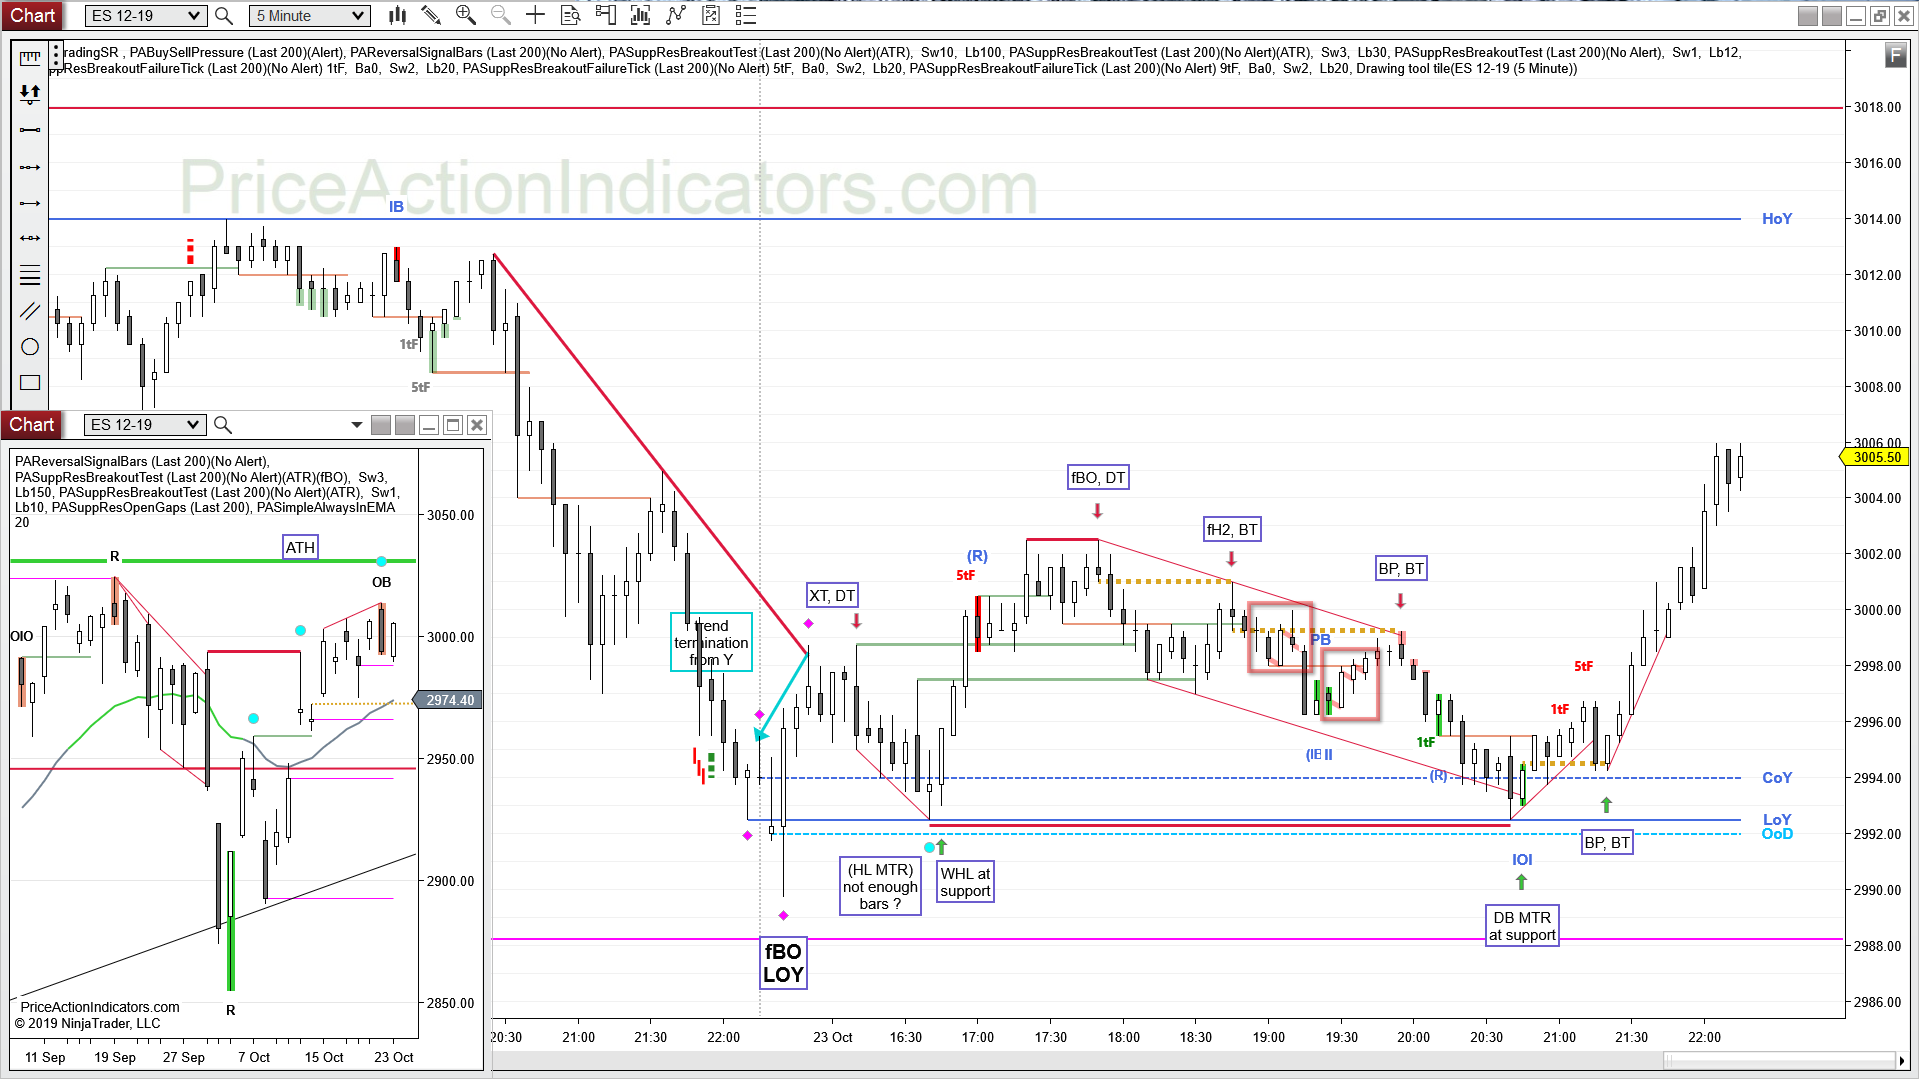
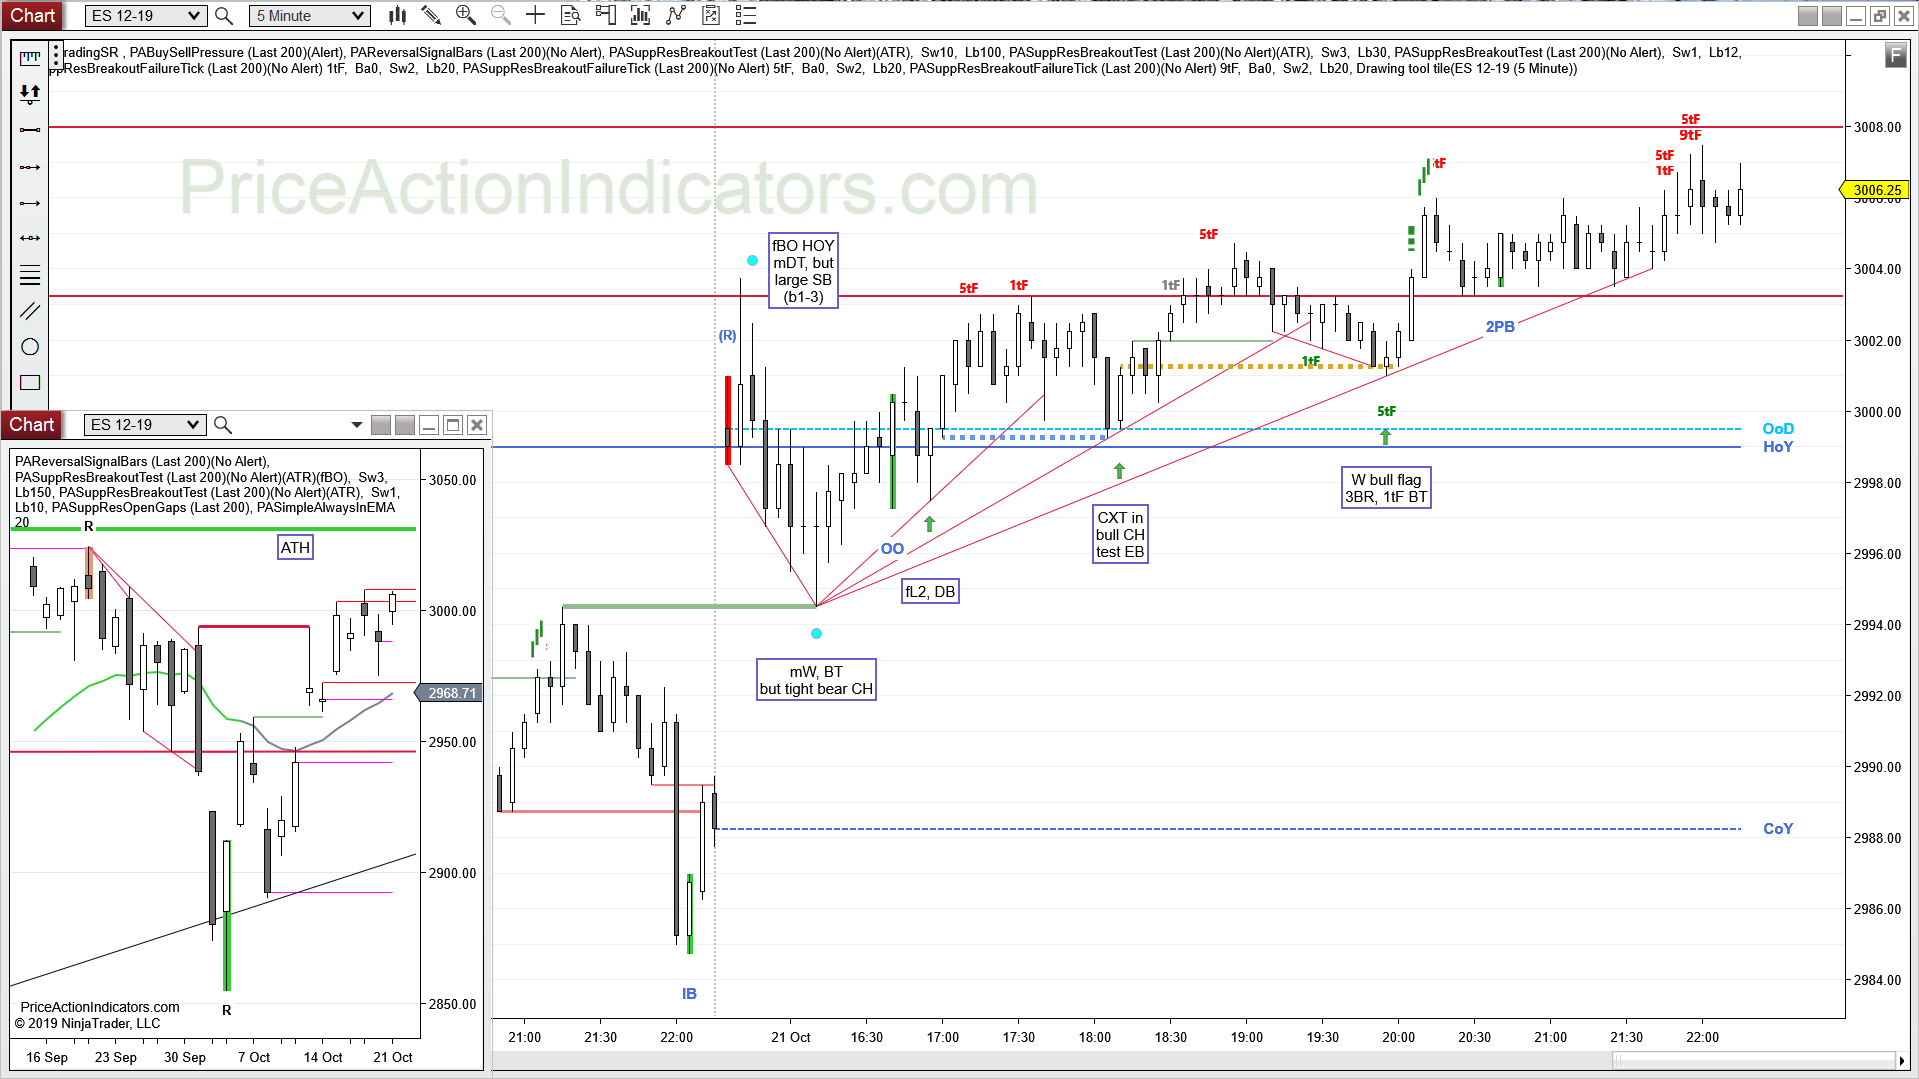
E-mini S&P 500 Future 5 min chart (trend lines, arrows and boxed text drawn by hand)
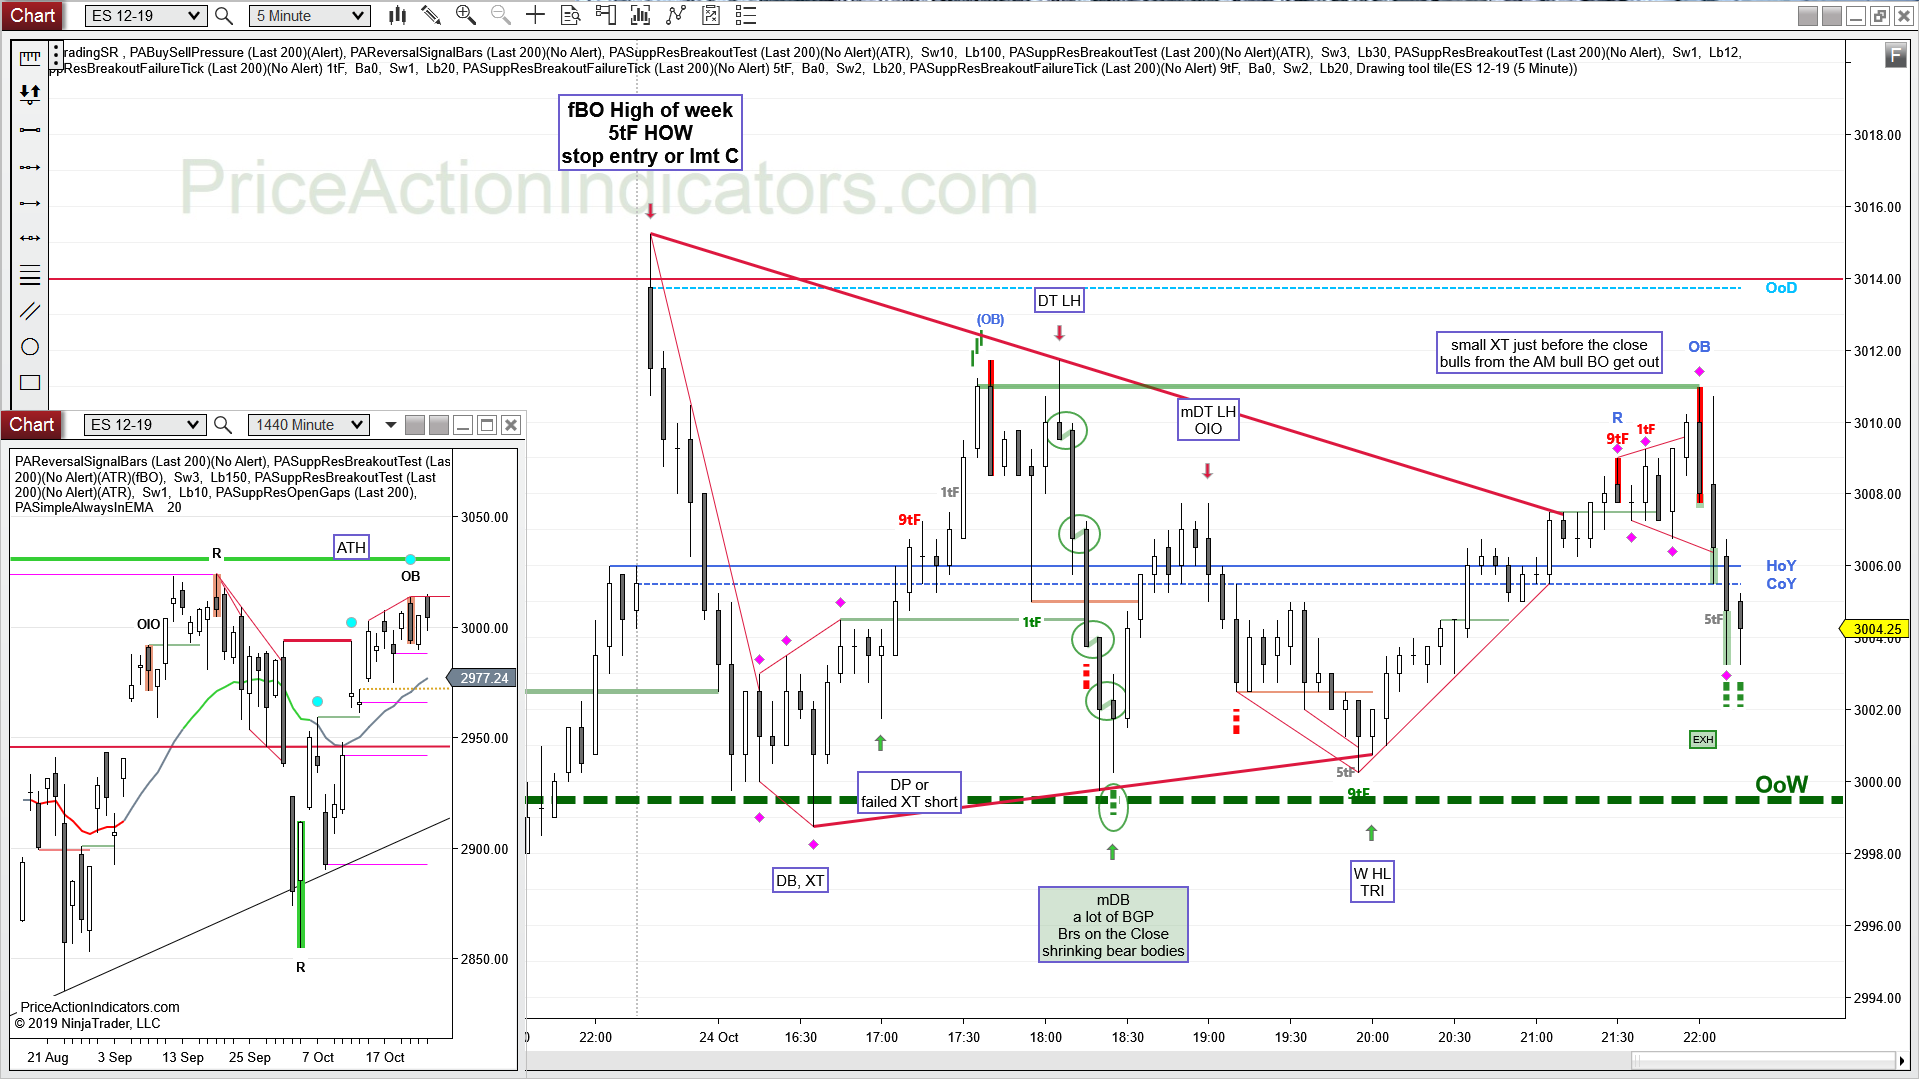
daily chart
Always In Long (AIL) since 10/10
Sellers Above the High of the week, another bear Signal Bar for a SE below tomorrow
it has a weak close though