
Bull gap, above HOY, bull MC, 1P, BT, XT, mDB, SHS, L2, LH MTR
bull CH, bear CH and LH MTR on the re-test of the gap price (3150.25)
there was also nice Selling Pressure at that price (shrinking bull bodies in a bull move and a 5tF), the 2nd red circle
E-mini S&P 500 Future 5 min chart (trend lines, arrows and boxed text drawn by hand)
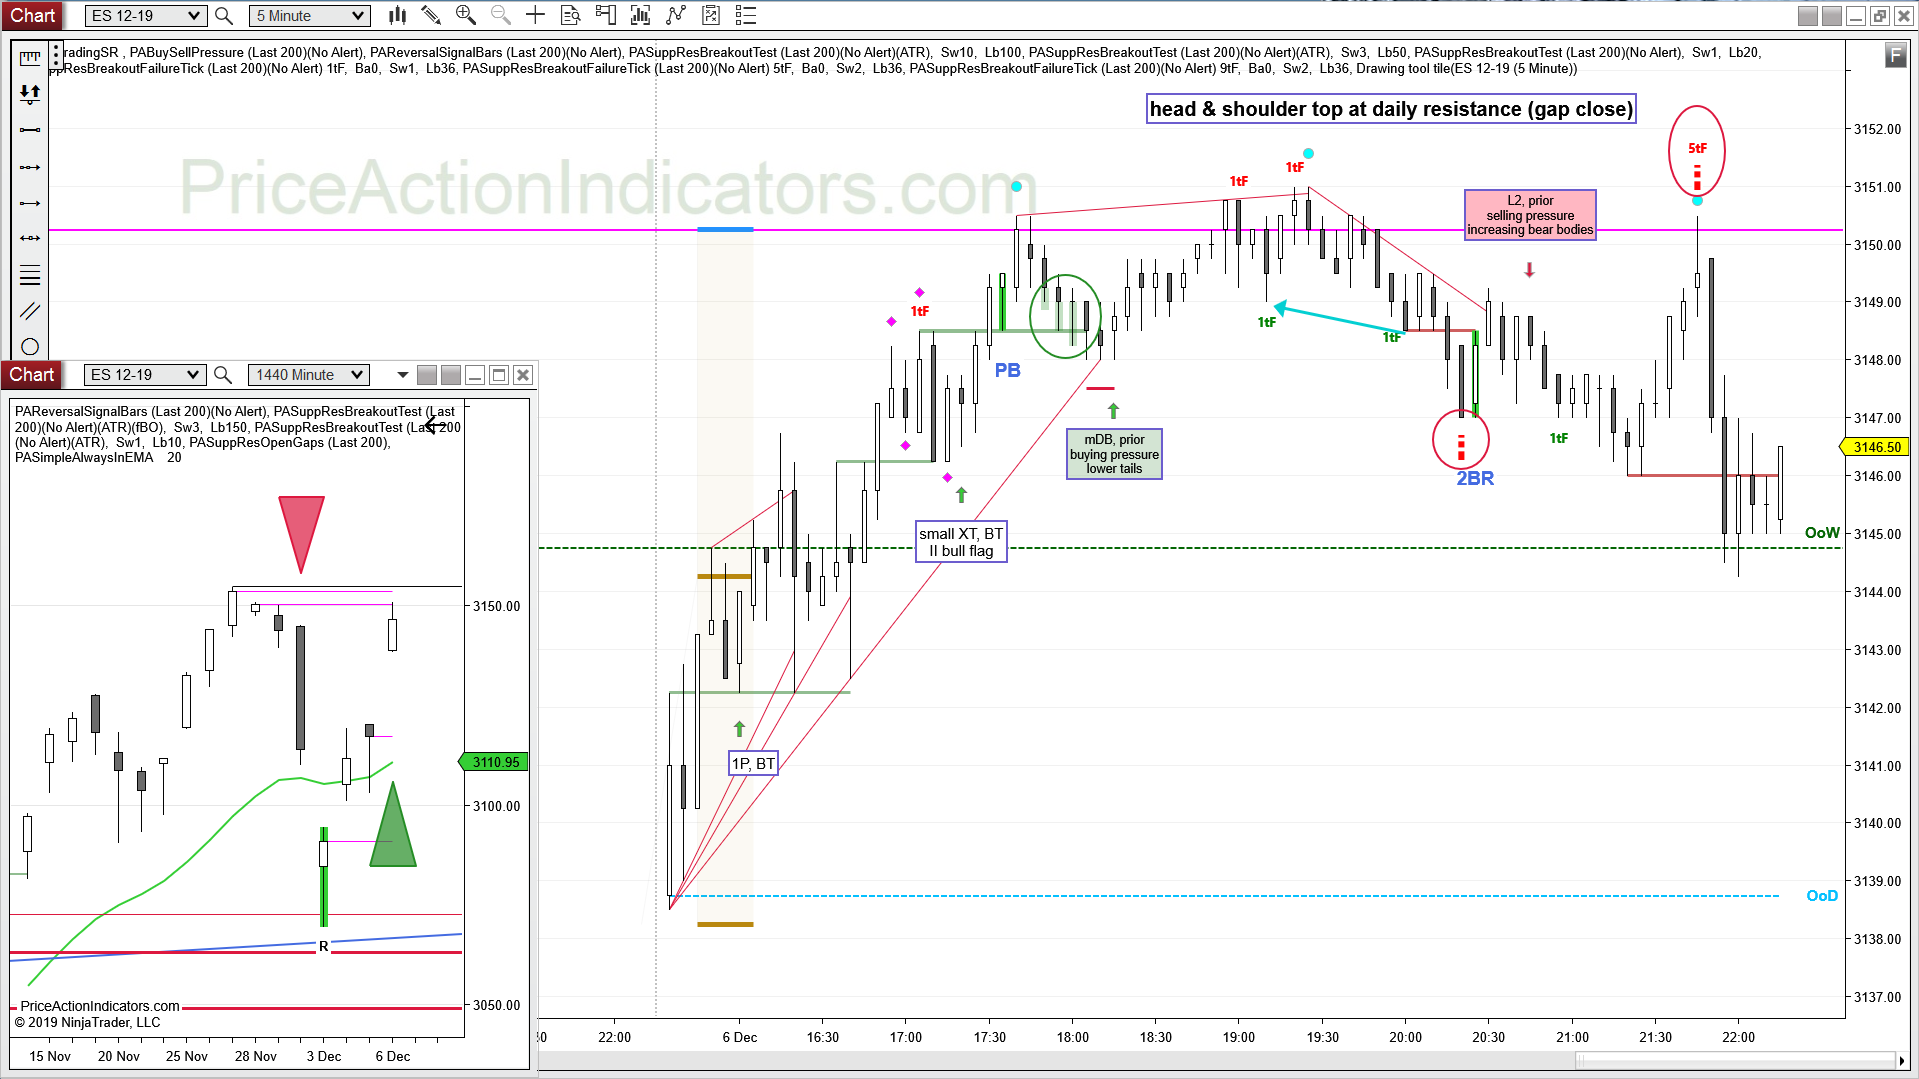
daily chart
Always In Long (AIL) since today
gap close, 2nd push up from Tuesday’s RVB
Here is the “naked” version of today’s chart, with just the indicators applied.
I marked up the nice Buying Pressure (increasing bottom tails) during the pullback to the mDB and the Selling Pressure (increasing bear bodies in a bear move) just before the L2 in the bear CH from the HOD.
