Bull gap, mid range, mDT, BP, BT, fH2, 1W, mDB, L2, 2E, 1tF BT, DB
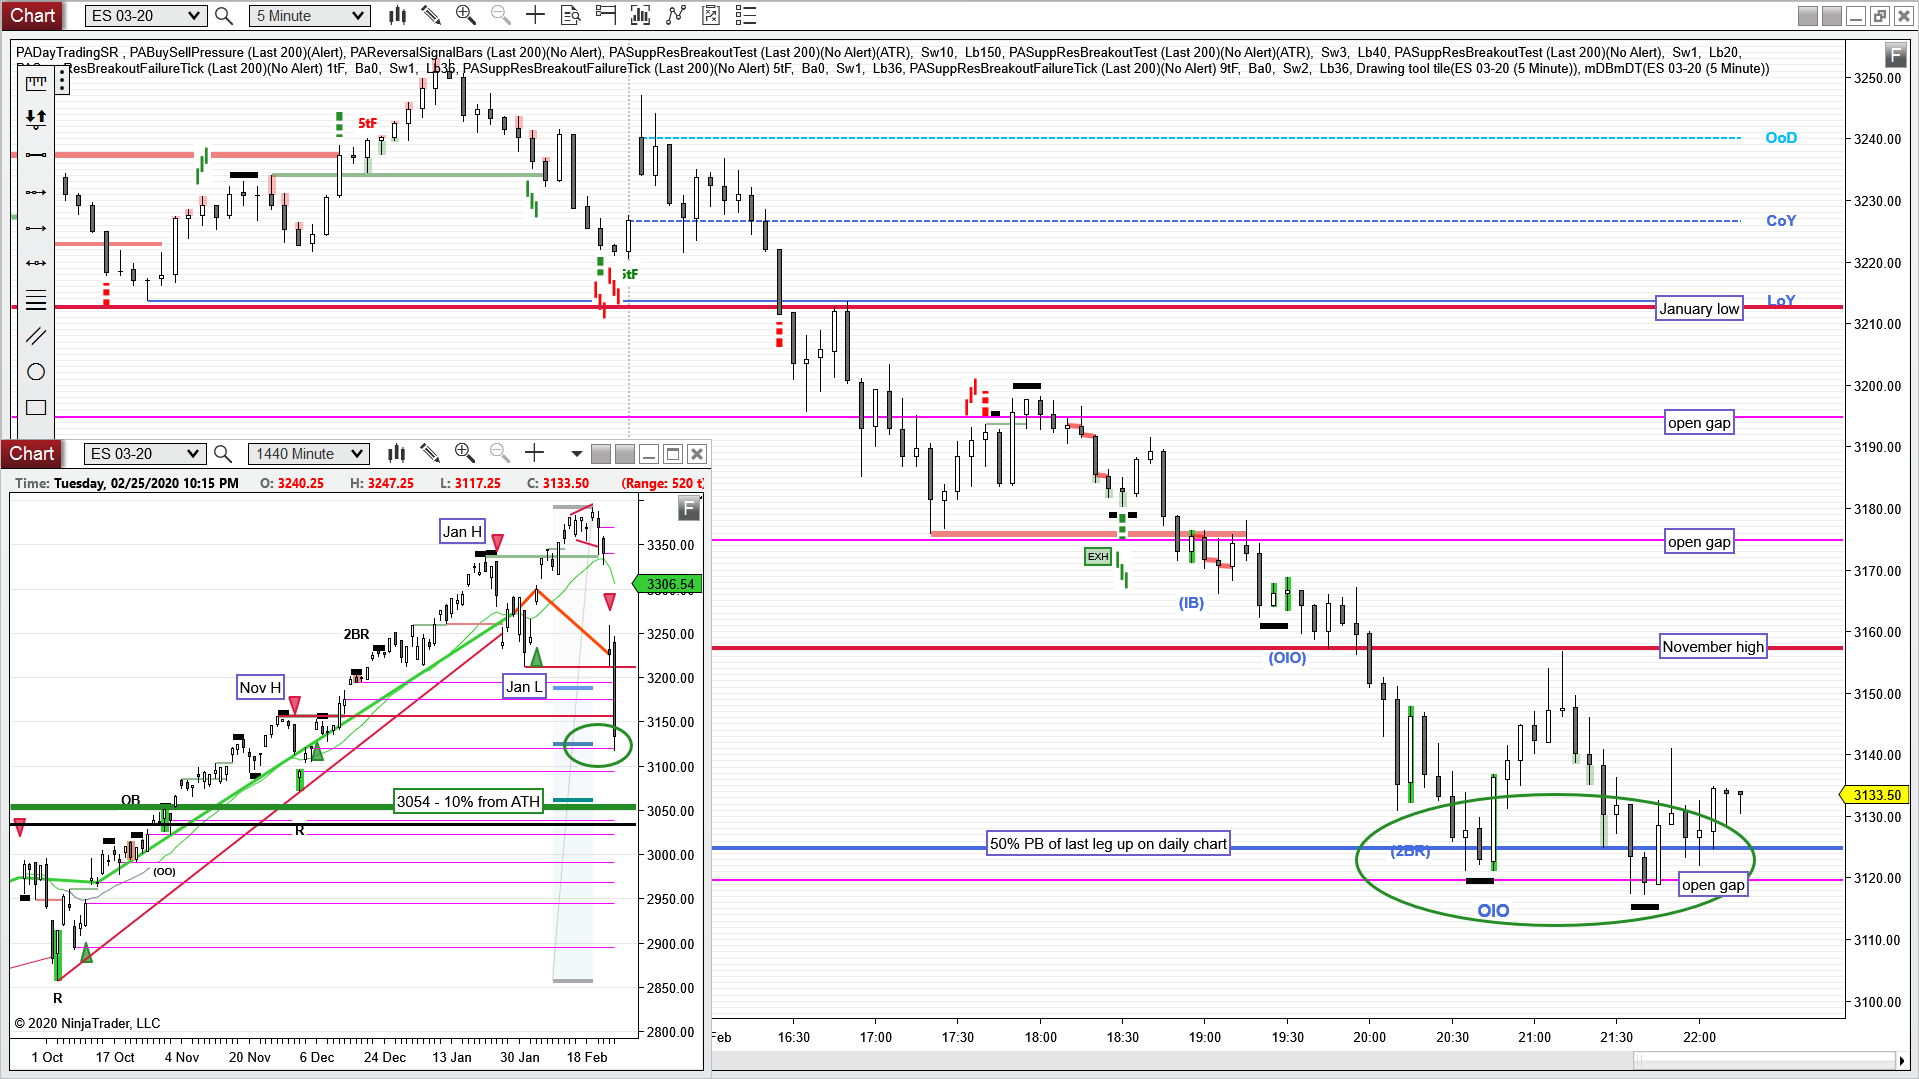
E-mini S&P 500 Future 5 min chart (trend lines, arrows and boxed text drawn by hand)
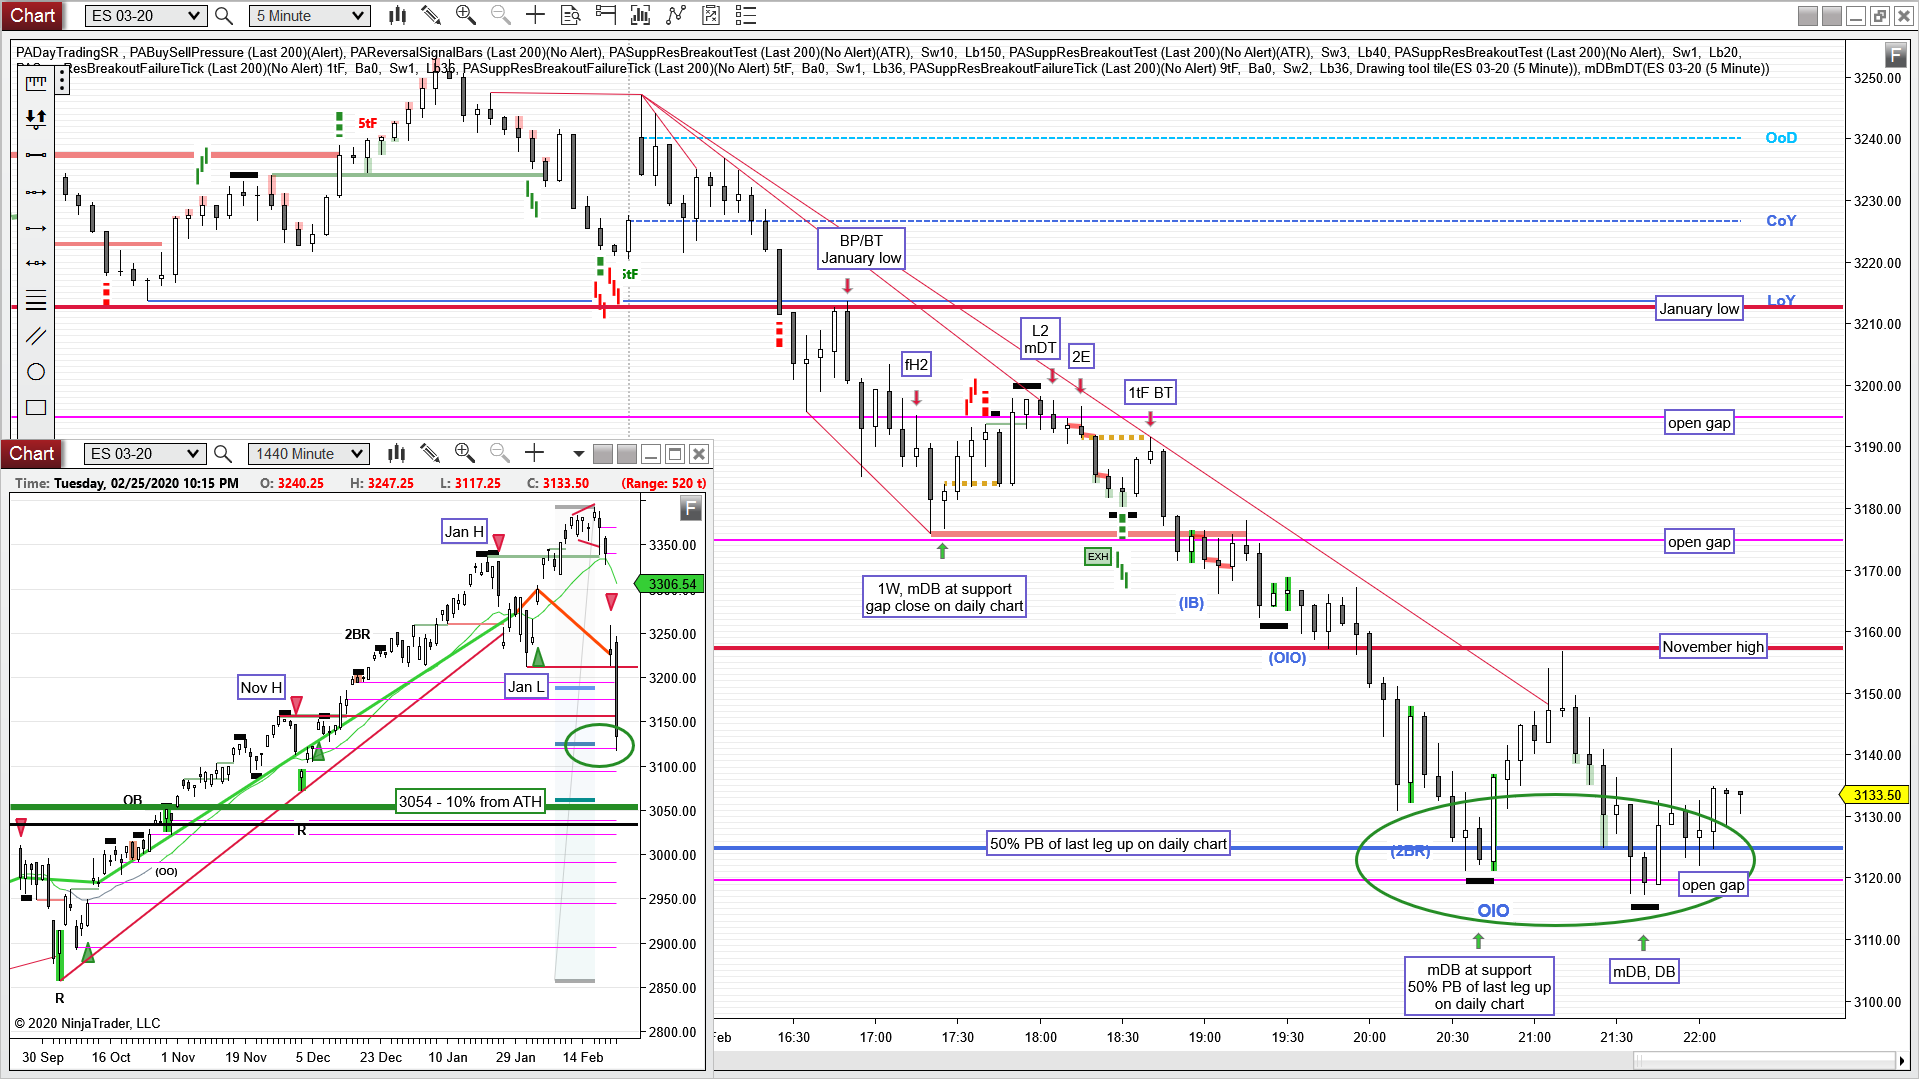
daily chart
Always In Short (AIS) since 02/24
large BO below the January low, triggered S signal on the monthly chart
we closed just above the 50% retrace of the last bull leg
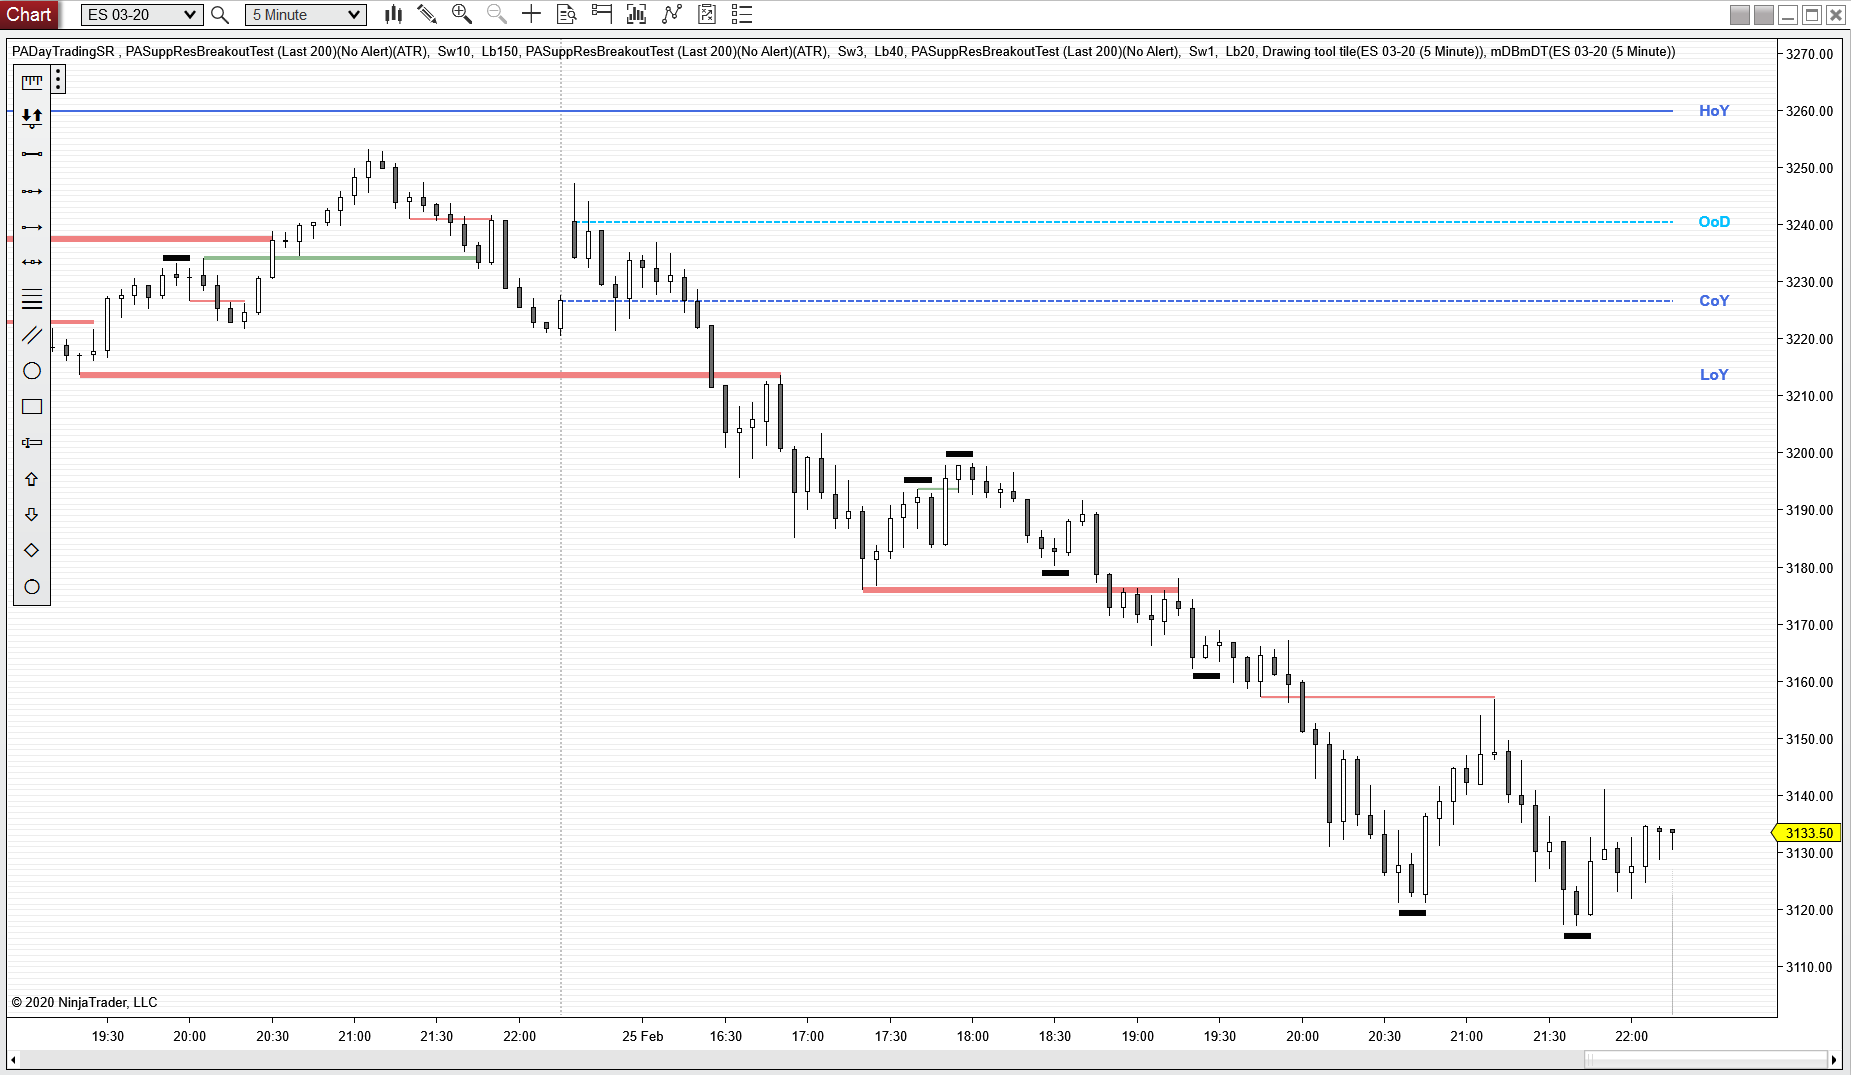
Here is the “naked” version of today’s chart, with just the indicators applied.
can see nicely, how today’s PA used the various support levels for reversals and Breakout Tests