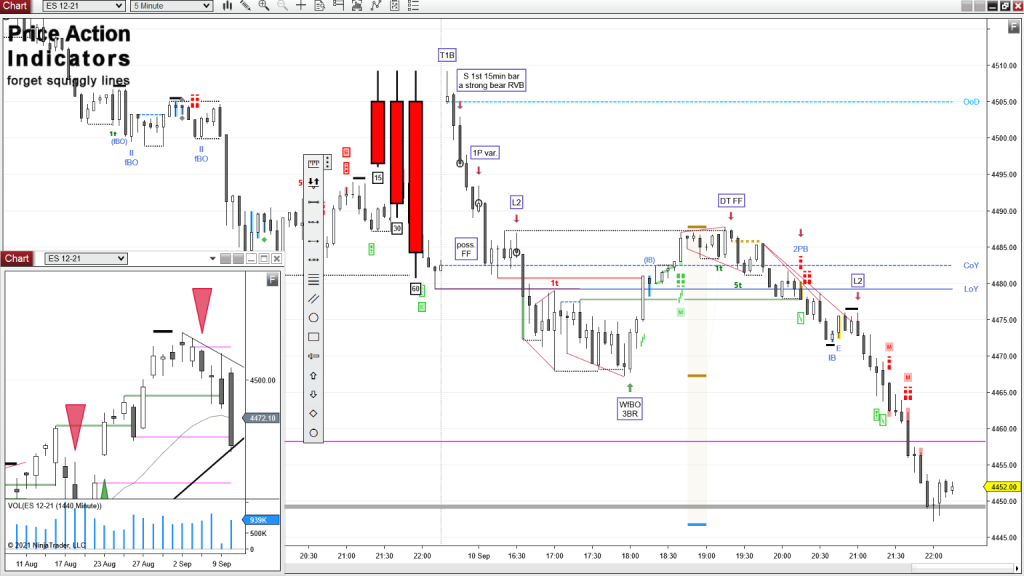
Bull gap mid range, T1B, 1P, L2, WfBO, DT, FF
Sell below the 1st 15 min bar, which is a strong bear reversal bar
the 60min ETH chart has a double top and the HOD tested it’s neckline
now we’re at 2x initial risk, if a bear short on a break below the neckline and has the height of the pattern as initial risk, we might see some profit taking soon
daily chart
Always In Short (AIS) since 09/07
Possible sell climax
Close just above the bull trendline from the Corona low


