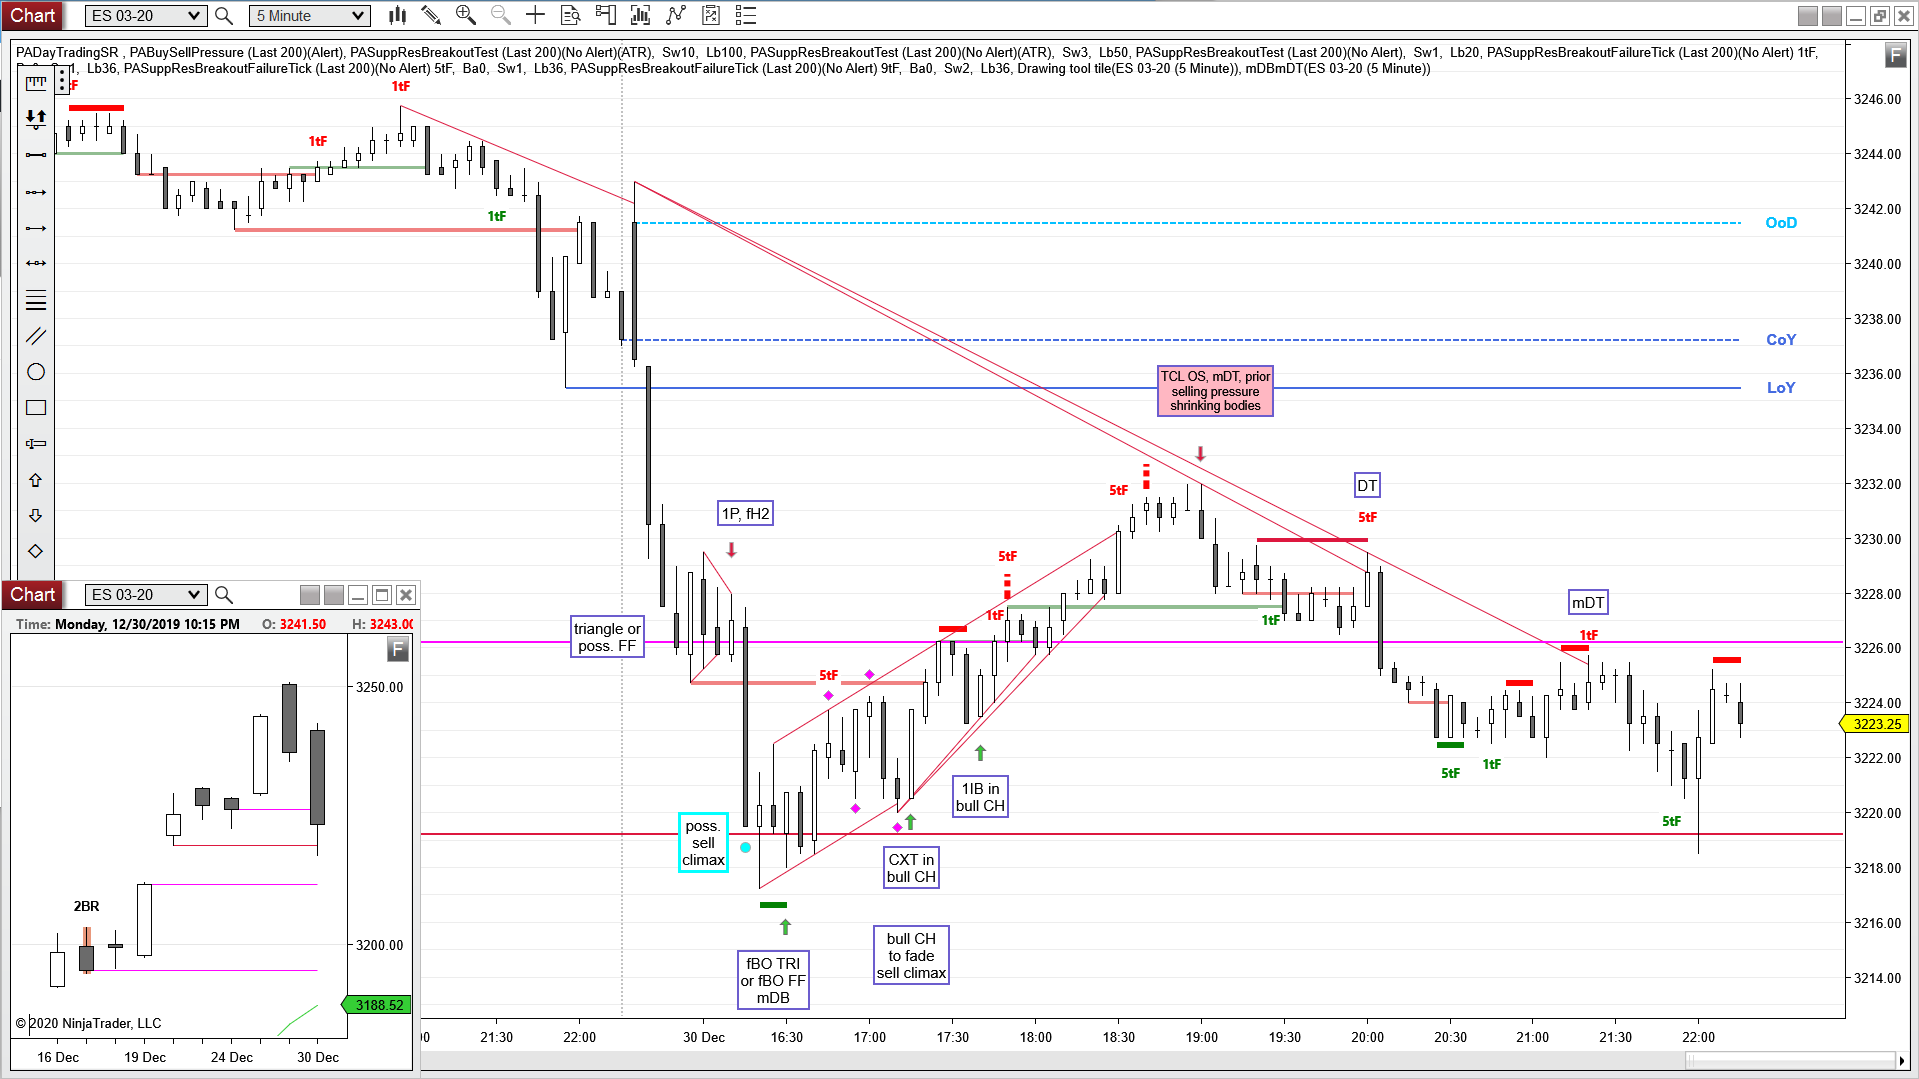
Continuation, Opening Range, mW, fBO, mDT, DT, bull MC, 1CHBO, H2, bear CH, DT, 1IB, BP
can compare the PA to 12/31, 01/03 and 01/06
on all of those days b1 was a fBO LOY, but today that fBO happened already during the overnight session, we sold off 50 pts below LOY and made it back into yesterday’s range
B above large b1 (with a stop below) worked for a couple of legs higher
E-mini S&P 500 Future 5 min chart (trend lines, arrows and boxed text drawn by hand)
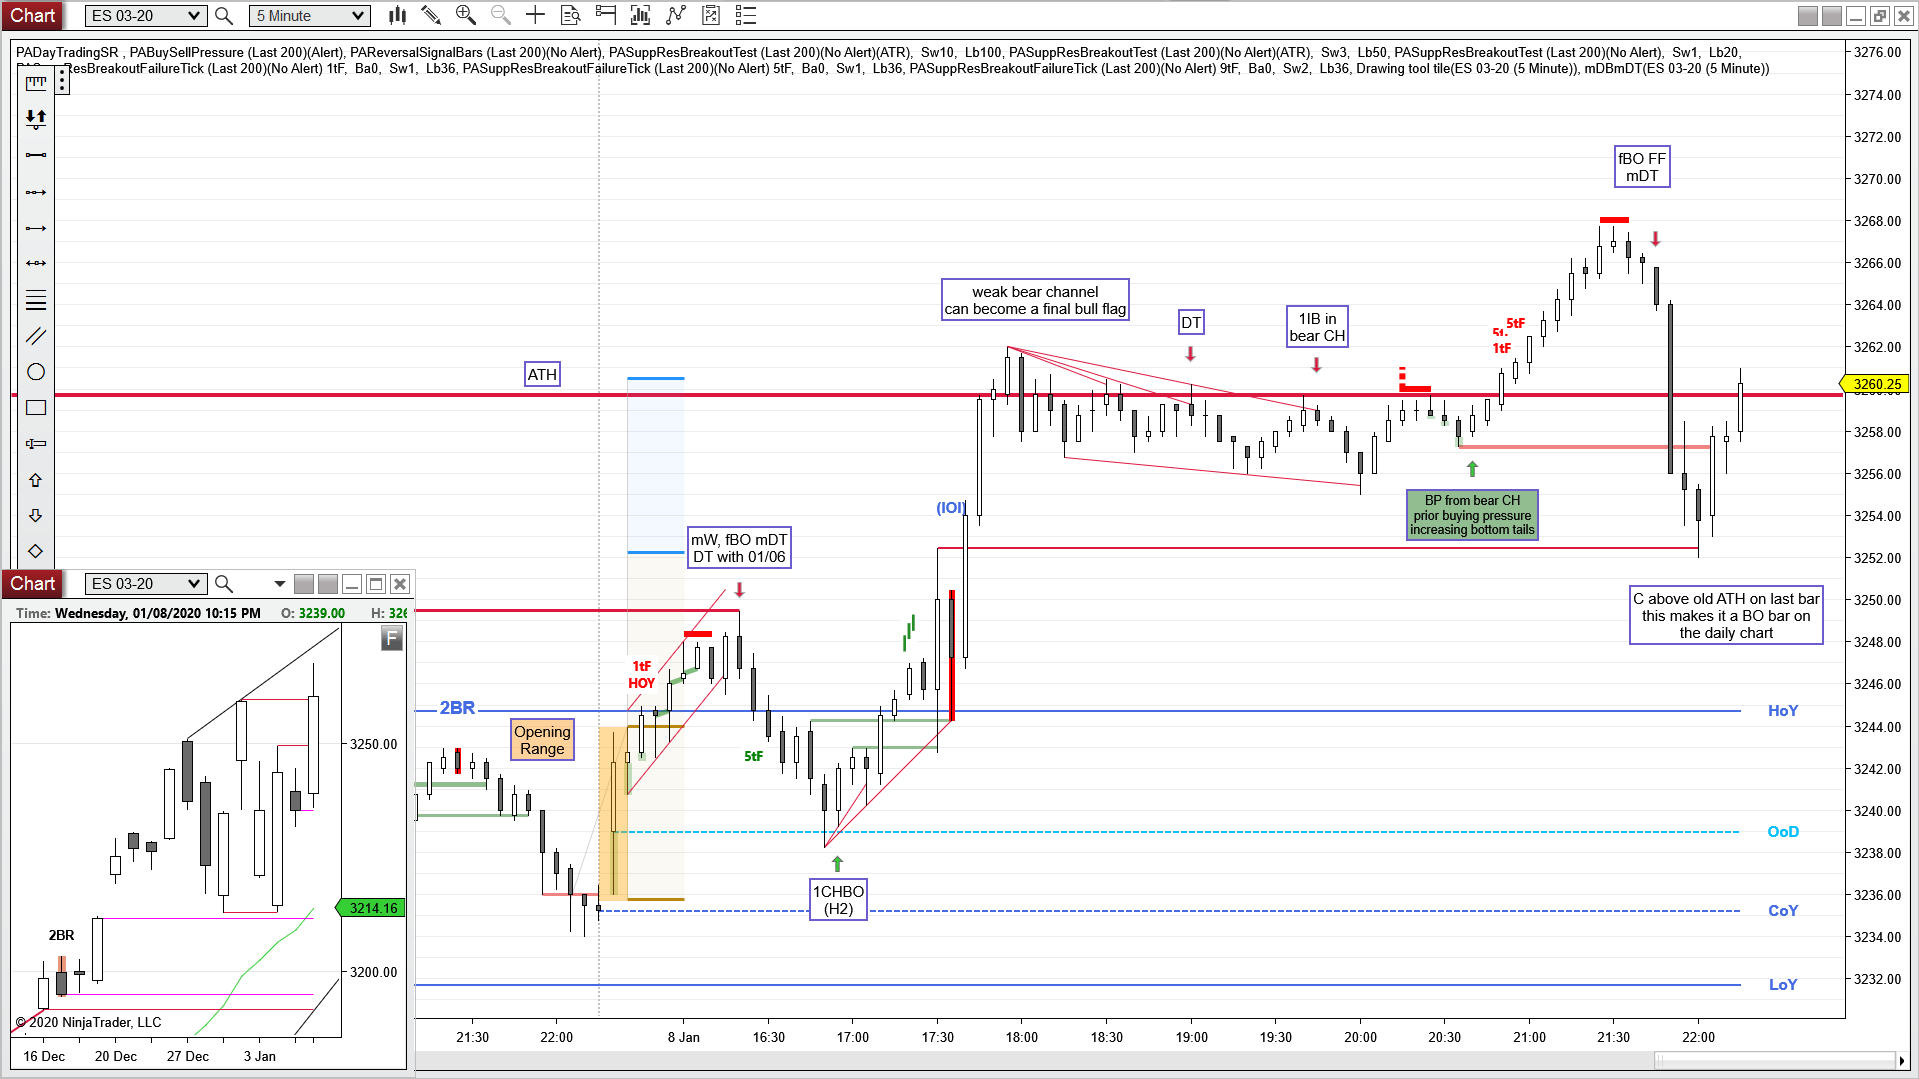
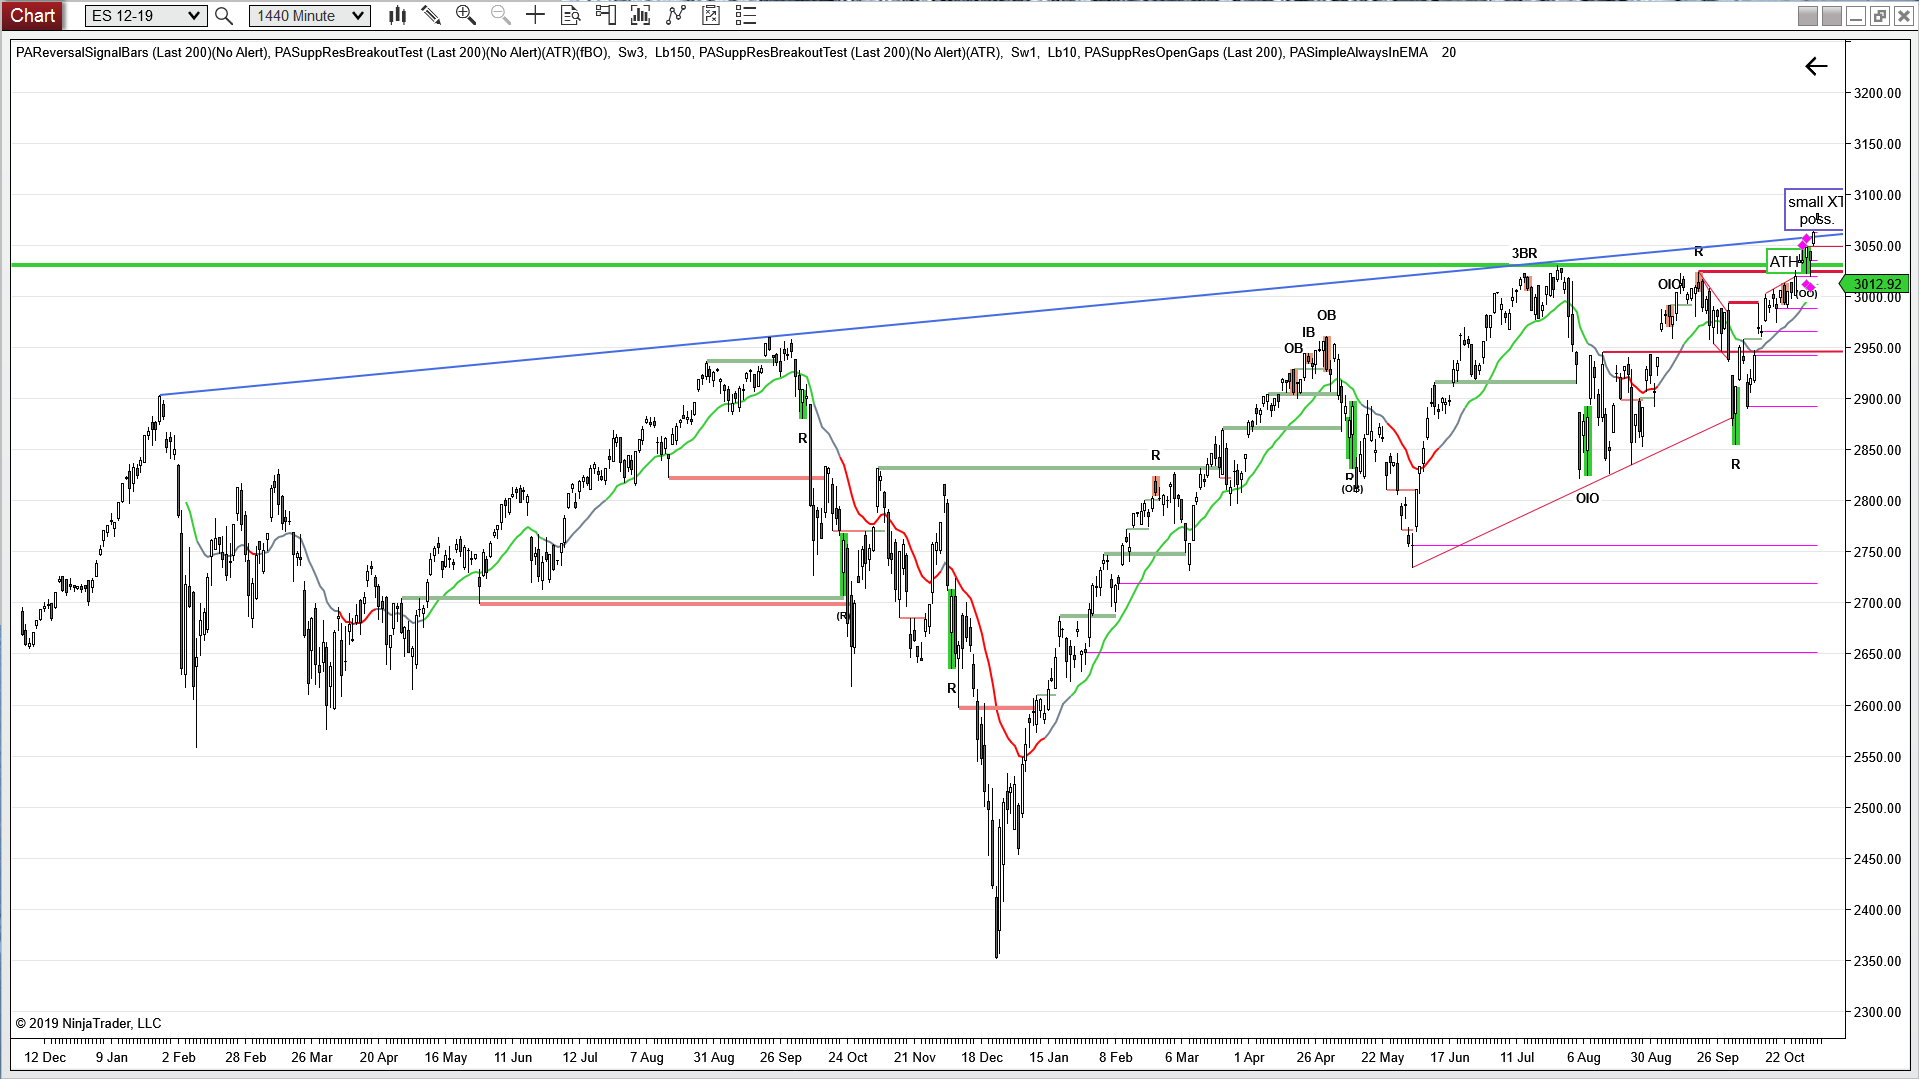
daily chart
Always In Long (AIL) since 12/06 – one month!!
BO and close above old ATH, more up