E-mini ES 2018/11/07

Bull gap, above HOY, OR (b1), 1fBO, 1W, W1P, 1P, SC, 1Tail, BT, BP
a nice point landing at the gap price
b1 is again a classic misplaced RVB, caution

daily chart
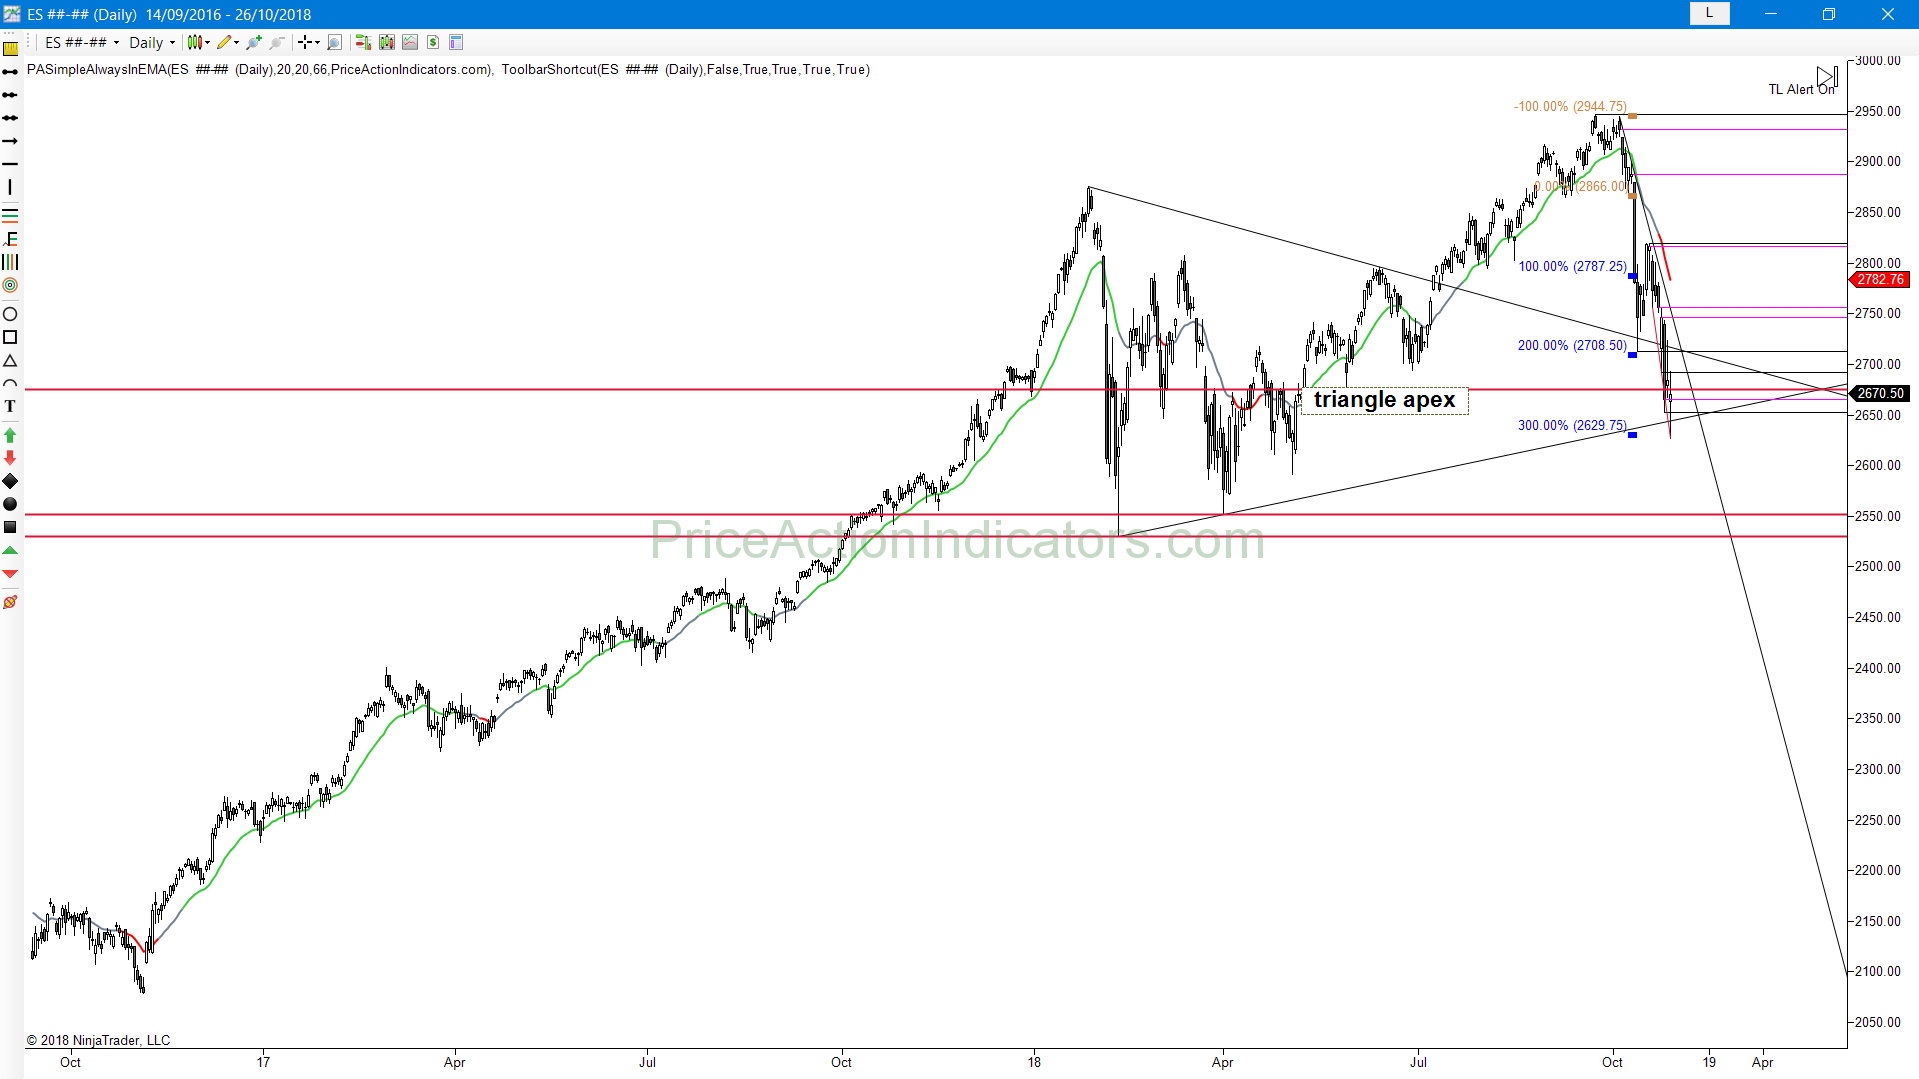
we opened ABOVE the 50% Fibonacci retrace of the entire bear move, tested that and formed a nice bull TB, a FT bar for the BO from Y, gap close with 10/17
but bears might see an exhaustion bar closing on the high near resistance, fH2 to short lmt C

E-mini ES 2018/11/01

Bull gap, mid range, OR, bear CH, fEB, 1W, W1P, CXT, mDT, OIO, bull CH, fBO, DT, HH MTR, BP, mDB, 1tF EB

bears tried to SA swings the entire day, but failed to keep price from breaking HOY

daily chart
bulls managed to not let the bear RVB trigger, it became a BP for the IOI
bears probably try to SA, next resistance is the daily EMA and the two gaps to close

E-mini ES 2018/10/31

Bull gap, above HOY, OR (b1,b2), BP, 1tF BT, 1W, DB, fL2, bull CH, CXT, XT, HH MTR, mDT

the DT TT and XT is a HH MTR

daily chart
shaved C RVB at the bear TL, bulls don’t want this to trigger short

E-mini ES 2018/10/30

Continuation, failed XT, DB, DP, large fL2, XT, HL MTR, BP, BB, SC
(the BP is no II)

daily chart
IOI for the bulls, a 2E at the TRI TL

some bears probably will exit, if that triggers (some above the HOY, some above the high of the entire pattern)

E-mini ES 2018/10/29

Bull gap, mid range, bear CH, 1fBO, L2, fBO, fH2, DT, 1Tail, BP

daily chart
bears PT at 1xMM of the last PB (a classics risk/reward based trade)

you short the BO (stop entry) of the extreme of the trend and place your stop loss above the last LH, then PT at 1xMM of your risk
in a bear trend this trade has a probability of > 50% so you have a positive traders equation