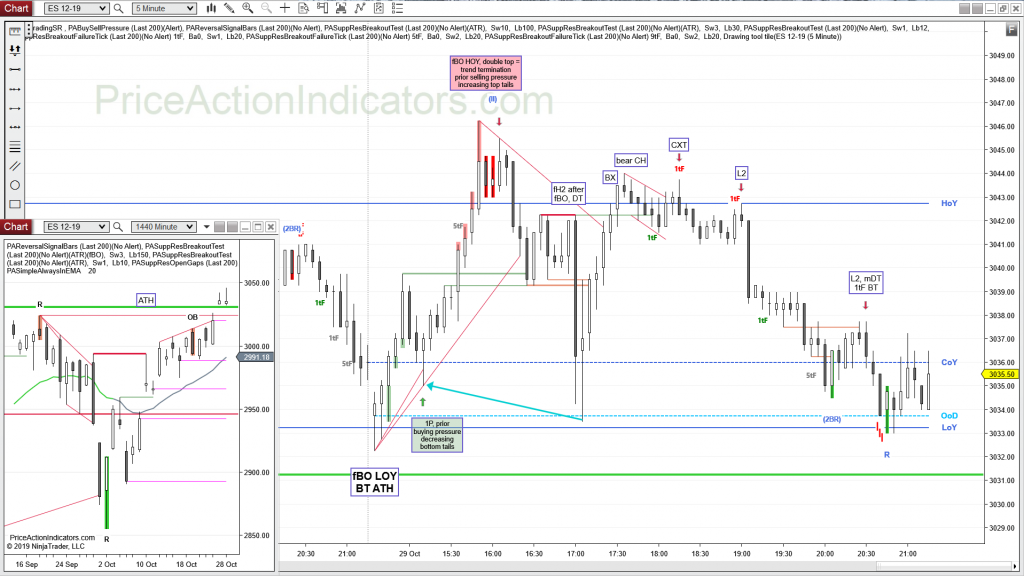
E-mini ES 2019/10/29

Continuation, fBO, 1P, DT, fH2, BX, bear CH, CXT, L2, 1tF BT

E-mini S&P 500 Future 5 min chart (trend lines, arrows and boxed text drawn by hand)

daily chart
Always In Long (AIL) since 10/10
micro Double Top with yesterday’s TR bar
but FOMC tomorrow

E-mini ES 2019/10/15

Bull gap, above HOY, T1B, SC, 1P, BX, H2, DB, BP, L5
bull trend day, a CH often becomes a leg in a TR
after the L5 we took out the start of the bull CH

The Reversal Signal Bars indicator gave a 2BR reversal signal pattern at the HOD. The 2nd trend channel line overshoot (TCL OS) was a nice strengthener.

E-mini S&P 500 Future 5 min chart (trend lines, arrows and boxed text drawn by hand)

daily chart
Always In Long (AIL) since 10/10
Buyers above yesterday’s failed bear Entry Bar
third push from the Reversal Bar (R) a couple of days ago
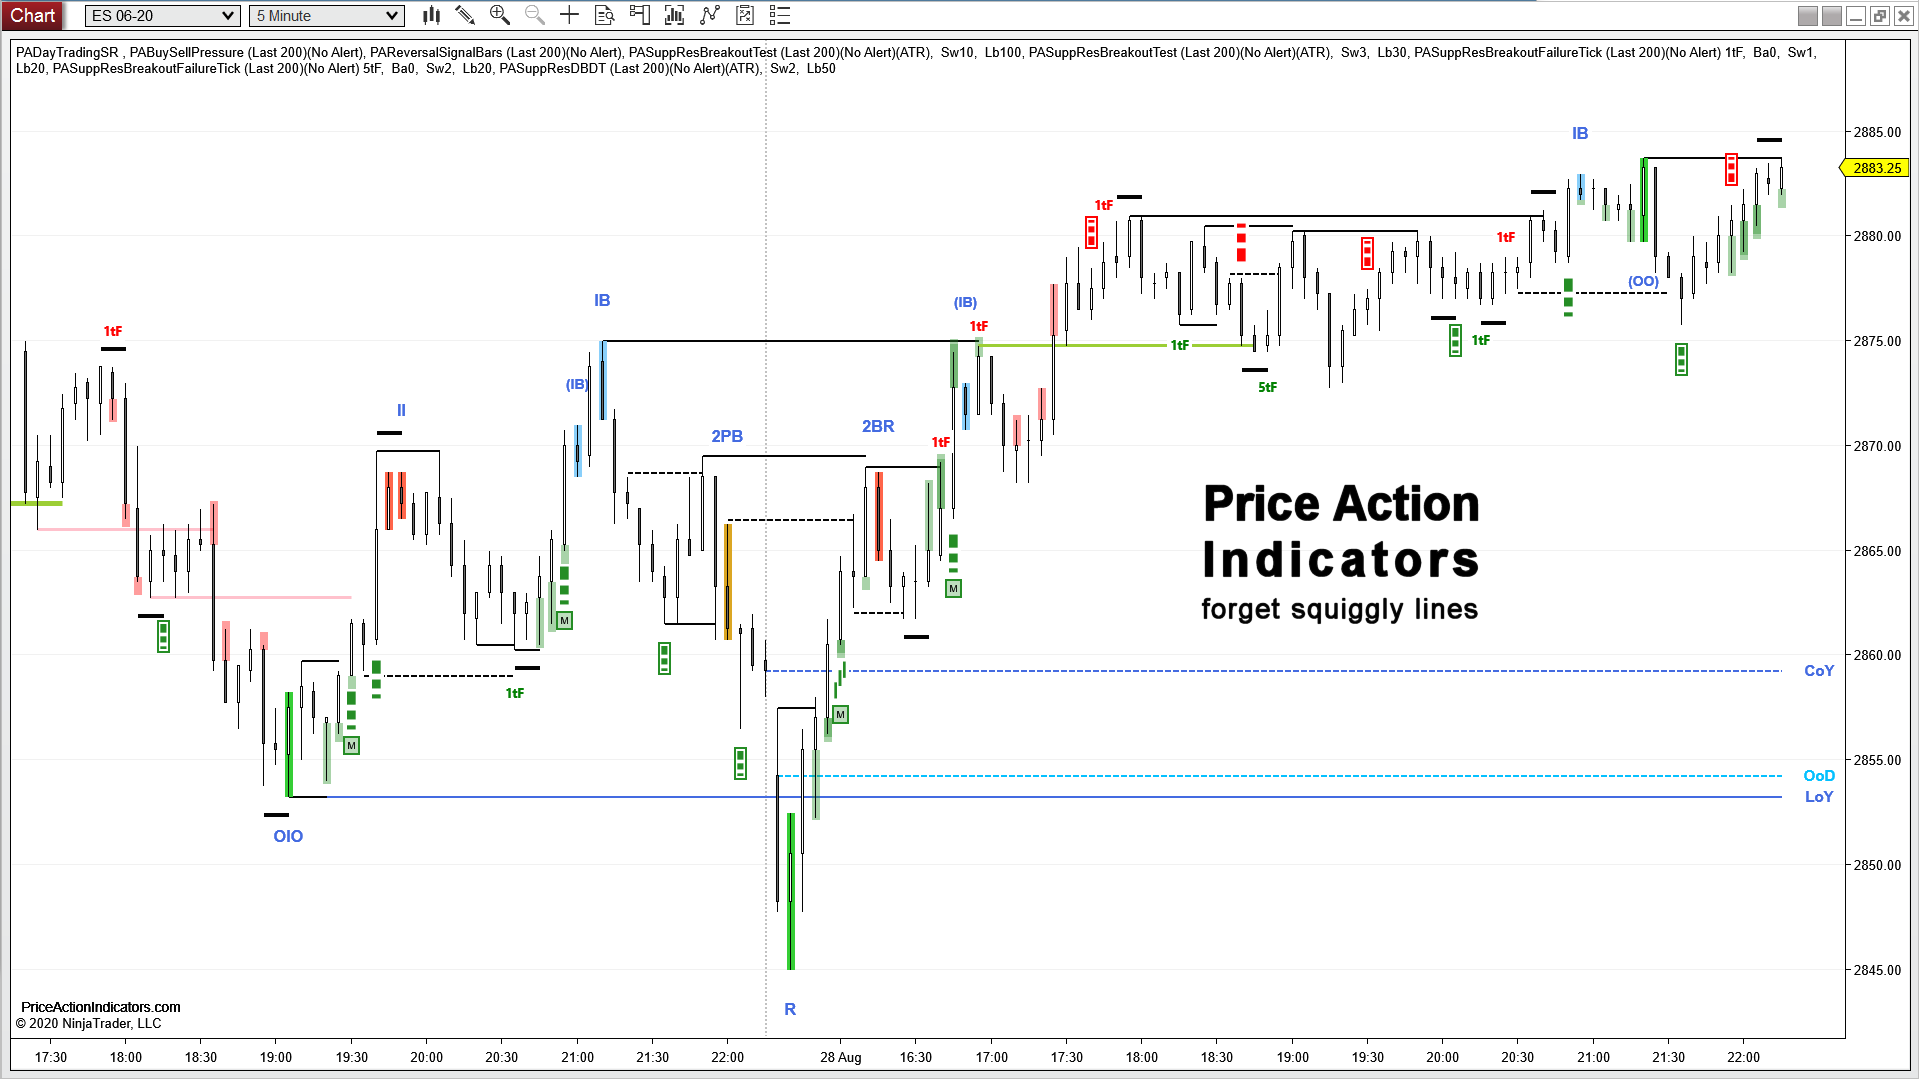
E-mini ES 2019/09/05

Bull gap, above HOY, Opening Range, T1B, 1Tail, BX, PW, SC, 1IB, BT

I left early

daily chart
Always In Long (AIL) since 08/29
Breakout from the August tight trading range
also breakout above the neckline of the DT at the the ATH

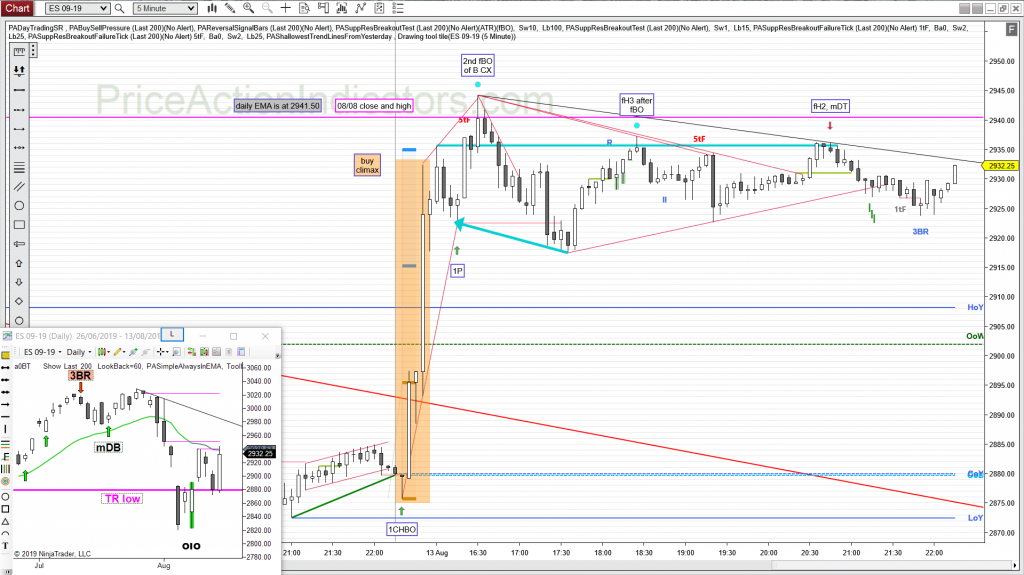
E-mini ES 2019/08/13

Continuation, 1CHBO, (of Y bull SC), BX, 1P, fBO, fH3, fH2, mDT
a Buy climax is a trading range, look for fBO

daily chart
Always In Long (AIL) since 08/08
2nd push up from the OIO reversal from last week (as I mentioned Y)
Sellers / PT at the EMA and above last weeks H


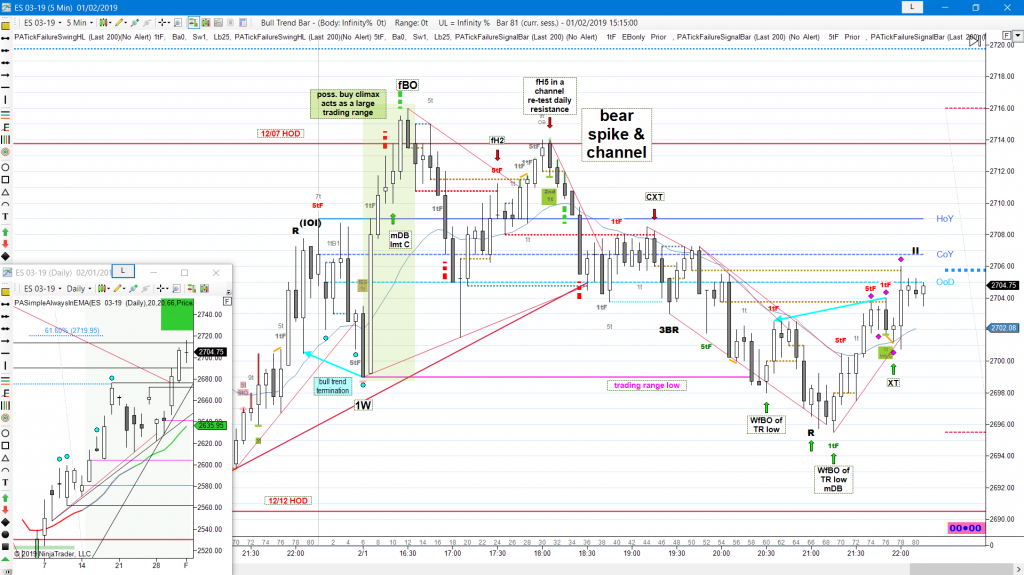
E-mini ES 2019/02/01 #ES_F

Continuation, 1W, mDB, BX, fBO, fH2, fH5, bull CH, SC, CXT, WfBO, XT

daily chart
Always In Long (AIL) since 01/04
bulls got a doji as follow through of follow through, but it has a close below mid bar
bears might wait until the 62% retrace of last year’s sell-off (2720), or short the COY and above the HOY, like they did today and yesterday