Bull gap, above HOY, fBO, T1B, 1P, mW, W, W1P, bull MC, 1CHBO, H2, DB, bear CH, CXT
About the Charts
daily chart
Always In Long (AIL) since 05/18
failed Breakout, but no close below the high of last week

for NinjaTrader® – Forget Squiggly Lines!
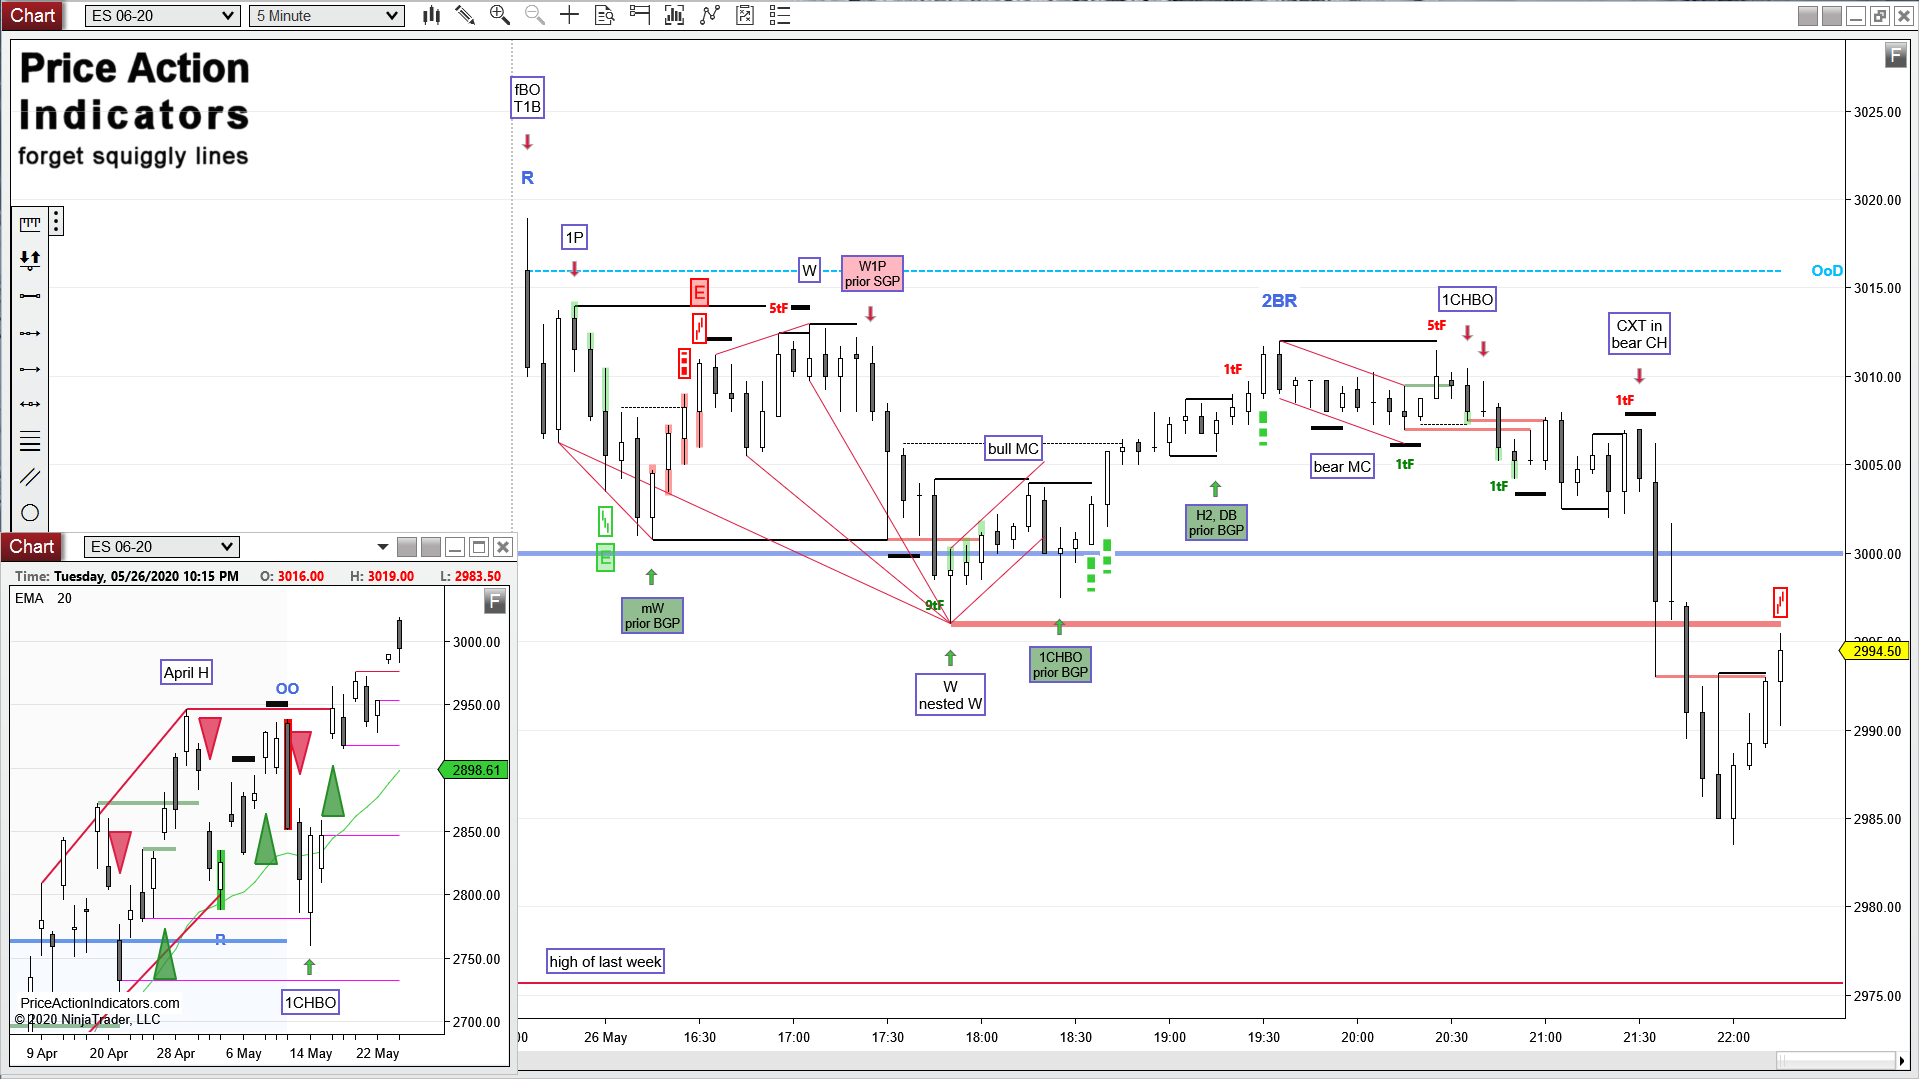
Bull gap, above HOY, fBO, T1B, 1P, mW, W, W1P, bull MC, 1CHBO, H2, DB, bear CH, CXT
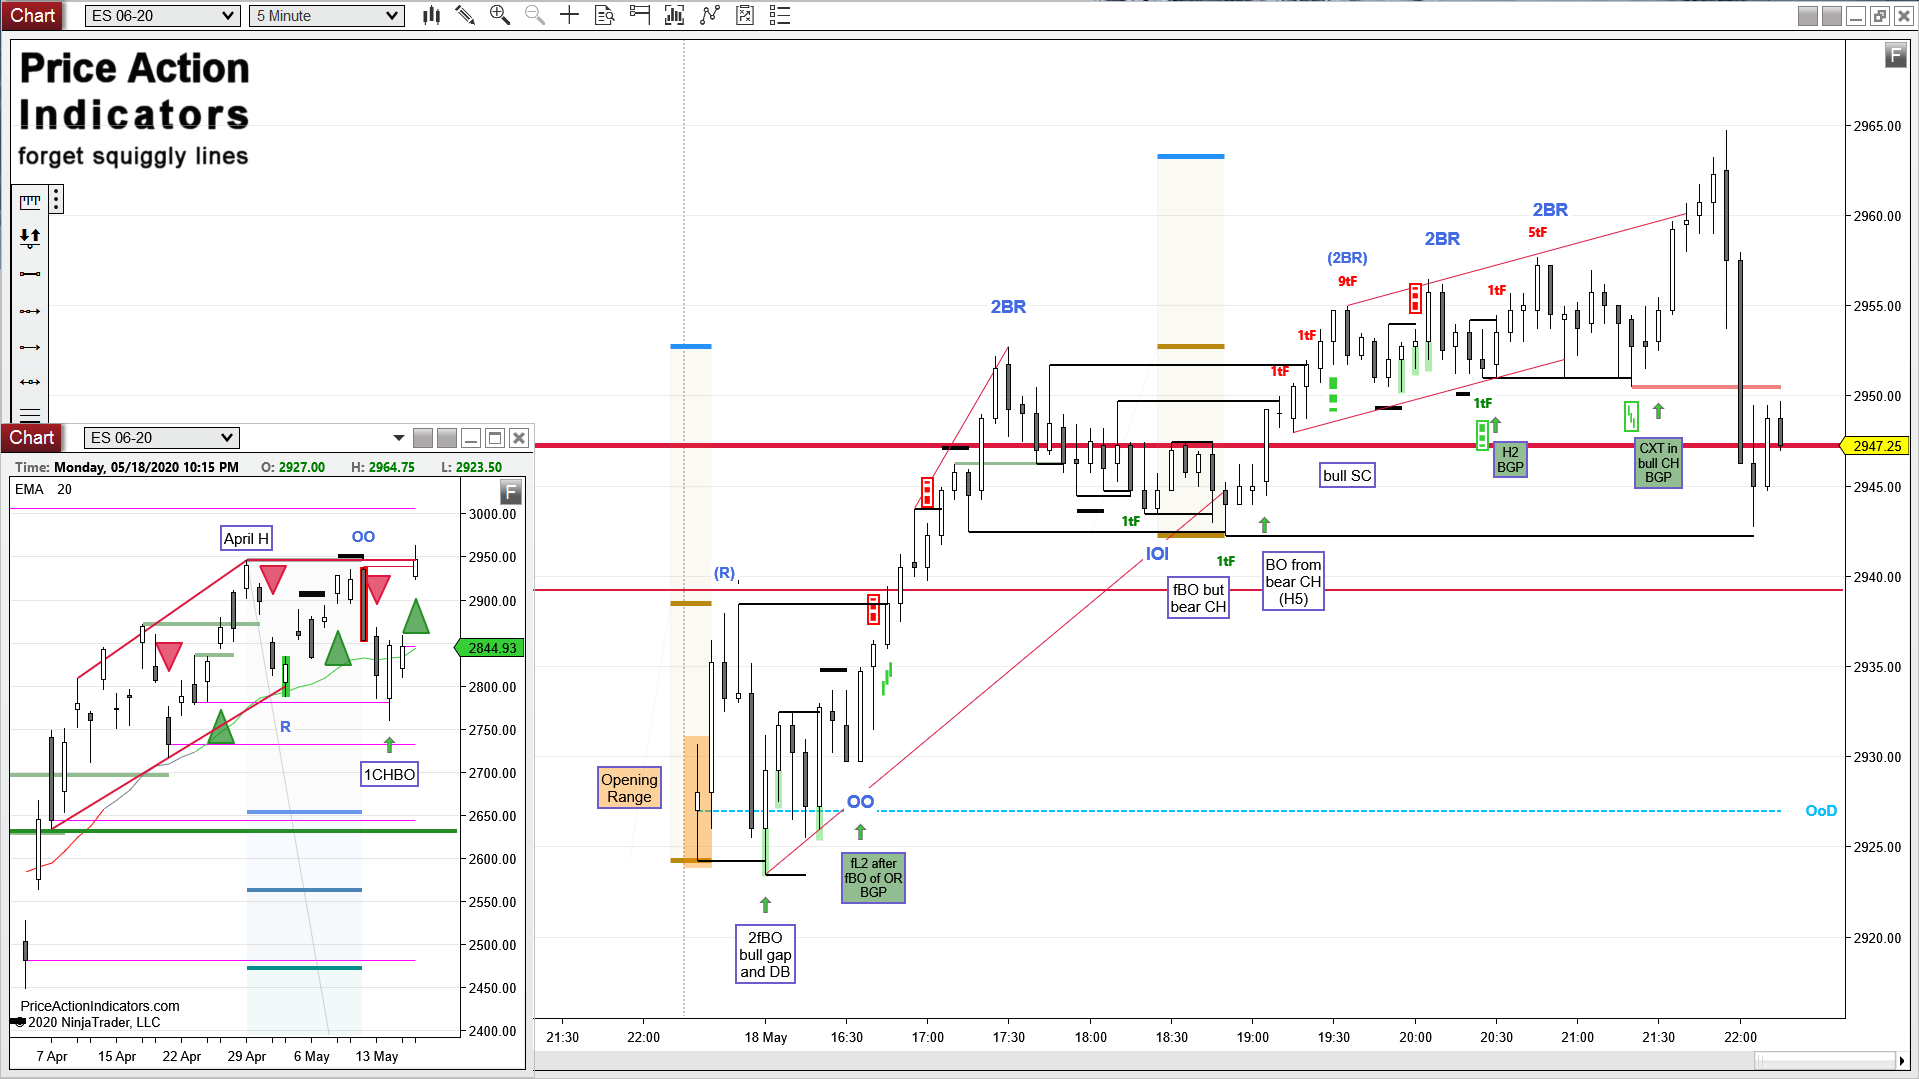
Bull gap, above HOY, Opening Range, 2fBO, DB, fL2, W, fBO, bear CH, SC, H2, CXT
Bull gap and Double Bottom is a classic
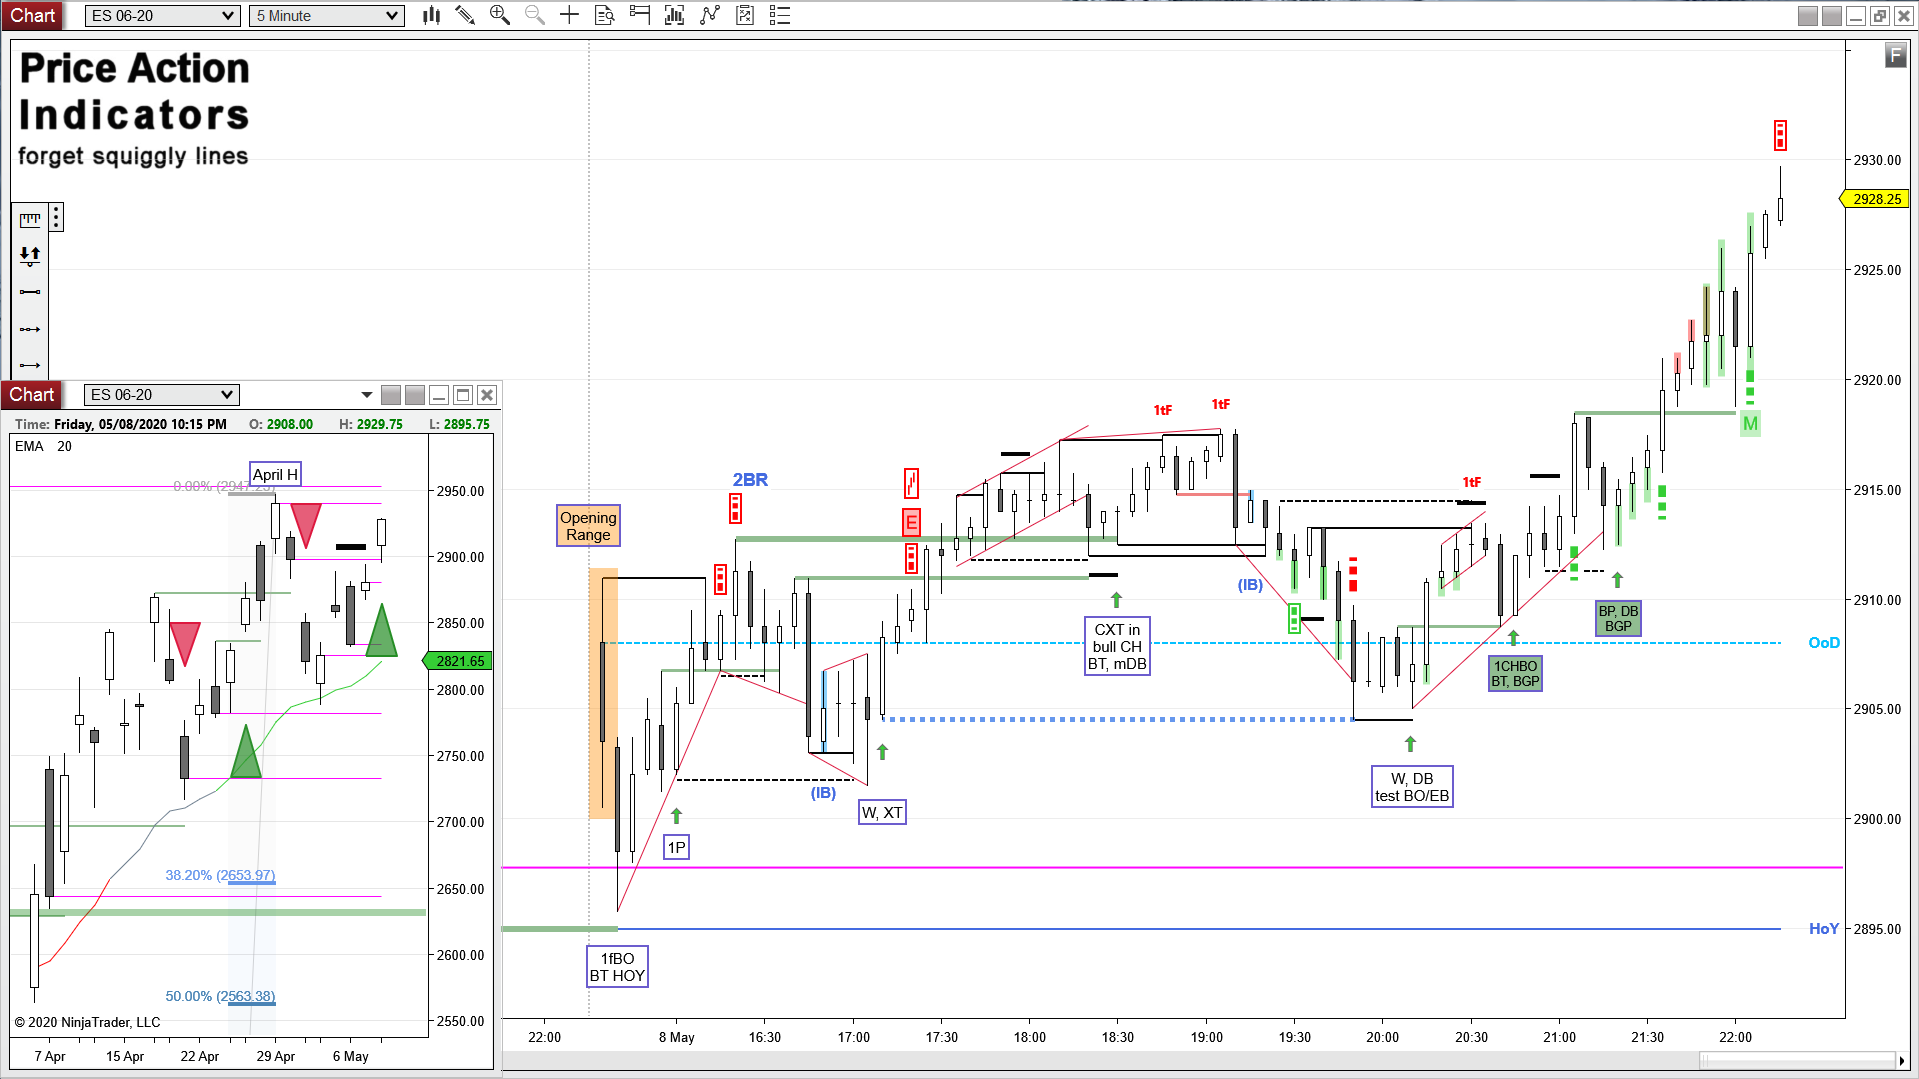
Bull gap, above HOY, Opening Range, 1fBO, BT, 1P, W, XT, bull CH, CXT, mDB, DB, 1CHBO, BP
forgot to mark up b11, it’s a WfBO of the Opening Range
Bull gap, mid range, fBO, 1fBO, 2fBO, W, fL2, 1P, mDB, BP TRI, H2, DT, DP, XT, L1, L2, CXT, bear CH, WfBO
b2 is an Outside Bar at the HOY, a Trading Range at resistance, SA
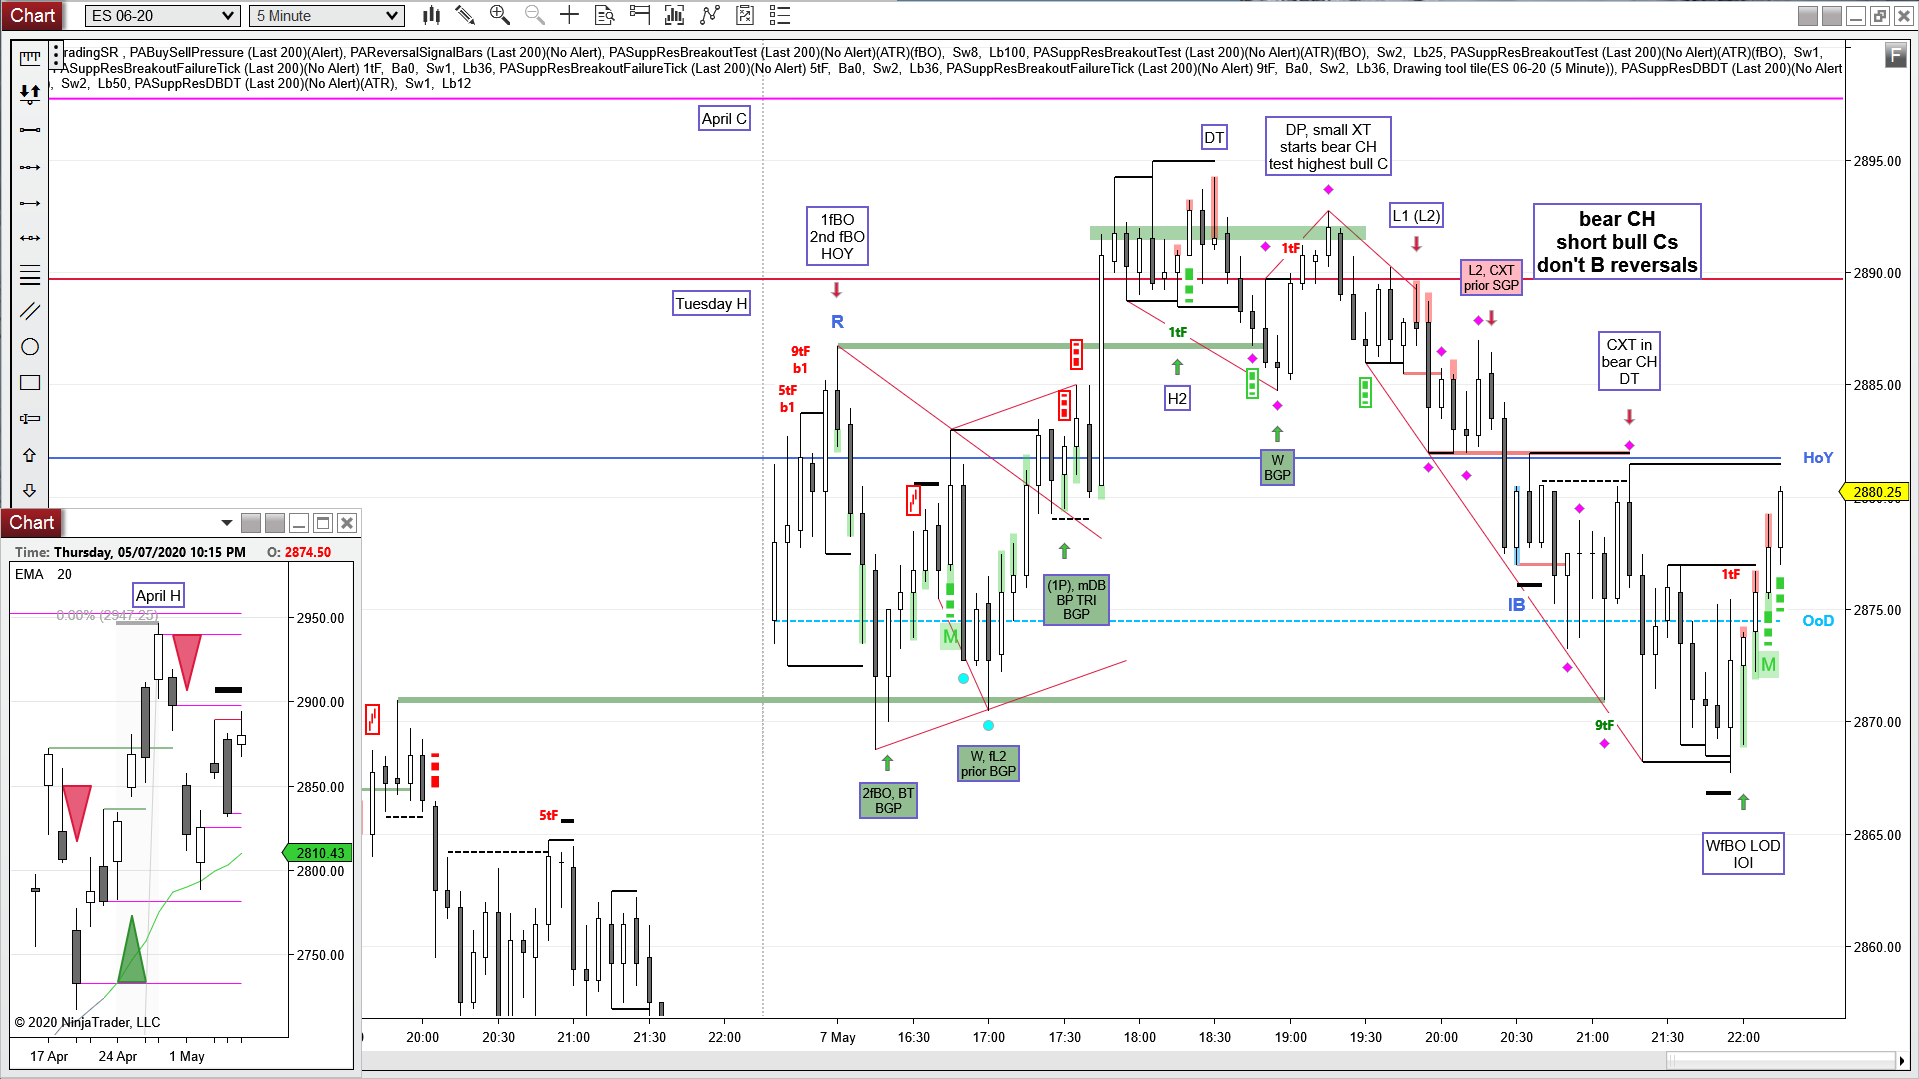
aggressive bulls B the COY (as I mentioned yesterday)
small Trading Range bar
Bull gap, mid range, Opening Range, 1fBO, DB, bull SC, CXT, W, mDT
FOMC report
Two nice shrinking bodies signals from the Buy Sell Pressure indicator. One at the HOD before FOMC and one on the pullback after that. Check on the “naked chart”.
The pullback after FOMC was a nice breakout test of the 62% Fibonacci retrace of this year’s sell-off (blue line and yellow arrows).
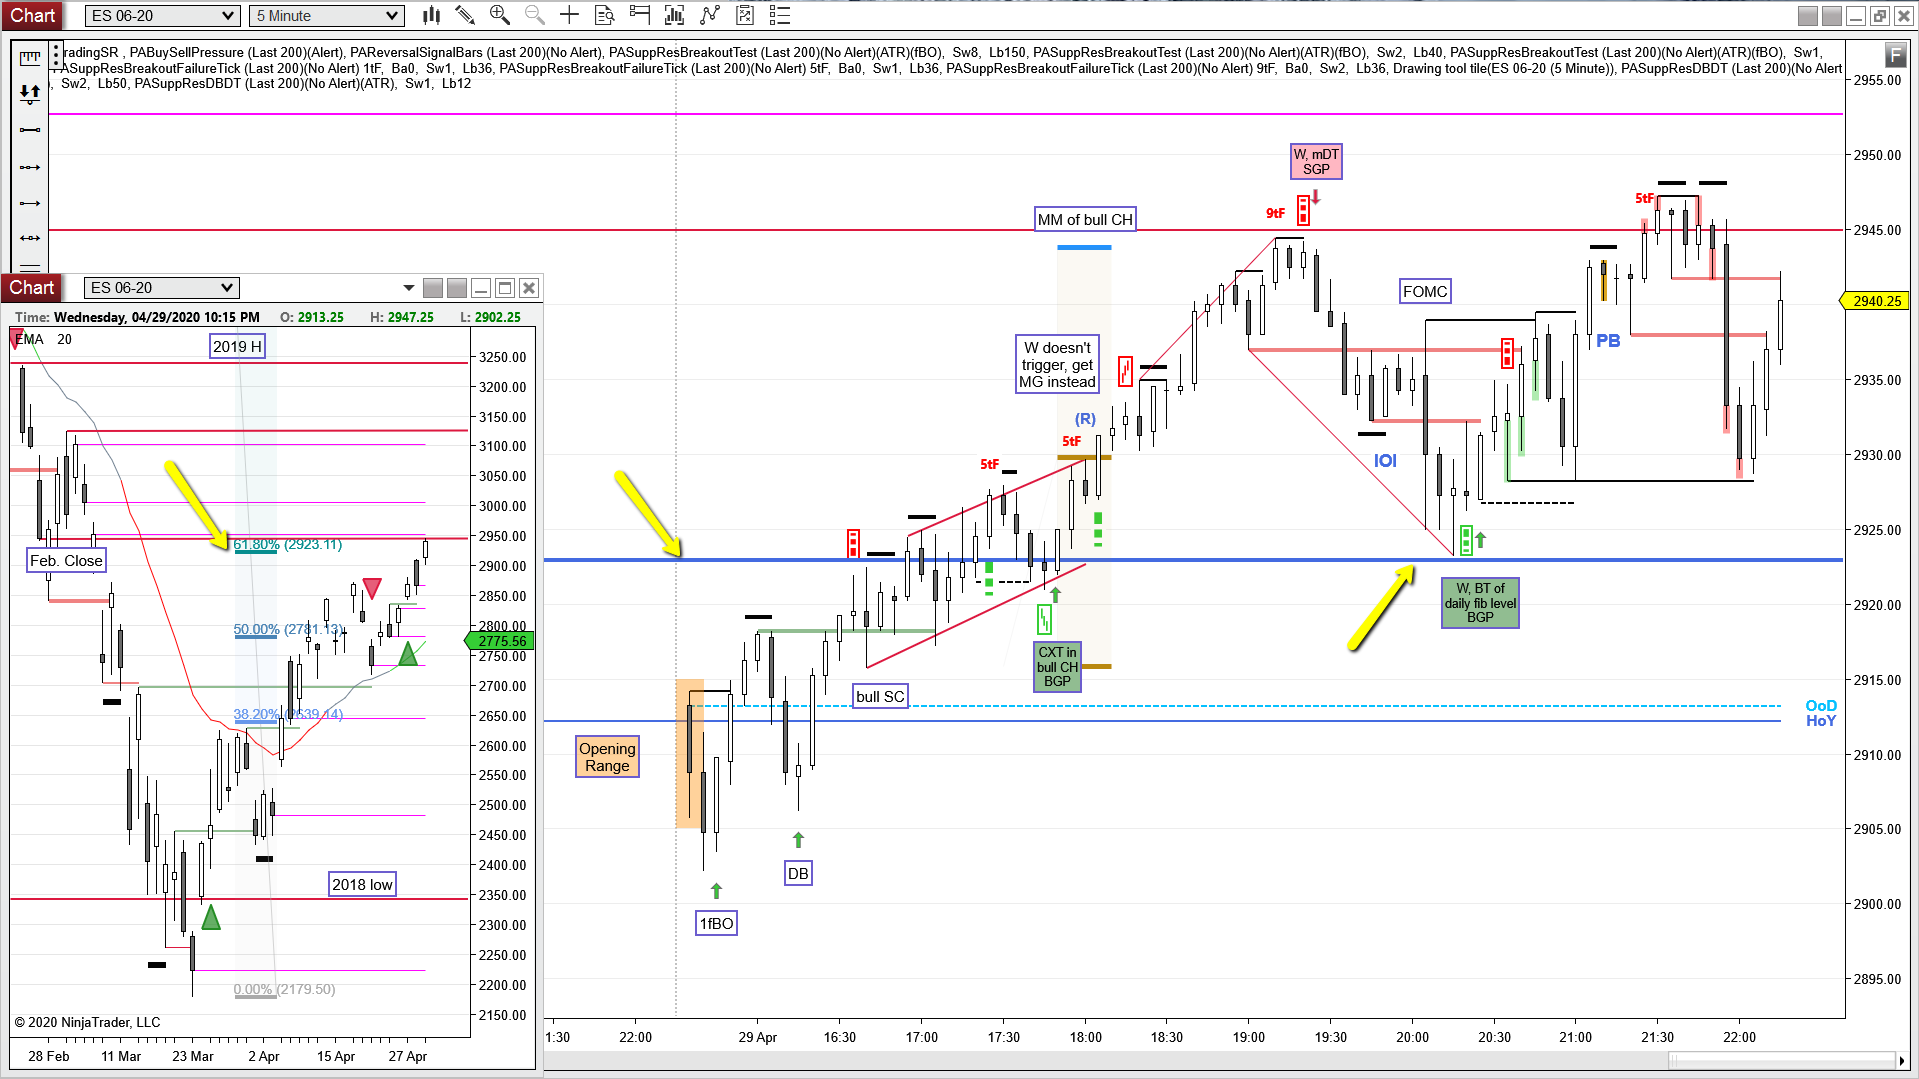
test of the 62% Fibonacci retrace of this year’s sell-off