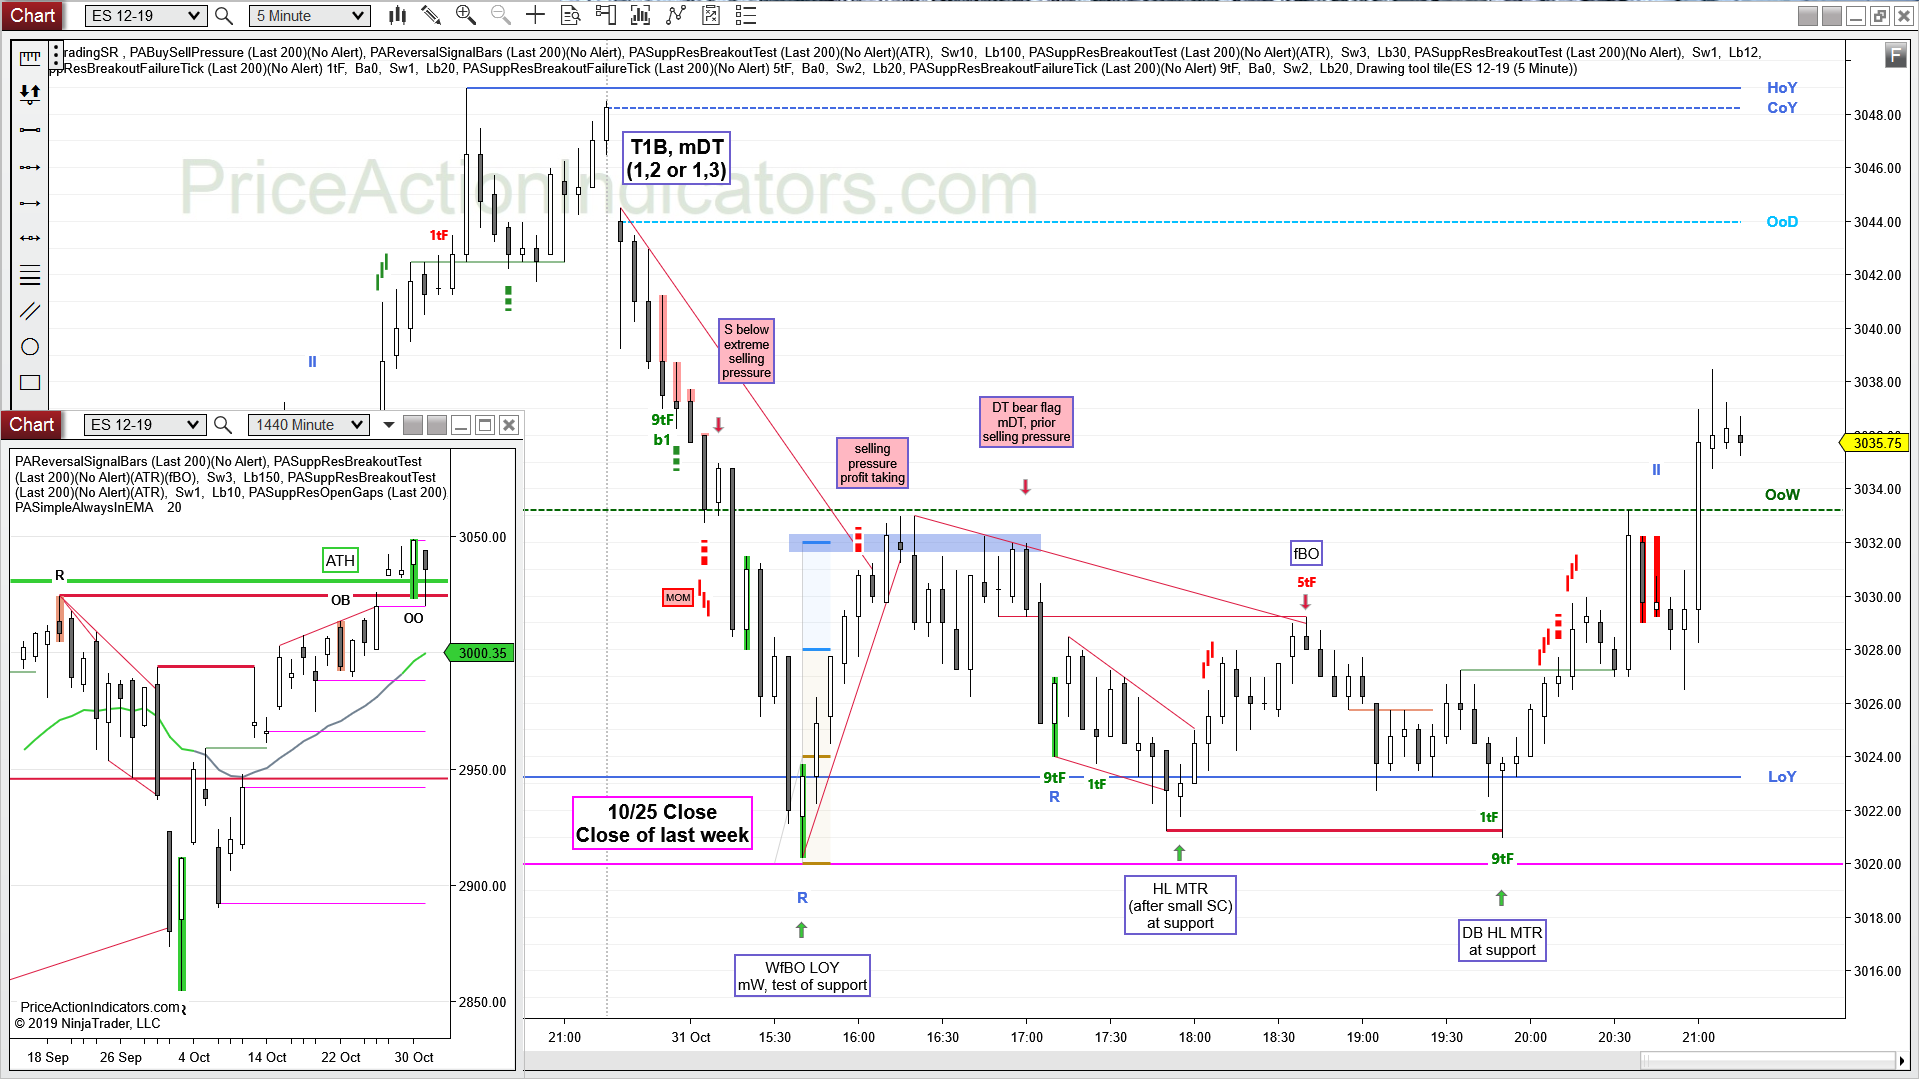
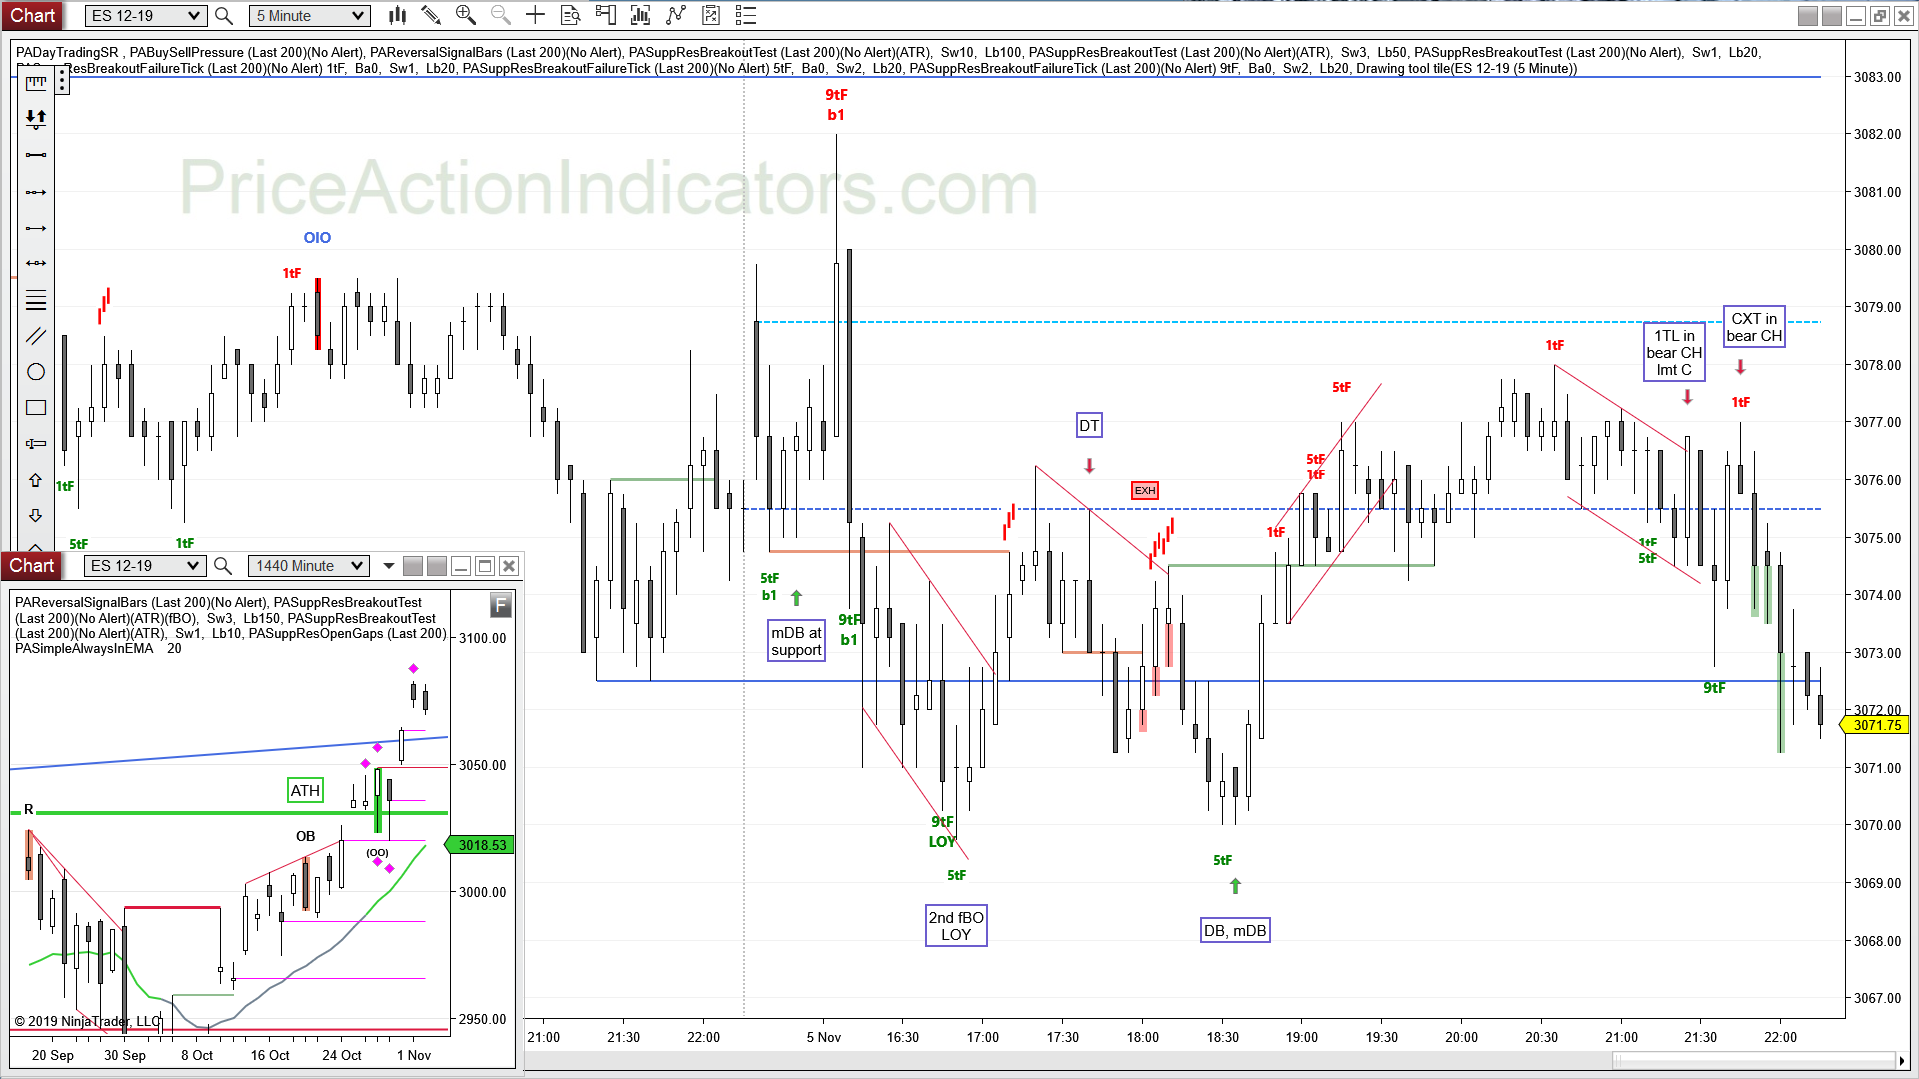
Continuation, mDB, SC, fBO, DT, DB, bear CH, 1TL, CXT
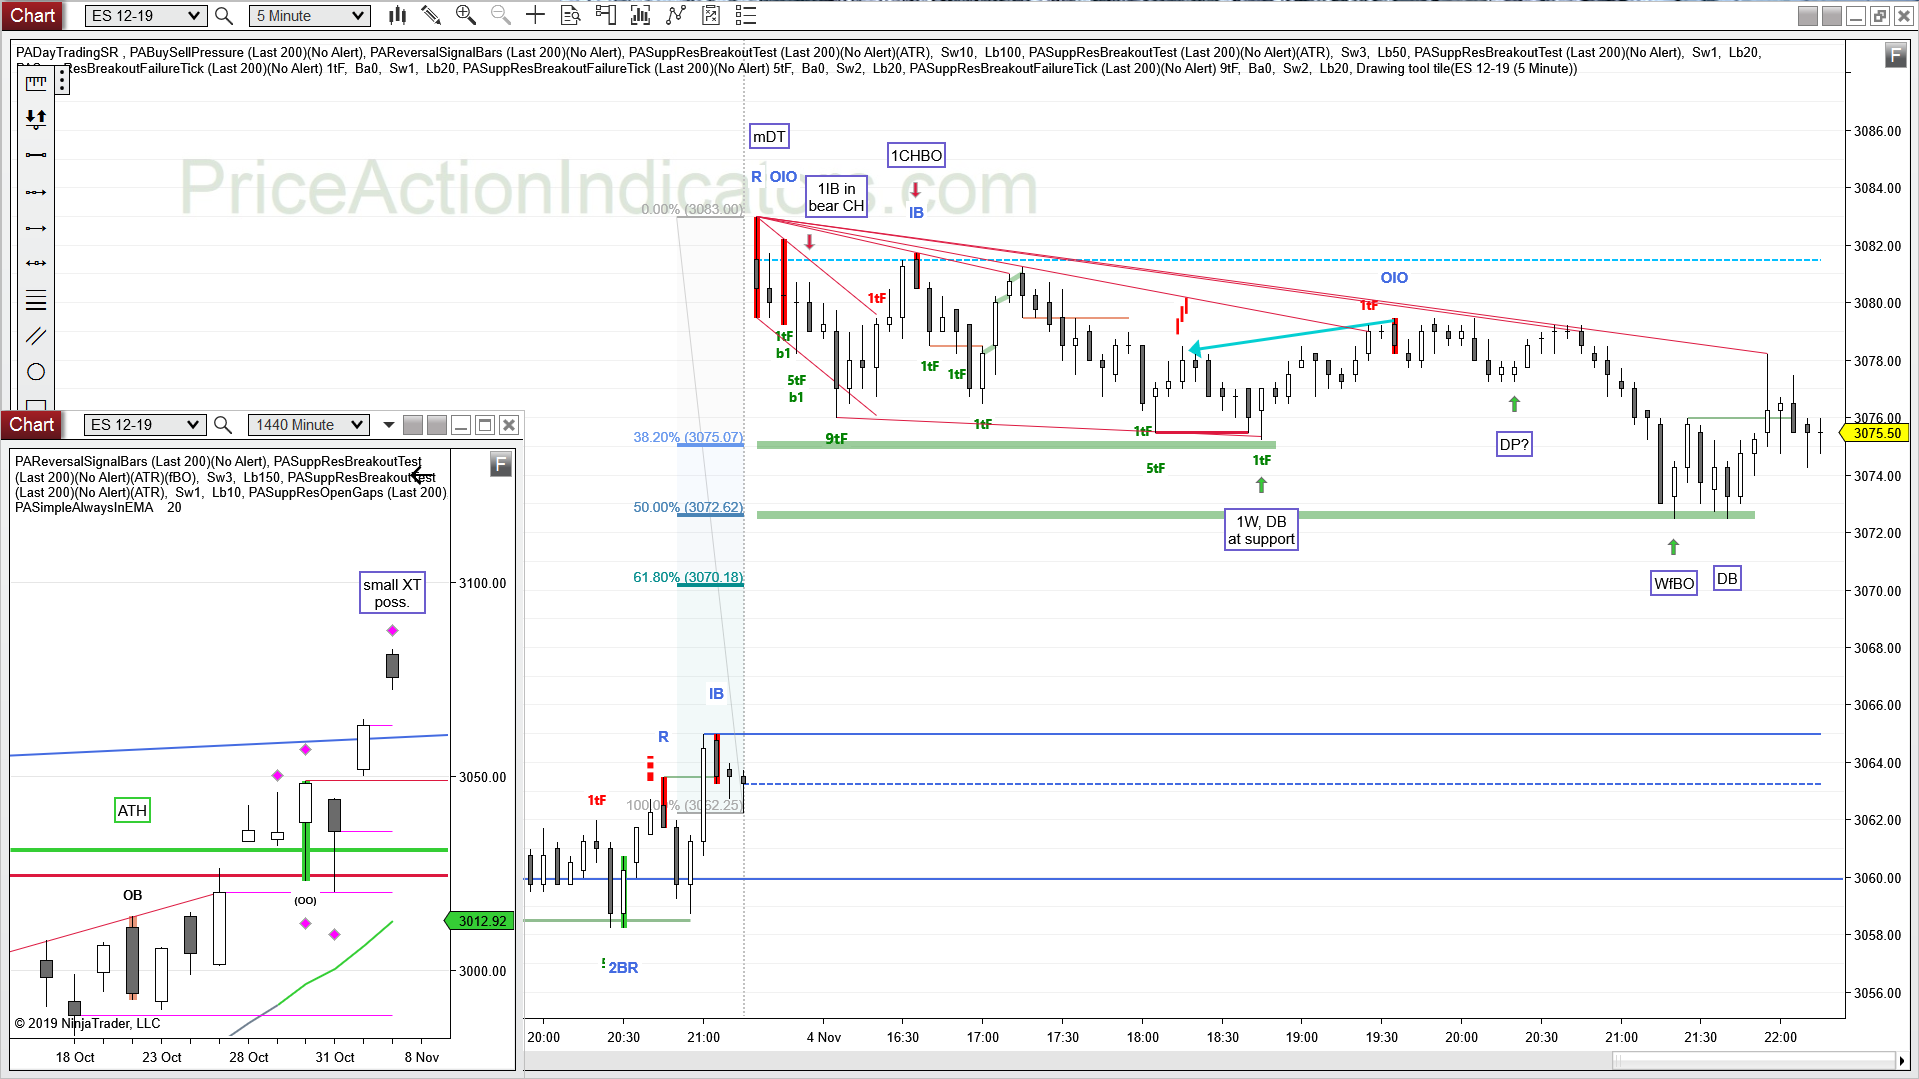
Two 5 tick Failure Breakouts at the double bottom at the LOD.
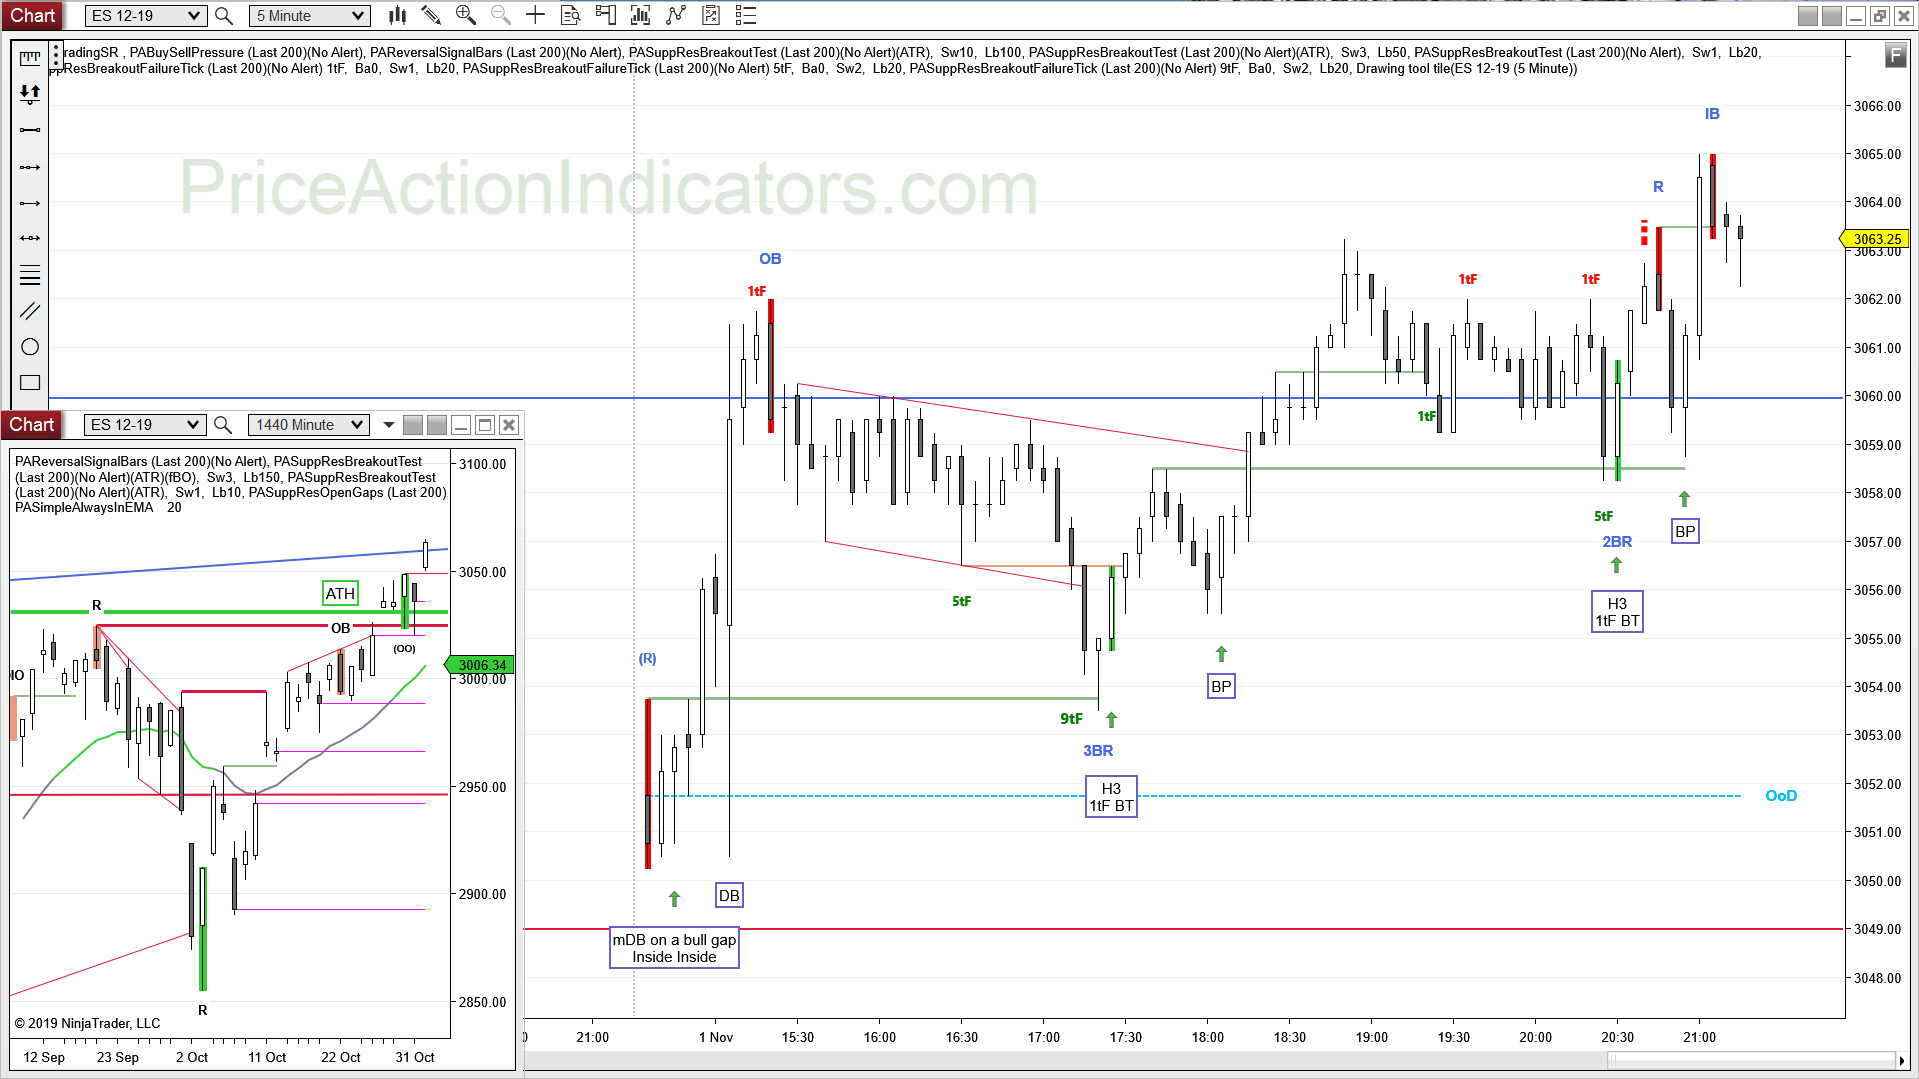
E-mini S&P 500 Future 5 min chart (trend lines, arrows and boxed text drawn by hand)
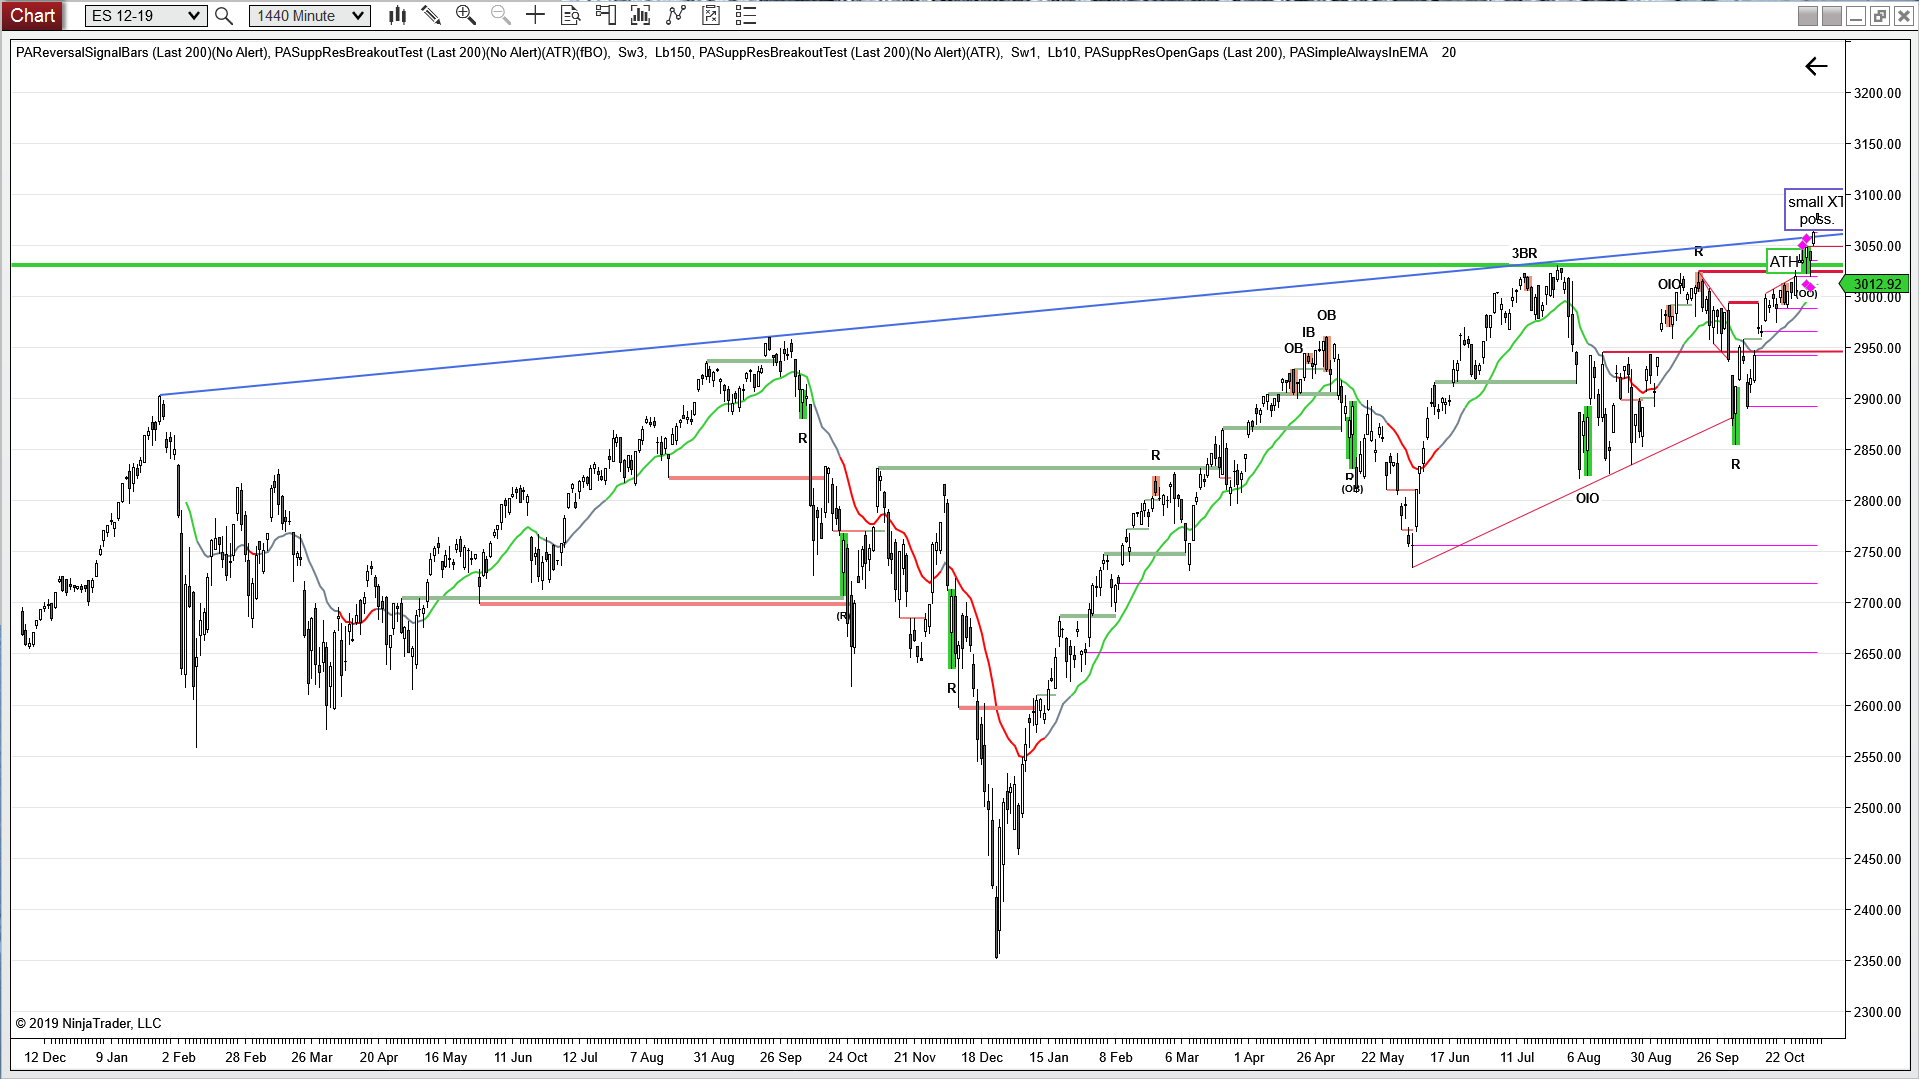
daily chart
Always In Long (AIL) since 10/10
bear Entry Bar for yesterday’s Signal Bar, but small and overlapping the SB