E-mini ES 2019/05/15

Bear gap, mid range, fBO, bull CH, 1P, 2E, H3, DB
the IB just after the news event might have been some “break in pullback” of yesterday’s shallowest bull TL
that same PA also often happens on horizontal levels
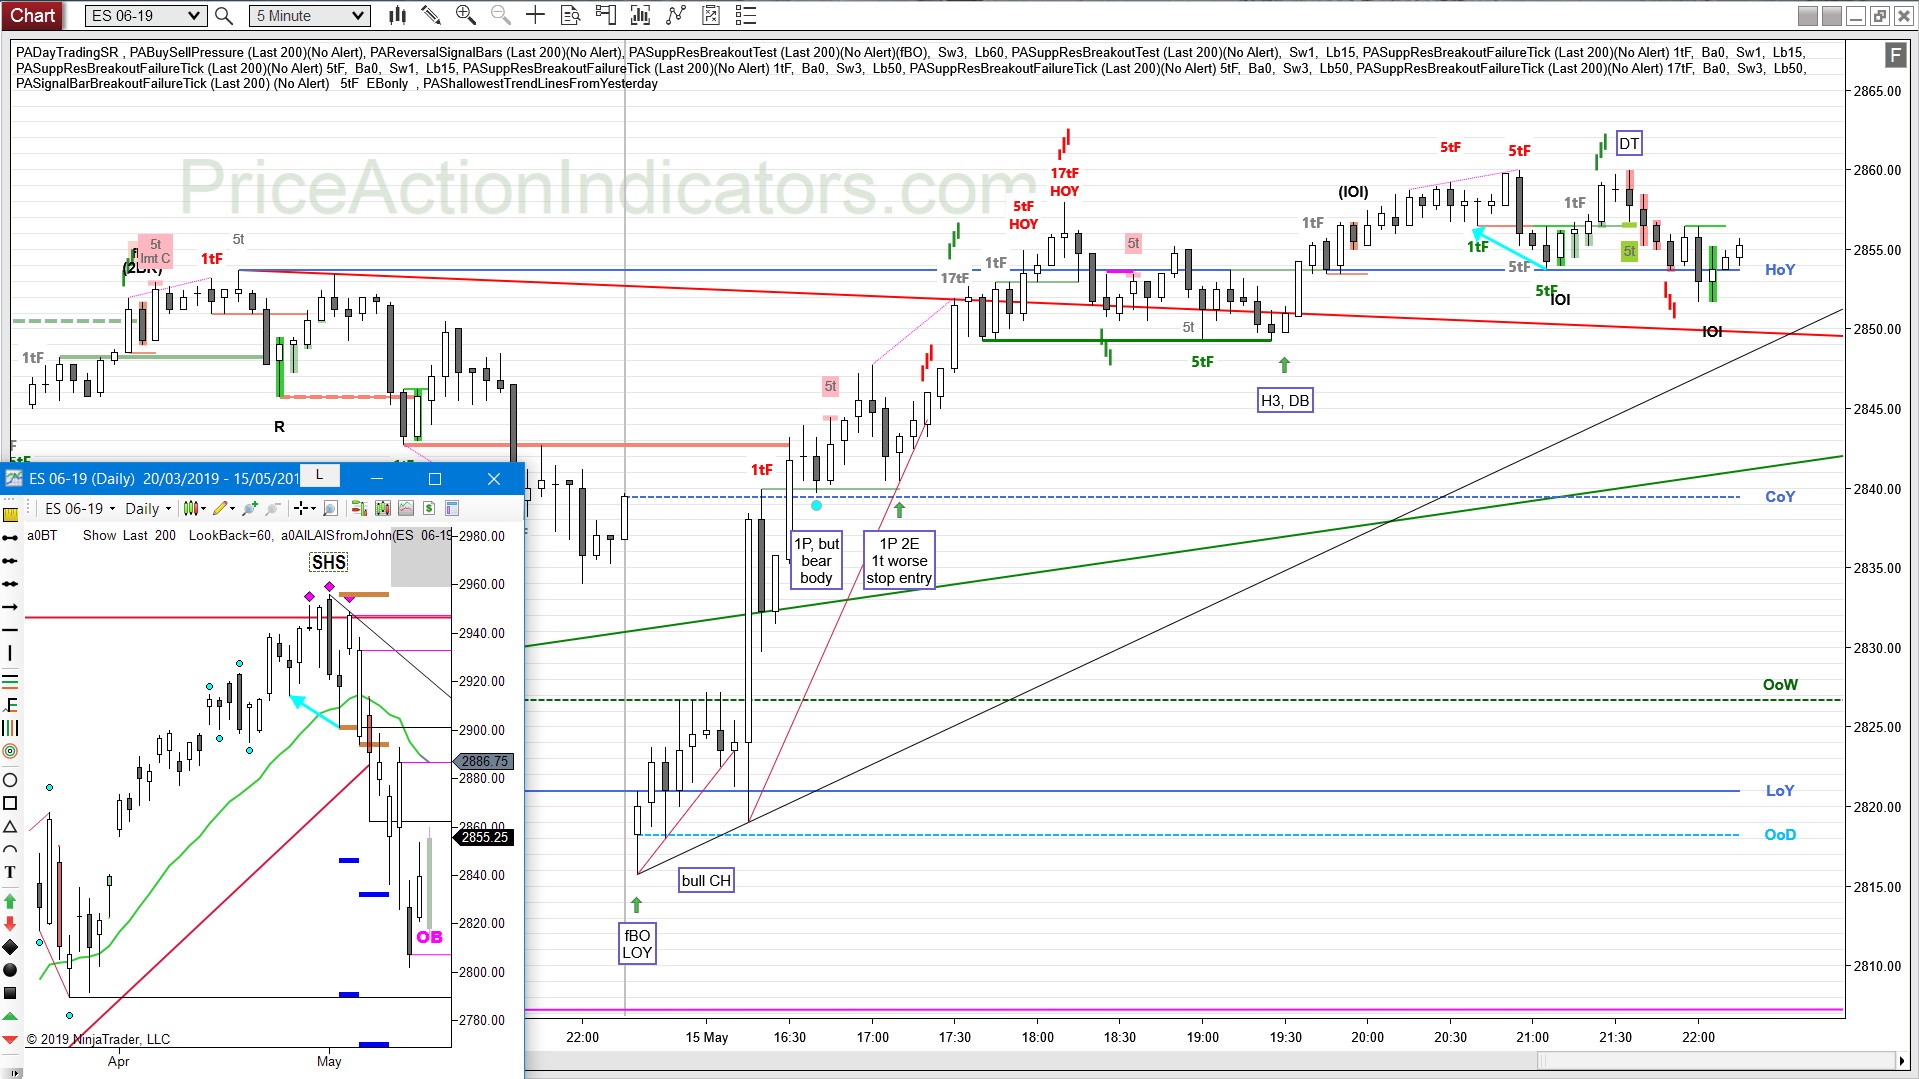
daily chart
Always In Long (AIL) since today
some news event sent us skyrocketing around 10:00am
again – aggressive bulls B that possible exhaustion/oversold scenario
outside up, probably trapping some bears

E-mini ES 2019/05/13

Bear gap, mid range, OR, 1fB1, bear CH, SC, 1IB, BP, XT, 1P, 1tF BT, DB, 3BR

The Reversal Signal Bars indicator, gave a nice RVB signal at the LOD.

daily chart
Always In Short (AIS) since 05/07
BB the 03/28 bull IB, which was a SB for a 2E in the XT at the end of March
I’d like to see what happens below 2790 (the low of that XT I mentioned earlier) and at the next gap close around 2750

E-mini ES 2019/05/03

Bull gap, above HOY, Opening Range, DB, mDB, BT, H2, H2, bear CH
Bull gap + DB is a classic, do not look to sell, unless the trend breaks

daily chart
Always In Long (AIL) since 03/29 – now over a month
after Y bad FT for the bears, bulls B the OOD and HOY
we closed above the old ATH (thick red line)
also on the weekly chart

E-mini ES 2019/05/02

Continuation, MC, DT, fH2, DP, BP, BT, mDT, DBH2, HL MTR

after the DB at the daily EMA we got a strong break beyond the bear TL and break of a LH, then the HL MTR, see also Reversals

The Reversal Signal Bars indicator, gave a nice RVB for the HL MTR. The Buy Sell Pressure indicator also gave a couple of nice Exhaustion signals, as well as a Momentum signal after the break of LOY.

daily chart
Always In Long (AIL) since 03/29 – now over a month
bulls defended the last prominent HL (04/25) – a close below would have switched to AIS
bear shorted the COY and took profits at 2xMM of their actual risk (the number of points measured, that a trade went negative)