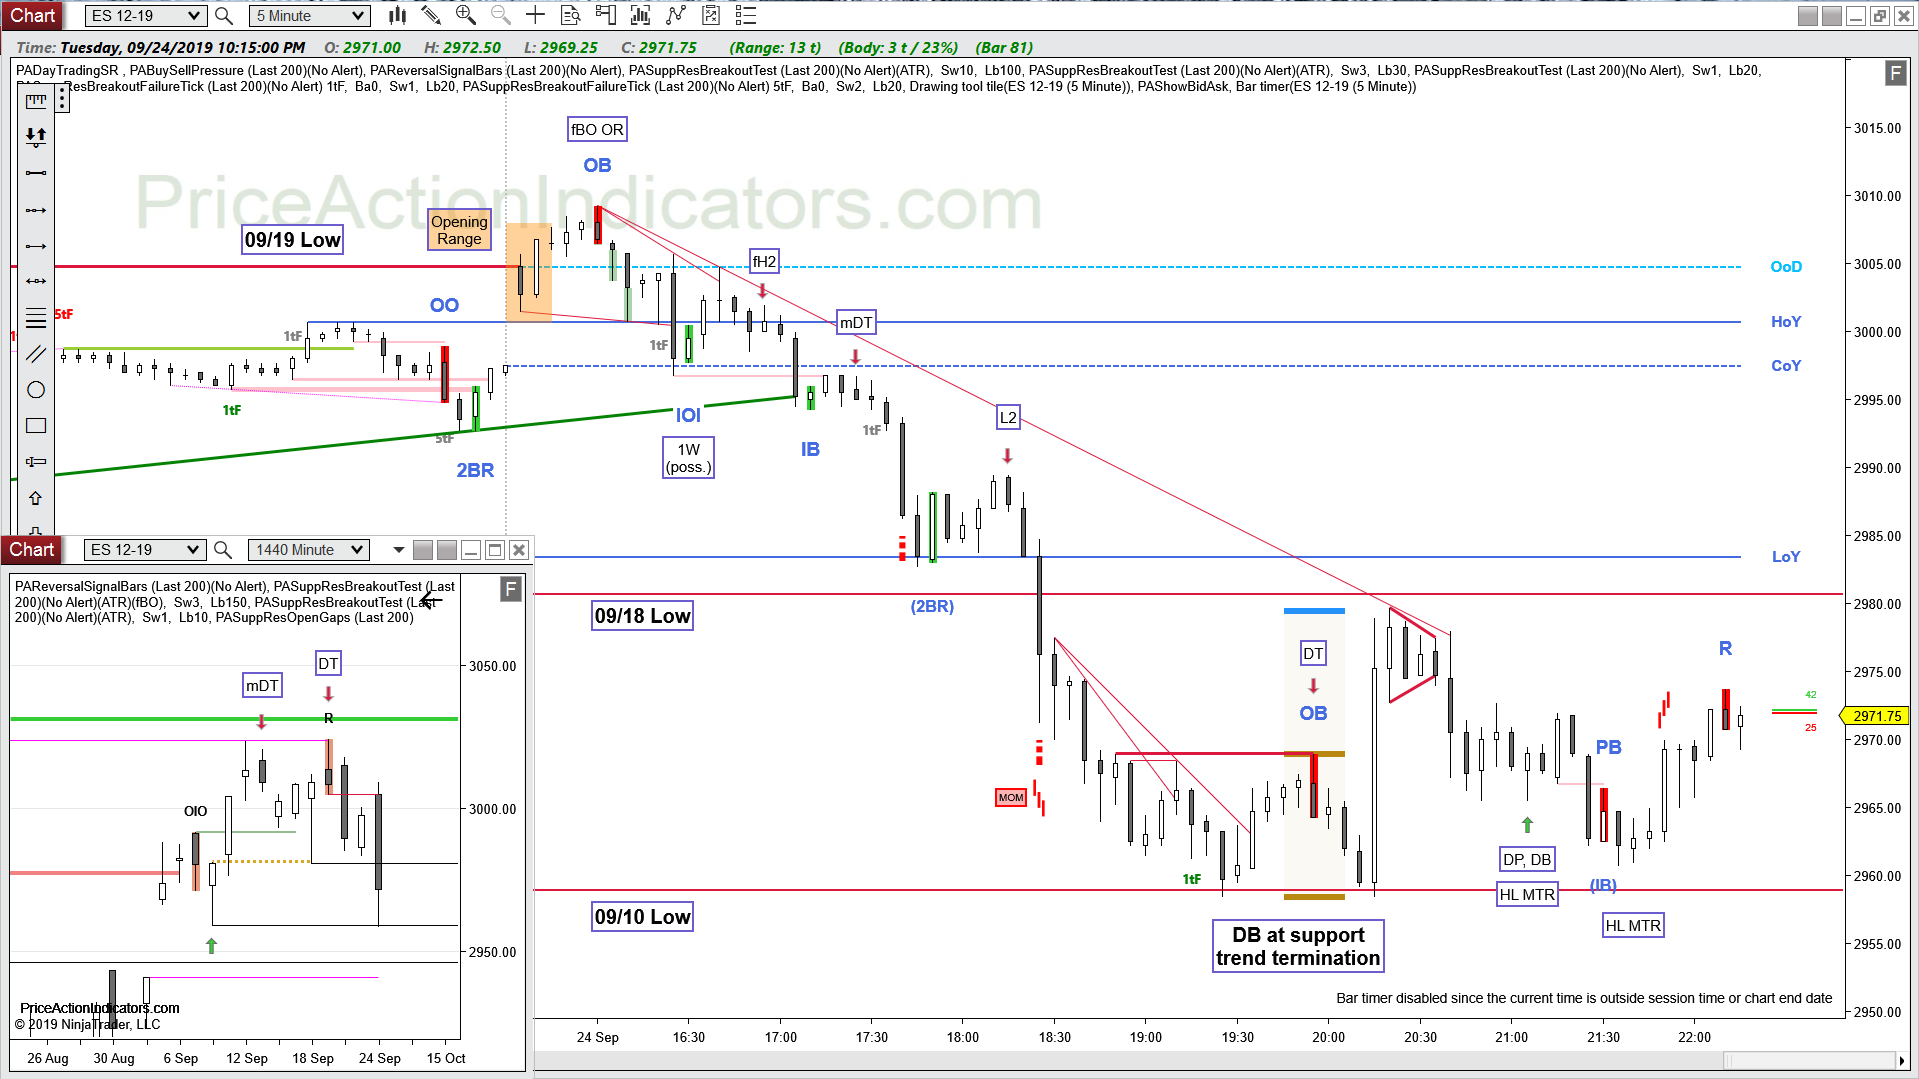
Continuation, fBO, T1B, fH2, L2, DB, DT, SC
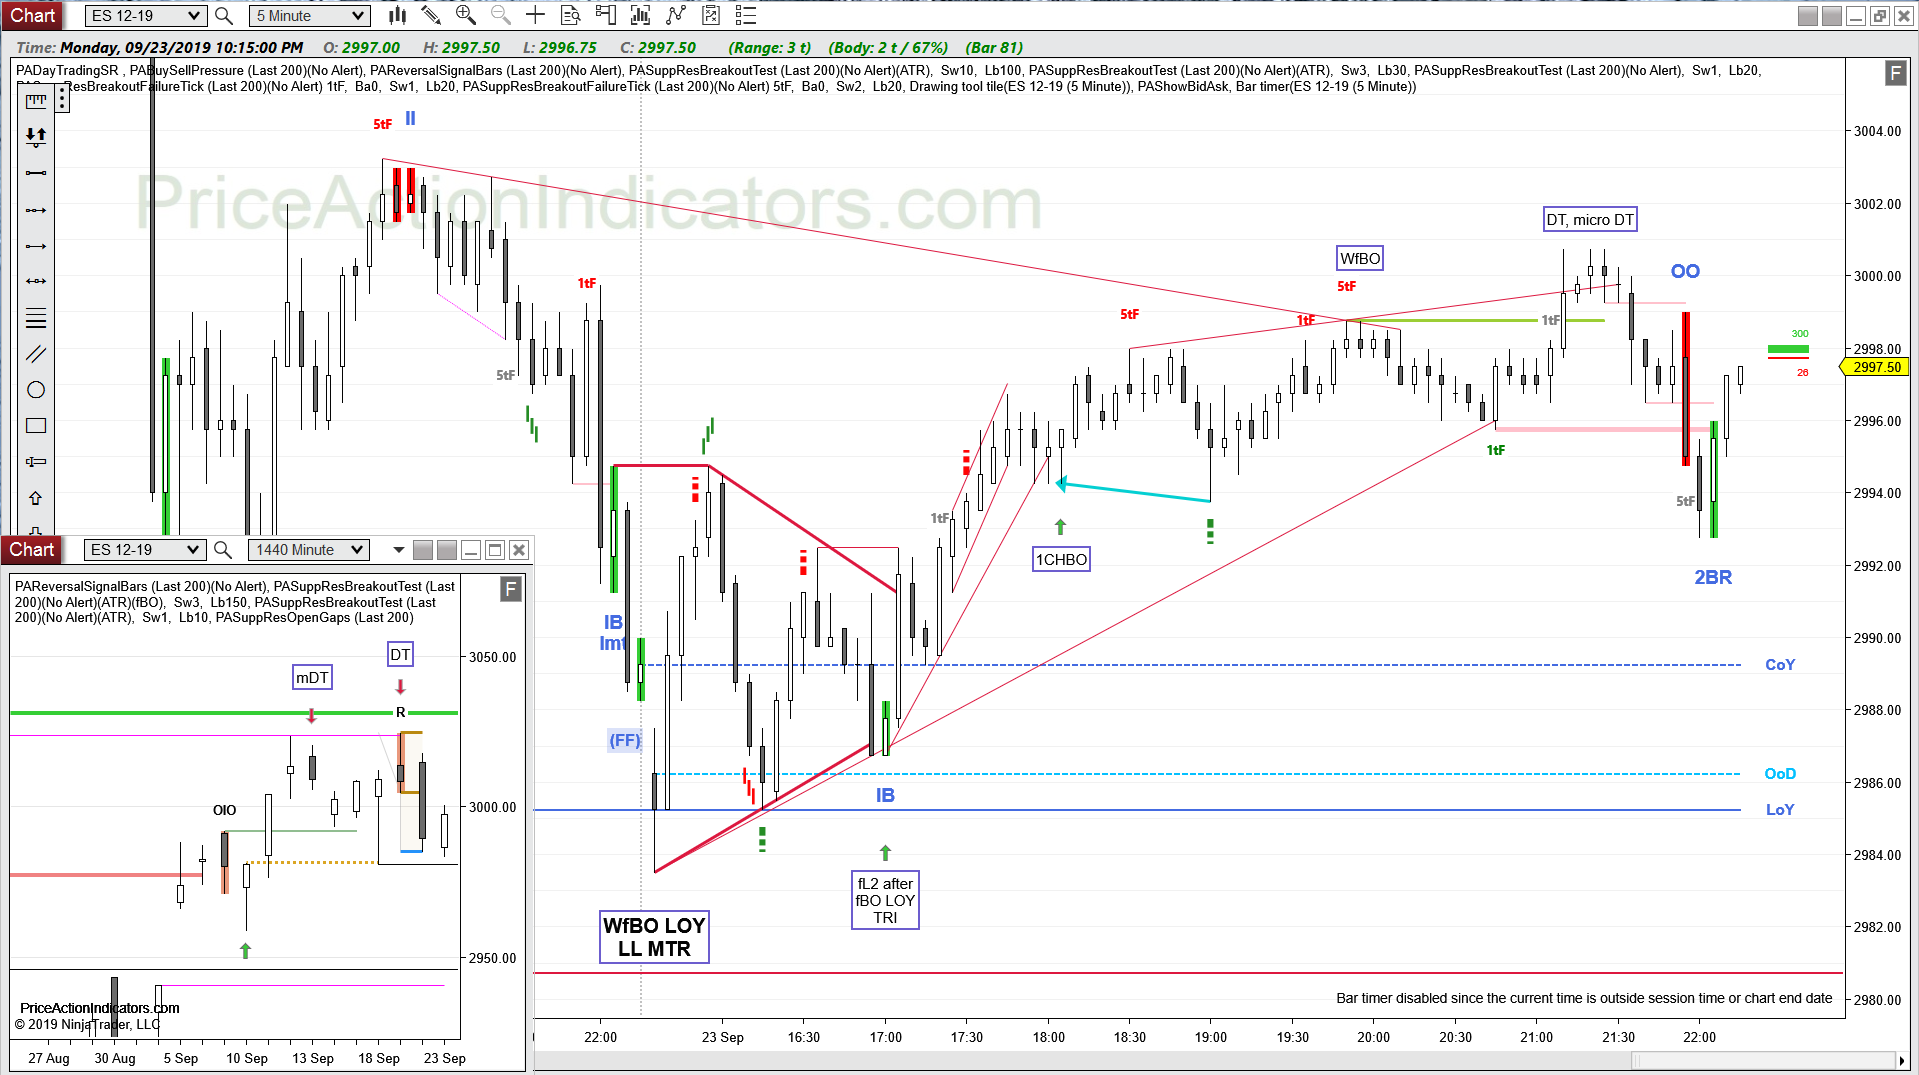
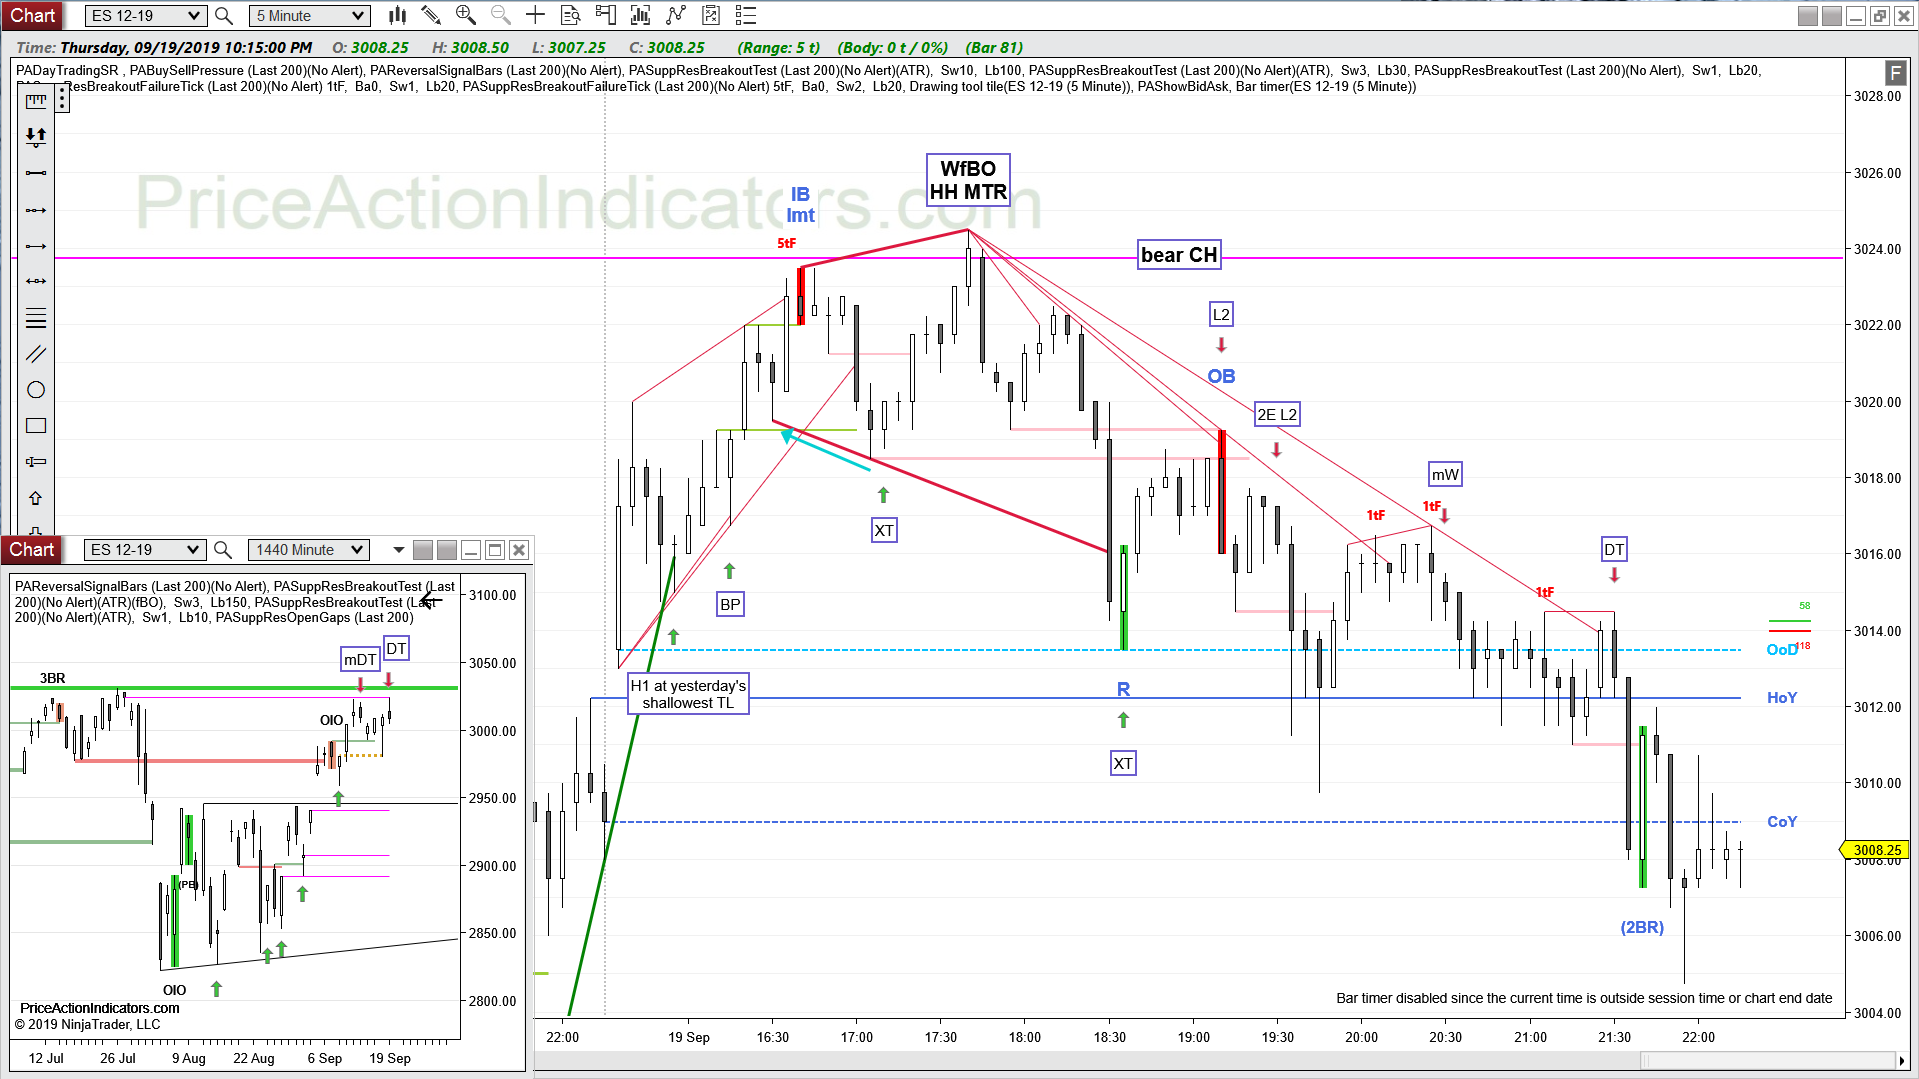
E-mini S&P 500 Future 5 min chart (all arrows/entries drawn by hand)

daily chart
Always In Short (AIS) since 09/24
Bear BO bar, but OB, might get BB (alternating bull/bear bars the last couple of days)
we closed back into the August Trading Range
closed two open gaps (magenta lines)