Bull gap, mid range, fBO HOY, fH2, 1P, WfBO, H&S bottom, fL2, mW, BT

daily chart
Always In Long
Buyers below yesterday’s bear signal bar, a bear trap

for NinjaTrader® – Forget Squiggly Lines!
Bull gap, mid range, fBO HOY, fH2, 1P, WfBO, H&S bottom, fL2, mW, BT
daily chart
Always In Long
Buyers below yesterday’s bear signal bar, a bear trap
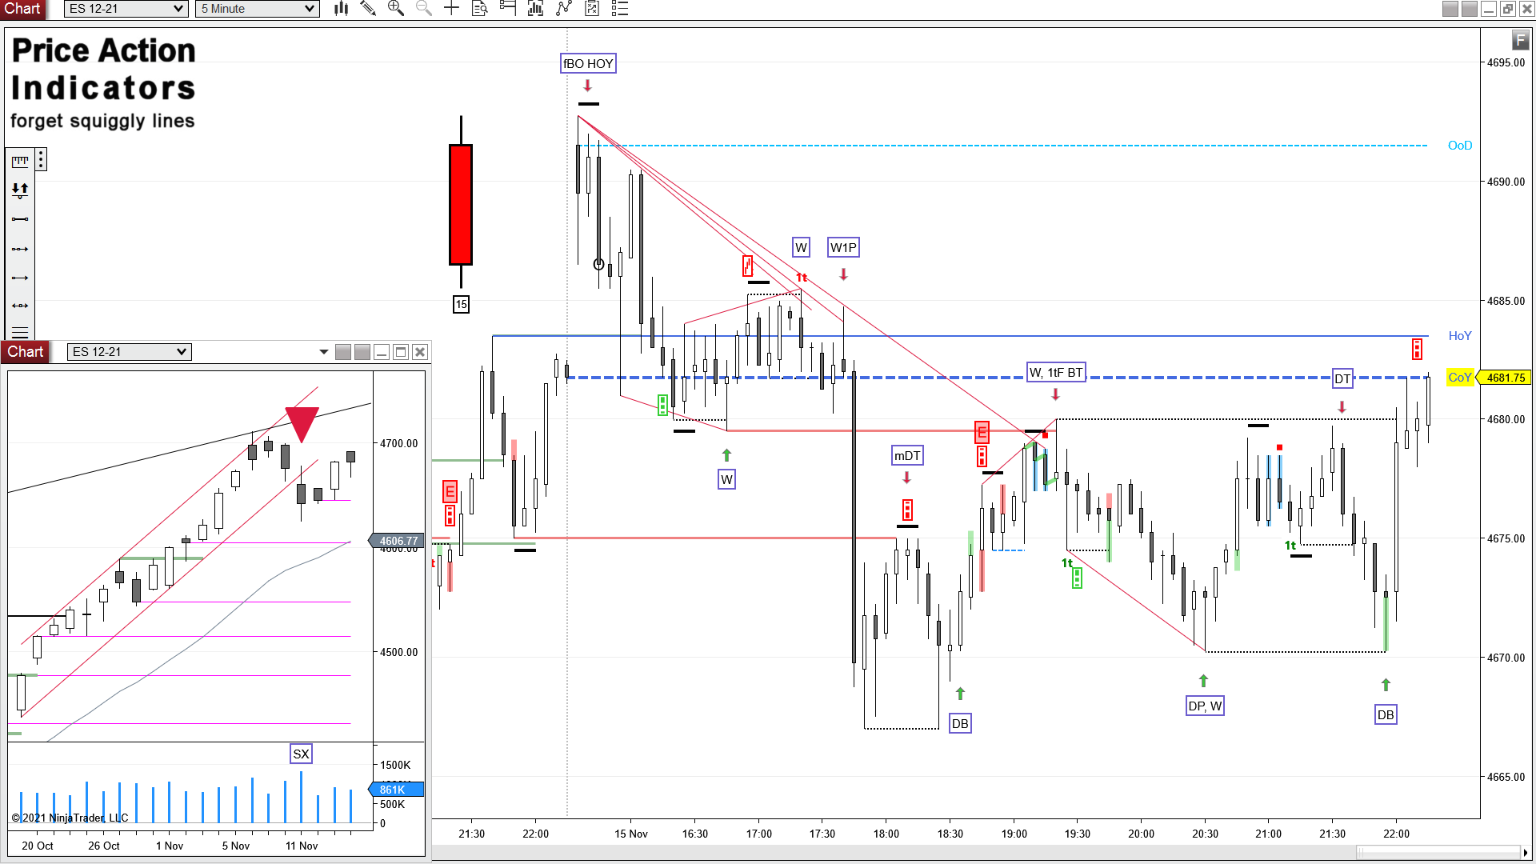
Bull gap, mid range, fBO HOY, W, W1P, DB, 1tF BT, DP, DT
daily chart
Always In Short
Breakout Pullback
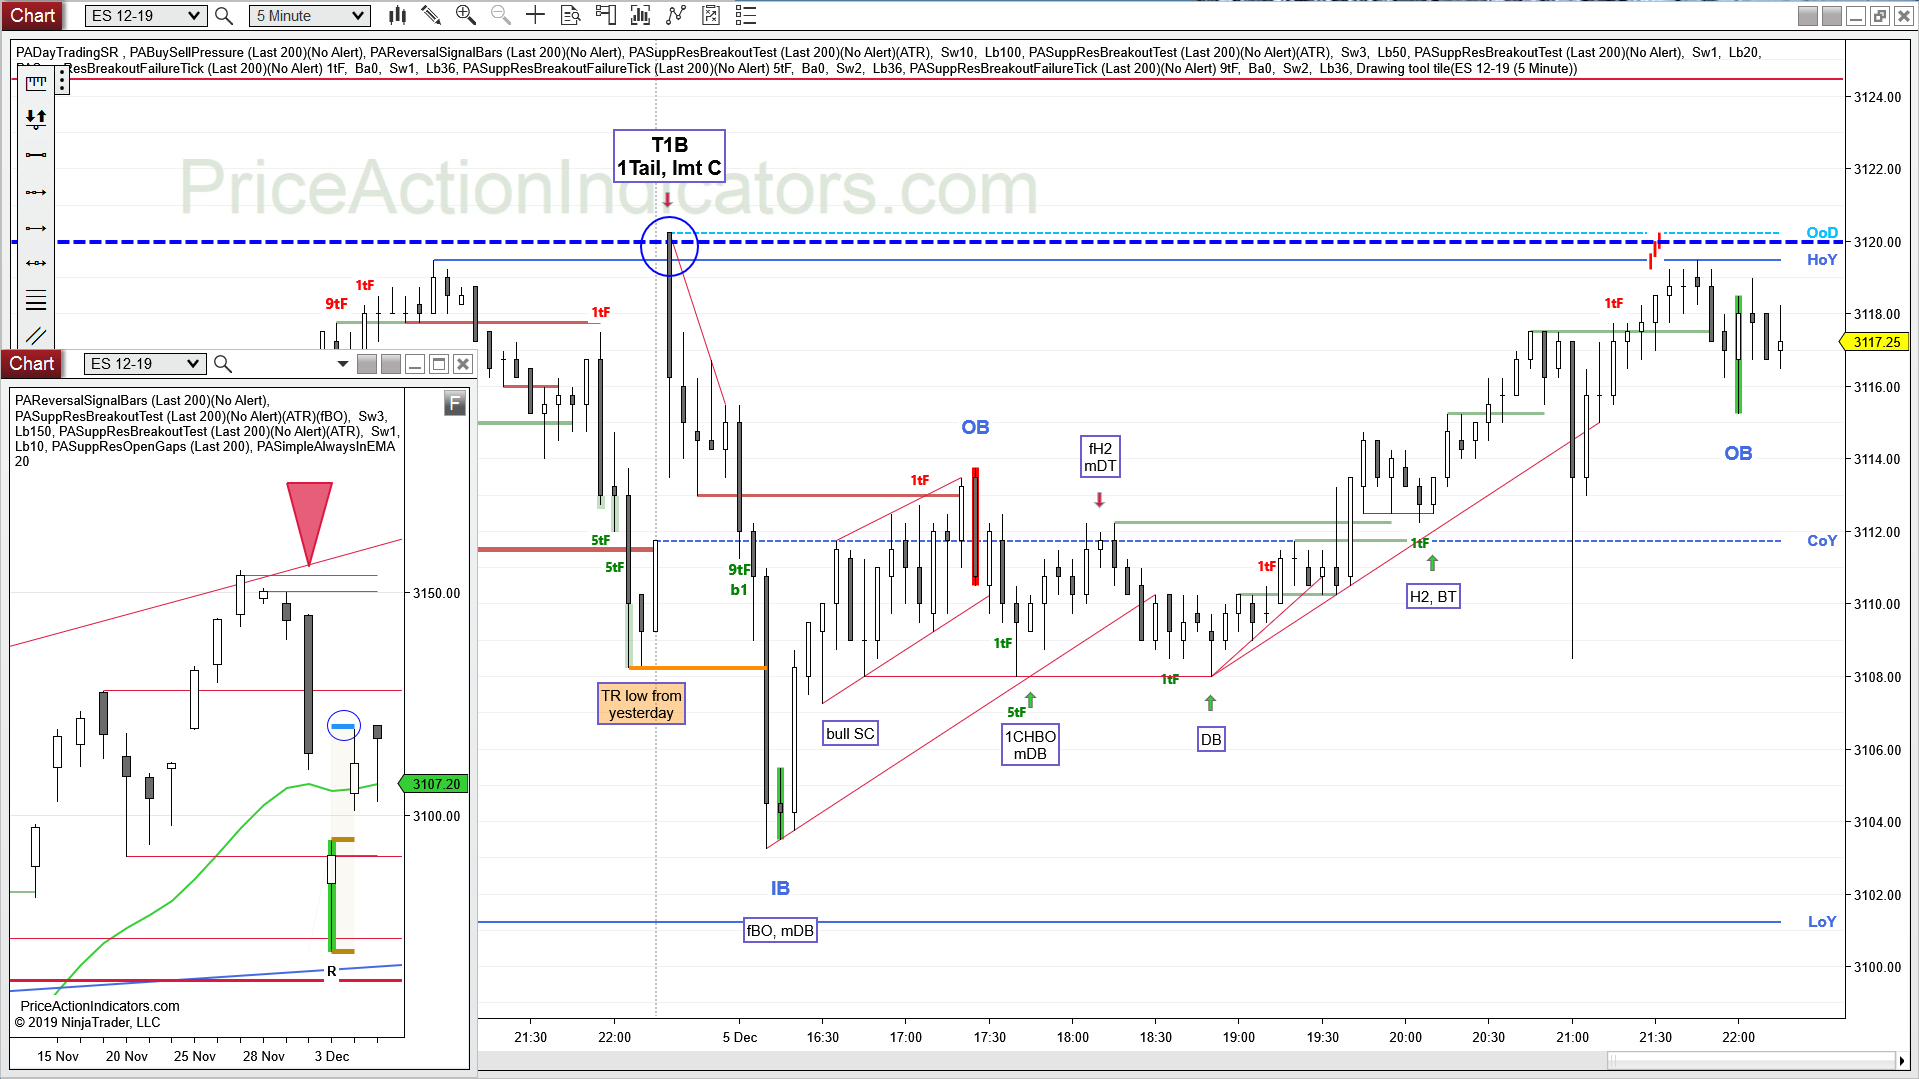
Continuation, fBO HOY, T1B, 1Tail, mDB, SC, 1CHBO, fH2, mDT, DB, H2, BT
Trading Range day, almost an Inside Bar on the daily chart
E-mini S&P 500 Future 5 min chart (trend lines, arrows and boxed text drawn by hand)
from yesterday – “weak EB for yesterday’s bull RVB”
some disappointed bulls PT above yesterdays EB
also IR / reward = 1 for Tuesday’s RVB was just above HOY (blue circle)
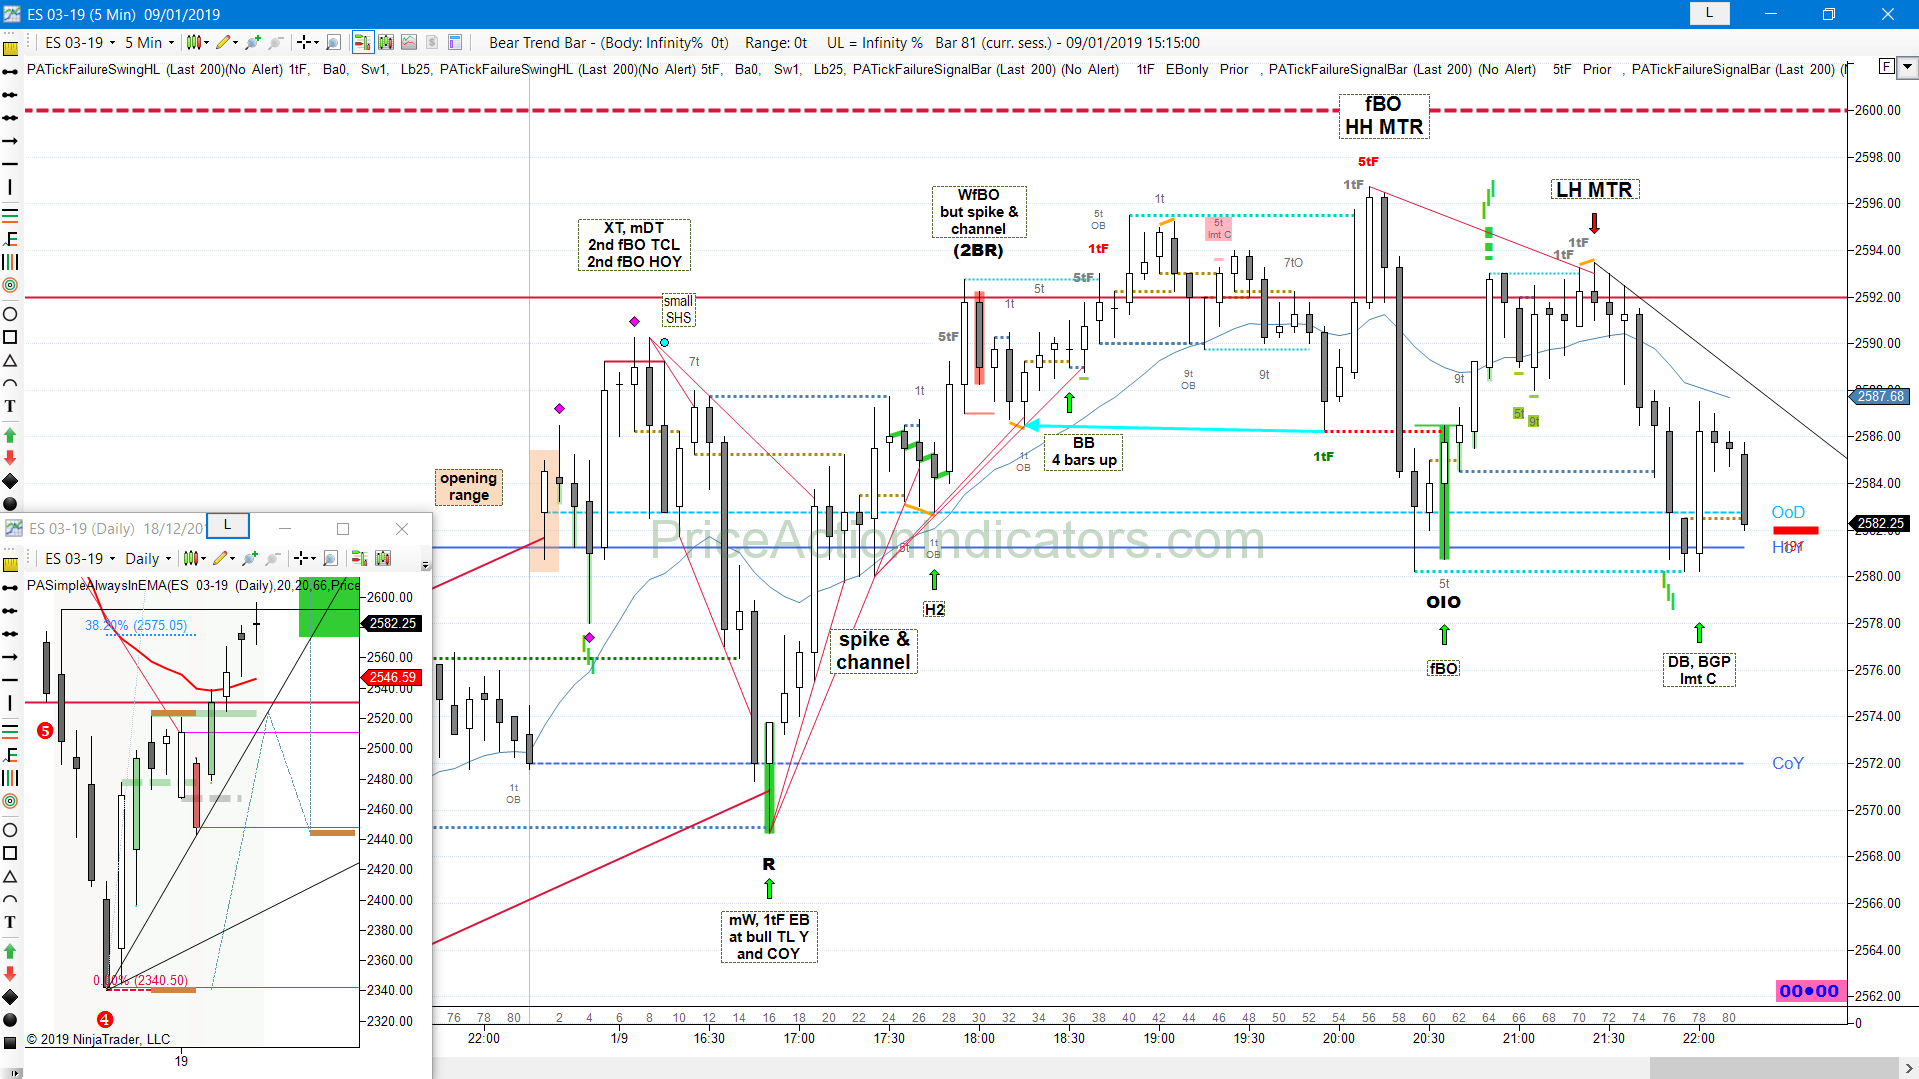
Bull gap, mid range, misplaced RVB, OR, XT, mDT, fBO HOY, SHS, mW, 1tF EB, SC, H2, BB, HH MTR, fBO, LH MTR, DB
FOMC report
daily chart
Always In Long (AIL) since 01/04
Sellers at the 12/19 lower high
bulls managed to close above HOY, not above the open though
forming a bear RVB
we met the target, I mentioned a couple of days ago
Continuation, fBO HOY, SC, 1P, BP, BT, fH2, L2, 1CHBO, 1tF BT
spike & channel, DO NOT buy possible reversals above bars or a HL, they will all eventually fail in a bear CH, take shorts near the CH TL or above swings
if you want to take counter trend trades B below the LOD and scale-in
to break a bear CH bulls need to take out at least TWO LHs (like they did just before the close) – and then we’re only in a TR from which you can have a BO, up OR dn

daily chart
Continue reading “E-mini ES 2018/12/07”