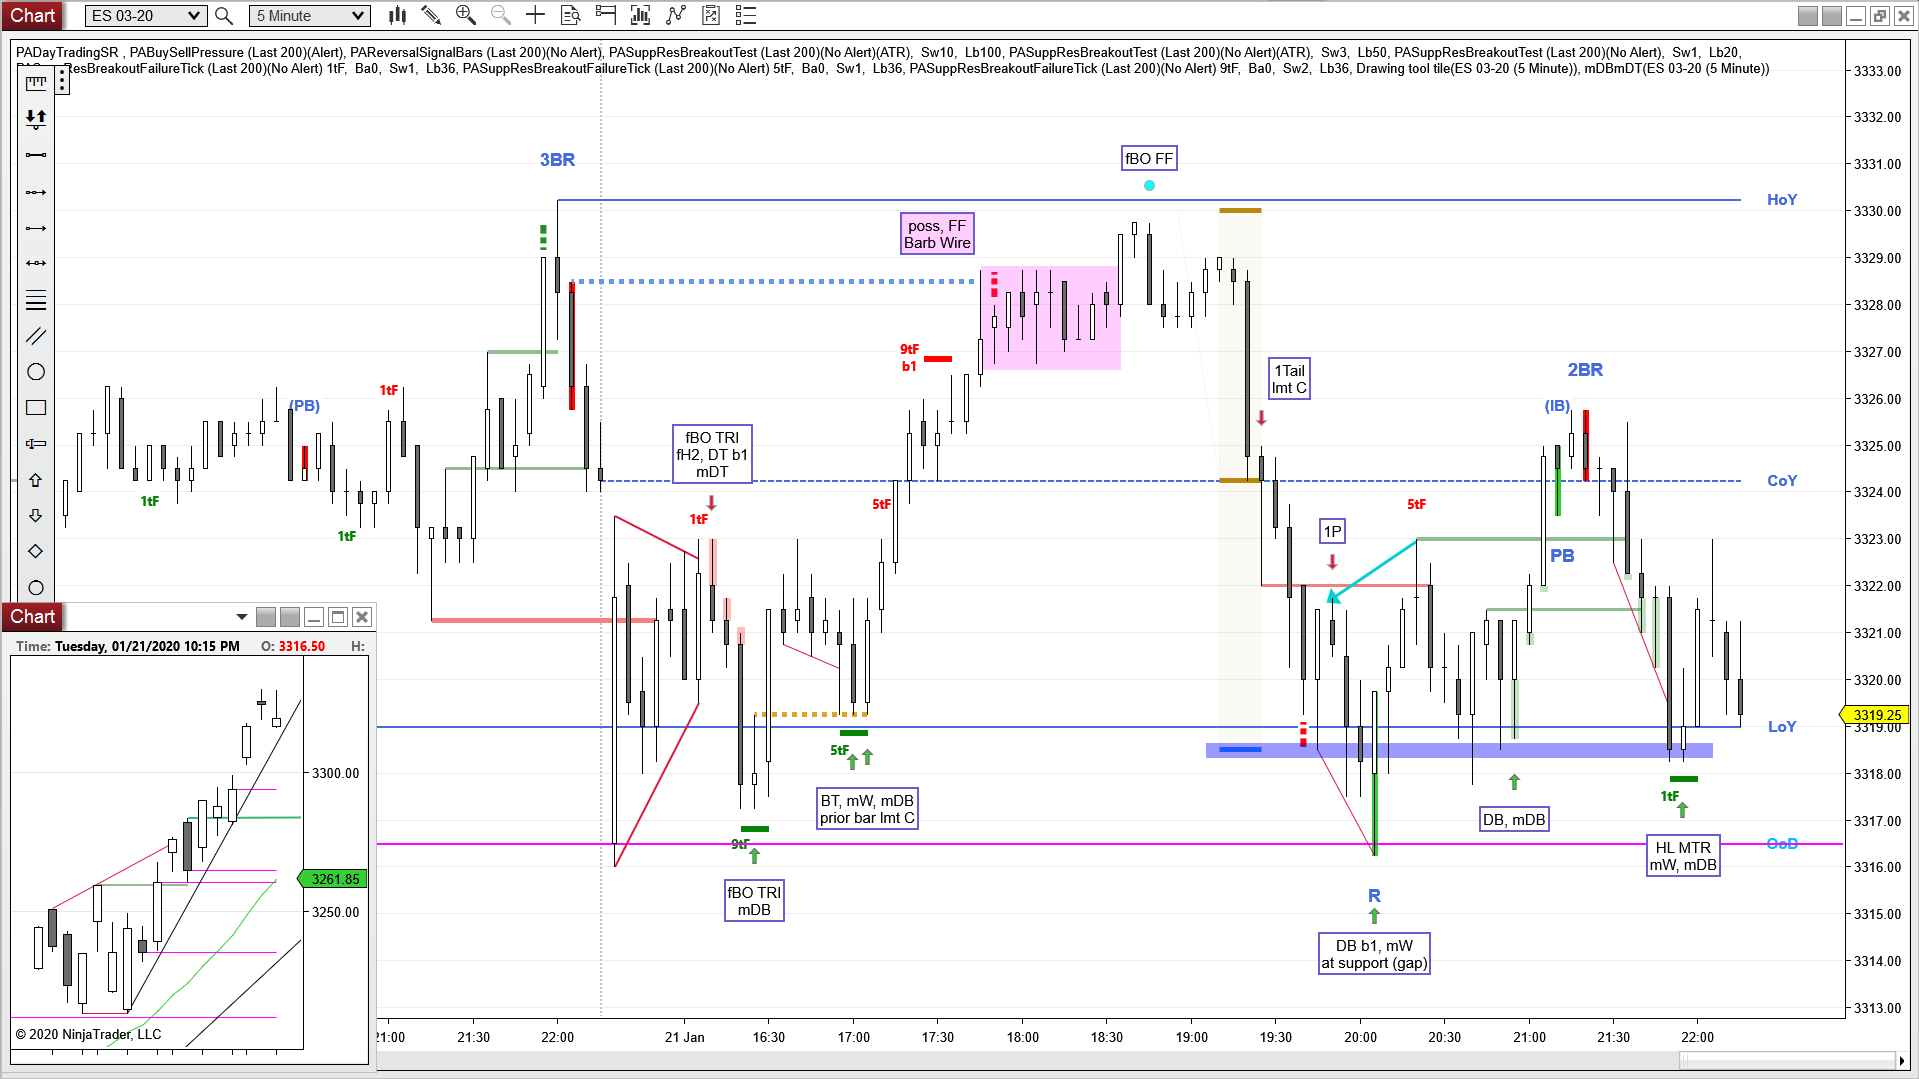
Bull gap, mid range, fBO, 1P, FF, 1tF EB, WfBO, DB
Bar 1 is a fBO HOY, but it failed because of it’s small body
a good RVB should have a body of at least 1/3rd of it’s range, this one had less than 1/4th
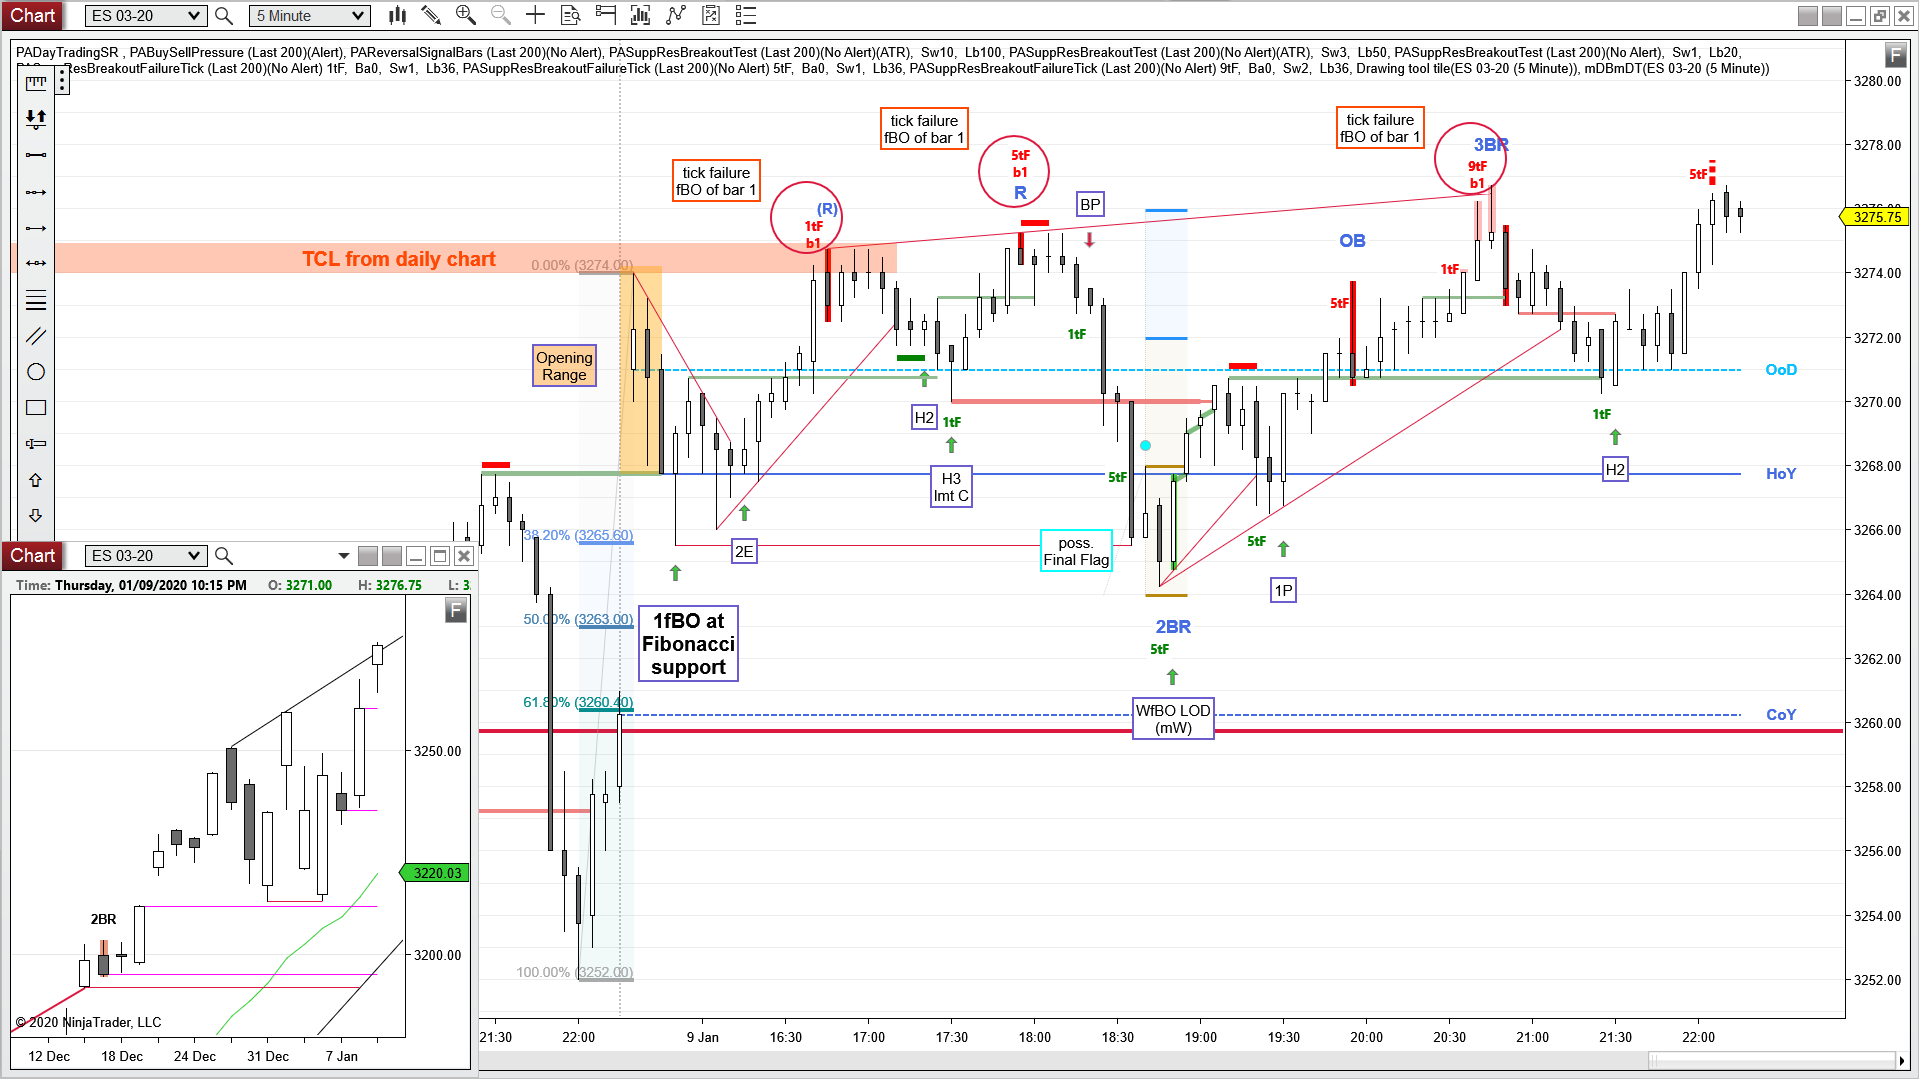
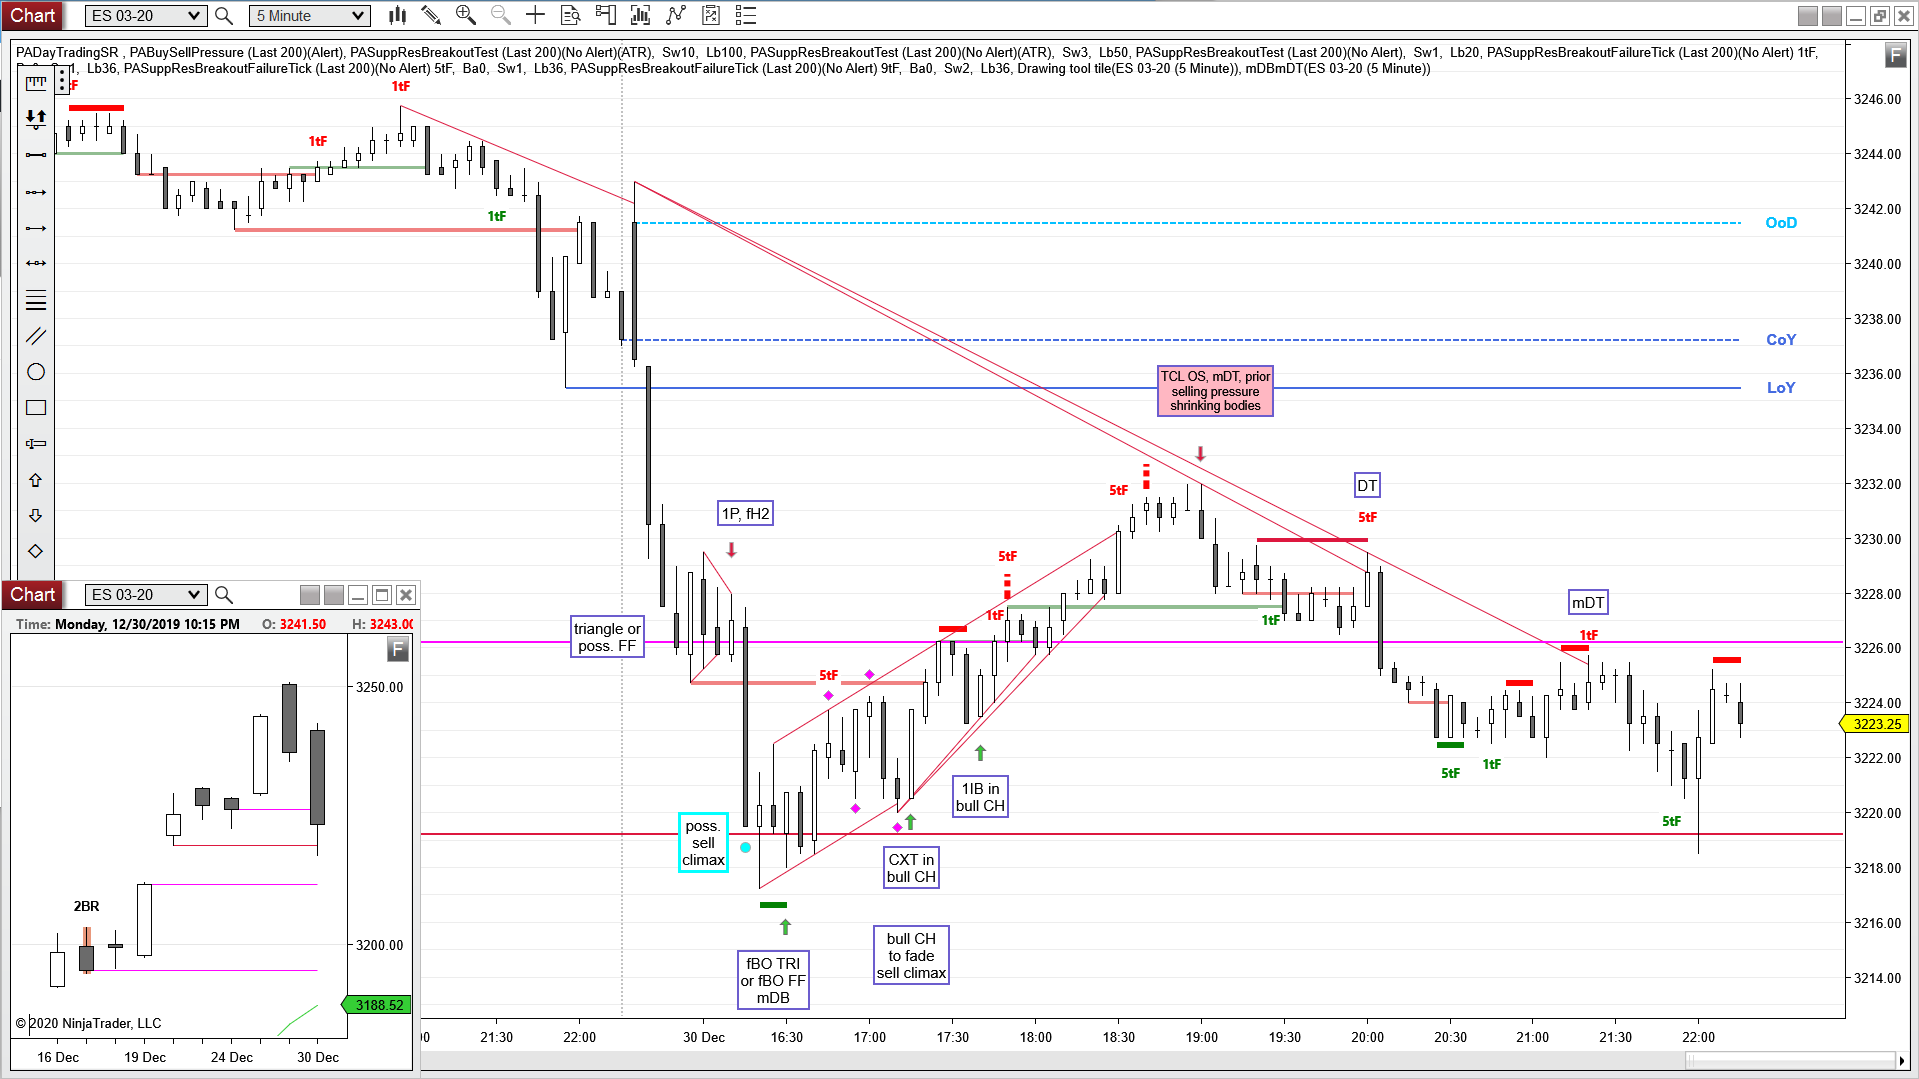
E-mini S&P 500 Future 5 min chart (trend lines, arrows and boxed text drawn by hand)
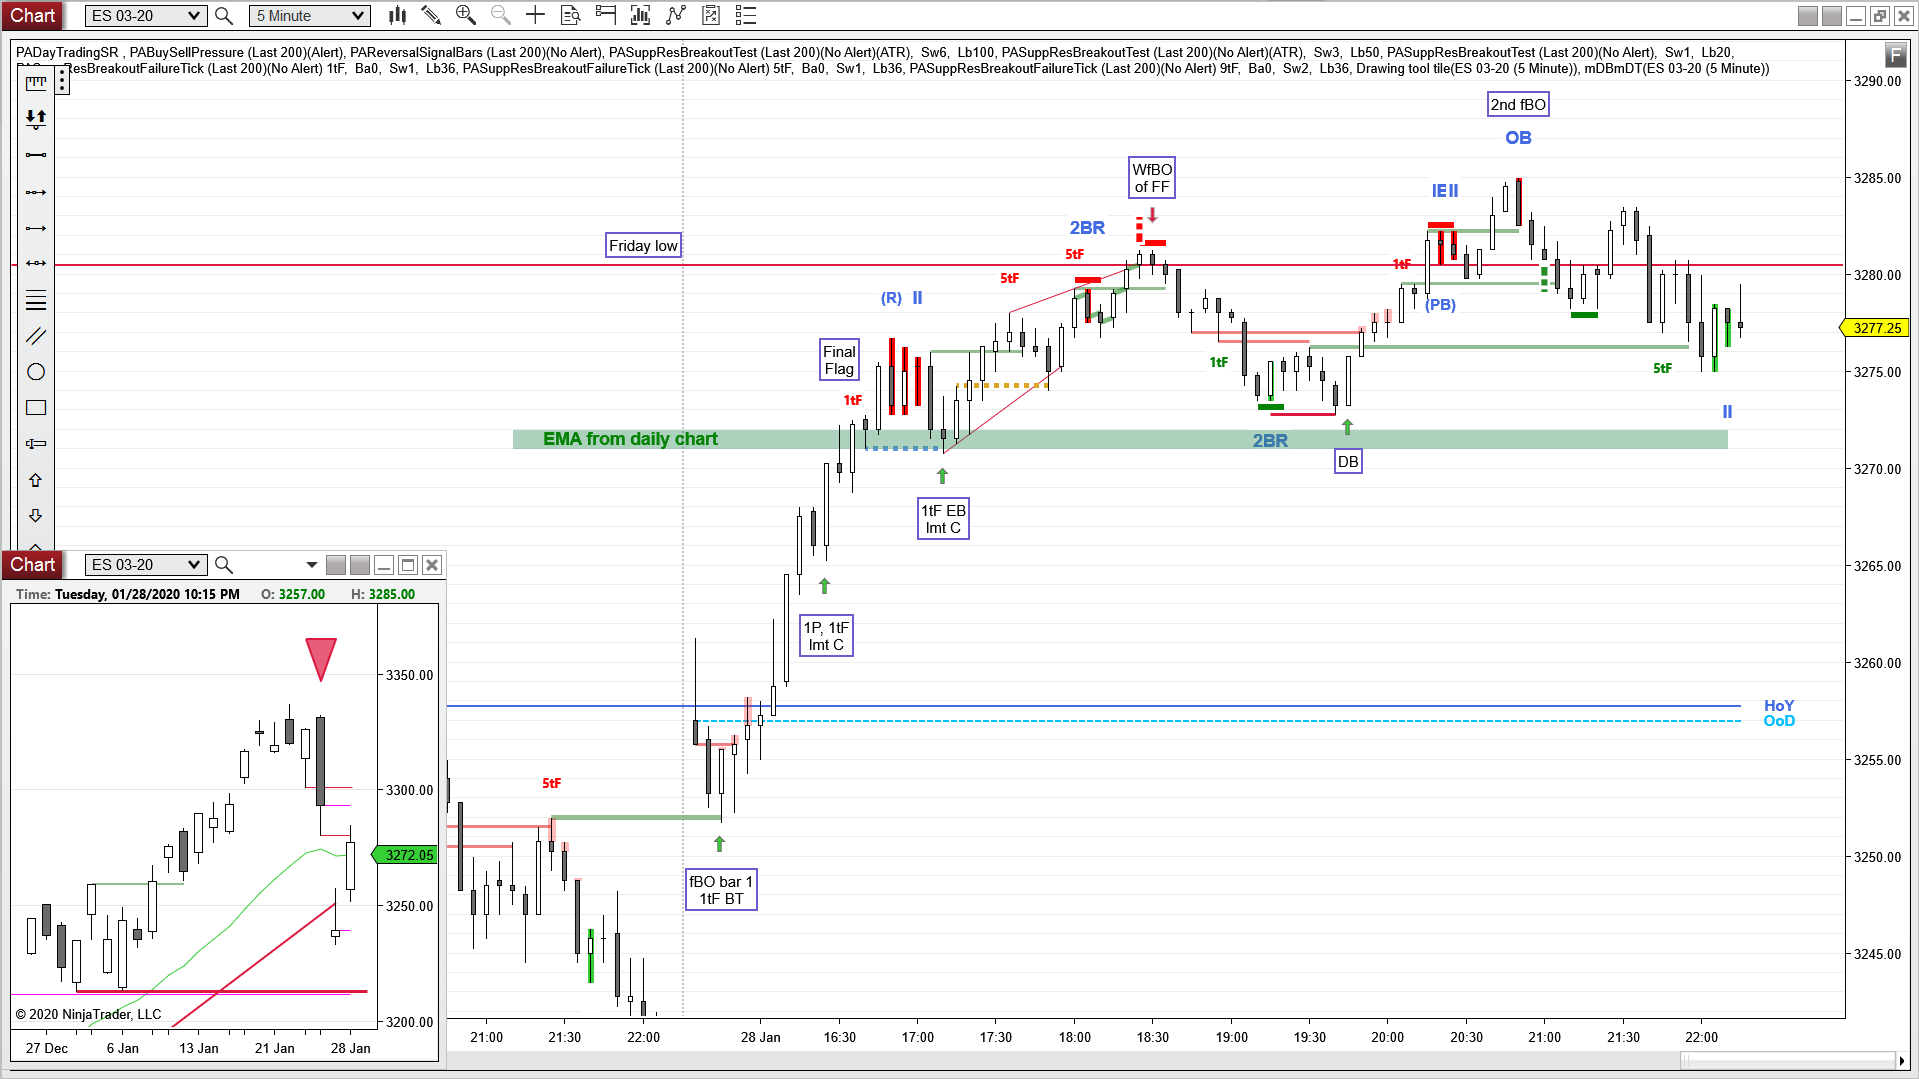
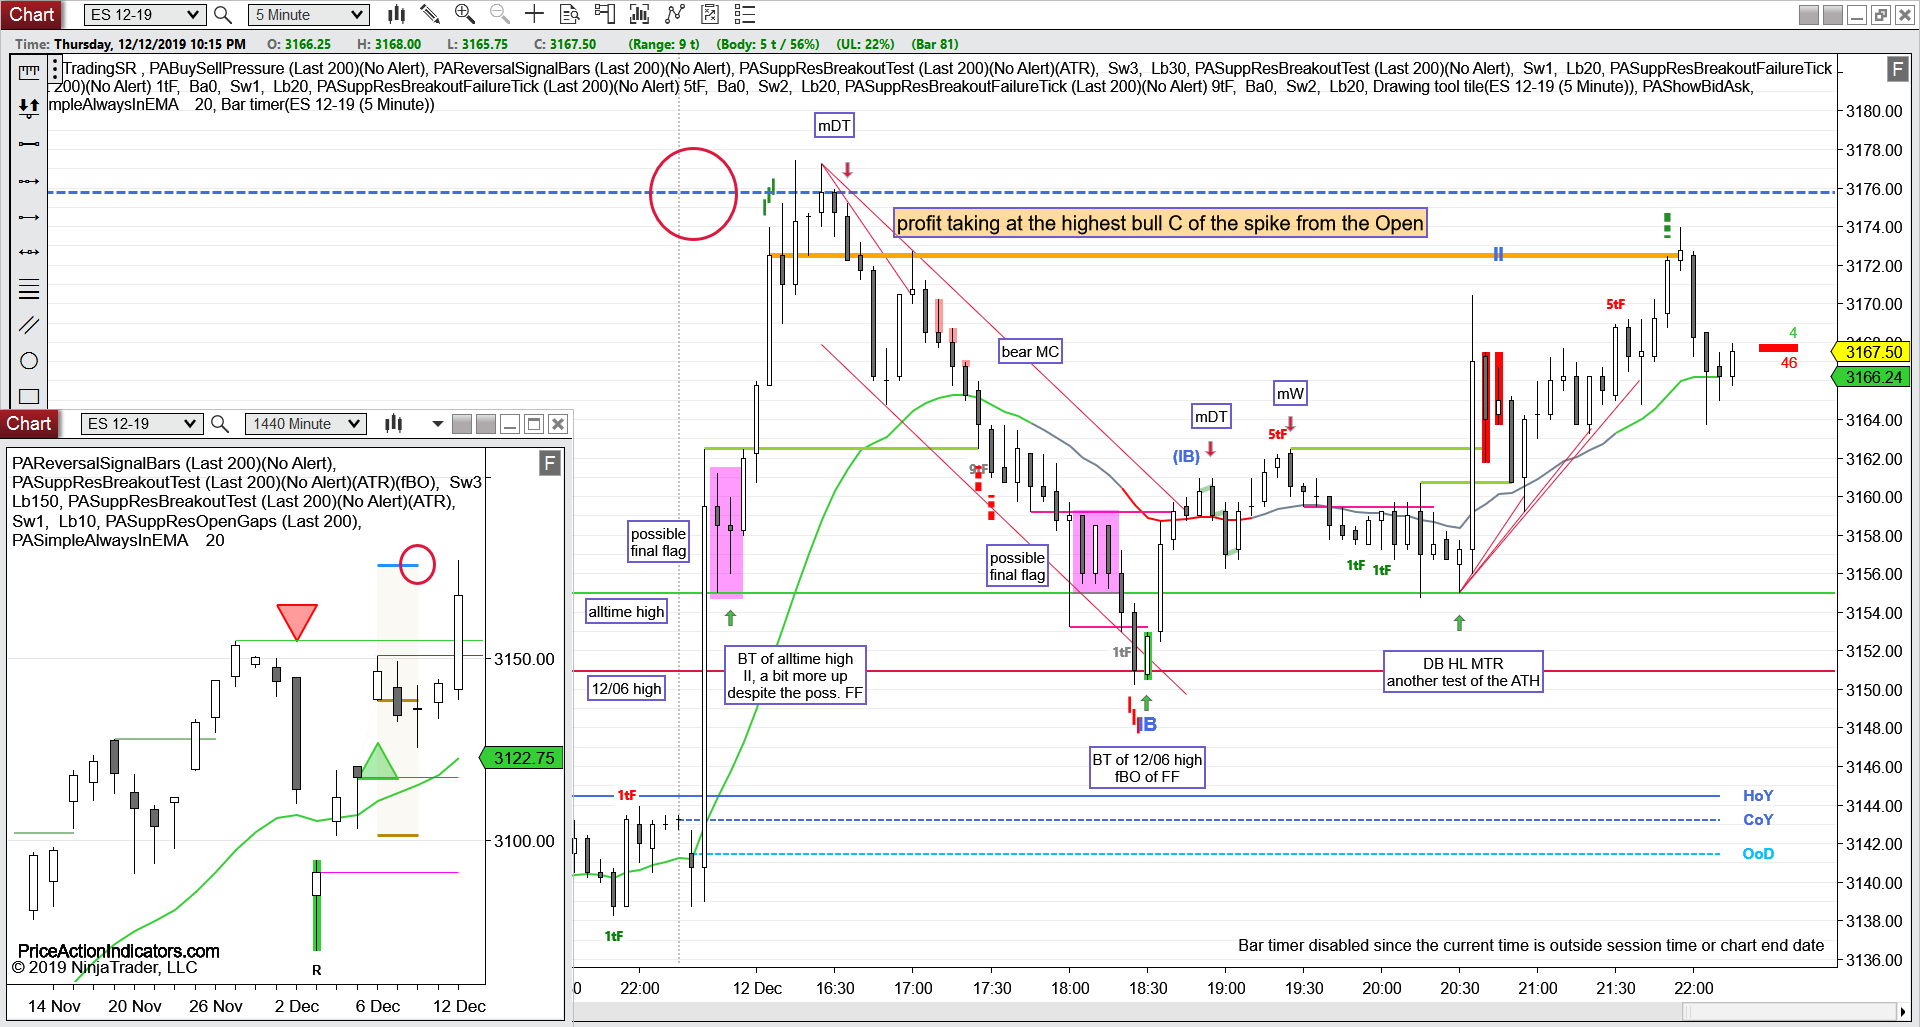
daily chart
Always In Short (AIS) since 01/24
Bull BO bar, Close above the EMA, but not back into last weeks range