E-mini ES 2019/10/10

Continuation, T1B, BO, FF, TRI, fH2, mDT, fH3, XT, BT, mDB

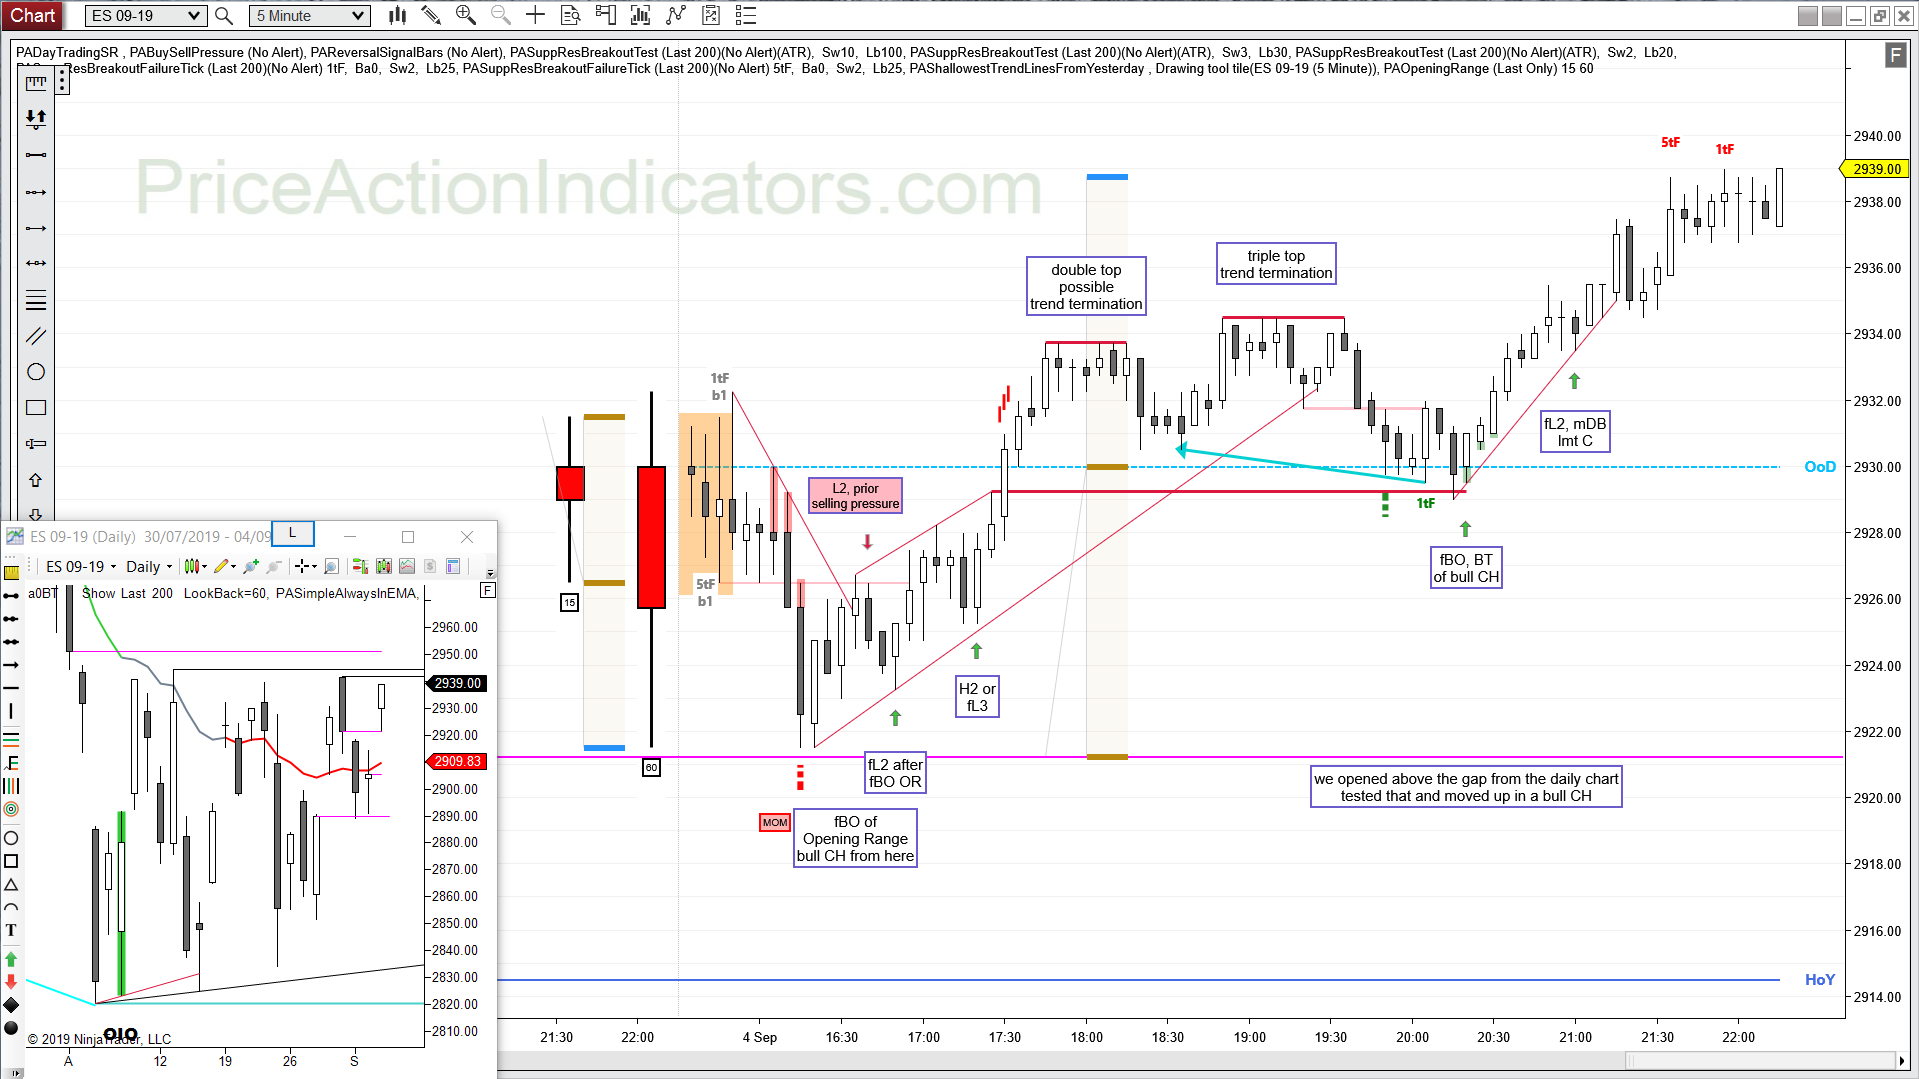
The Buy Sell Pressure indicator had three buying pressure signals during the opening drive and the following pullback.
Also it would have kept you out of that short 10 bars before the close, showing buying pressure before a bear signal bar.

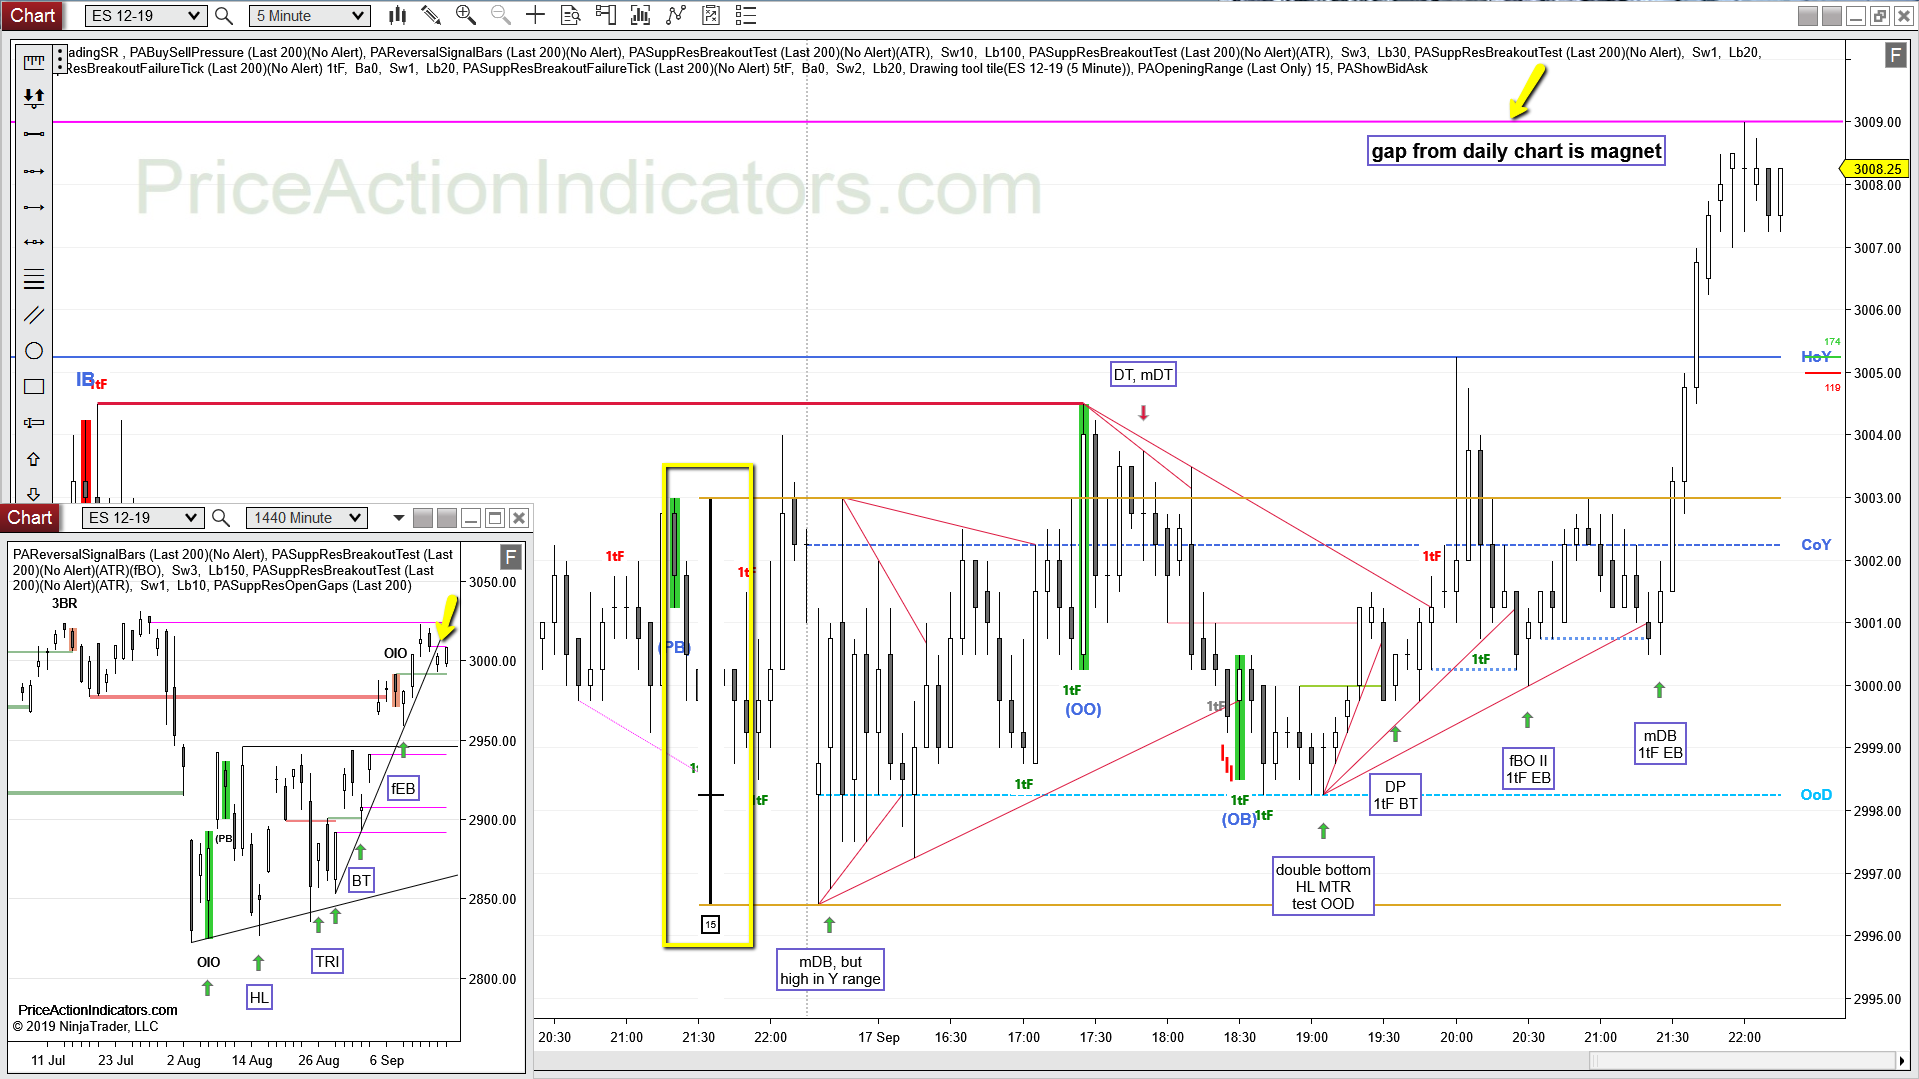
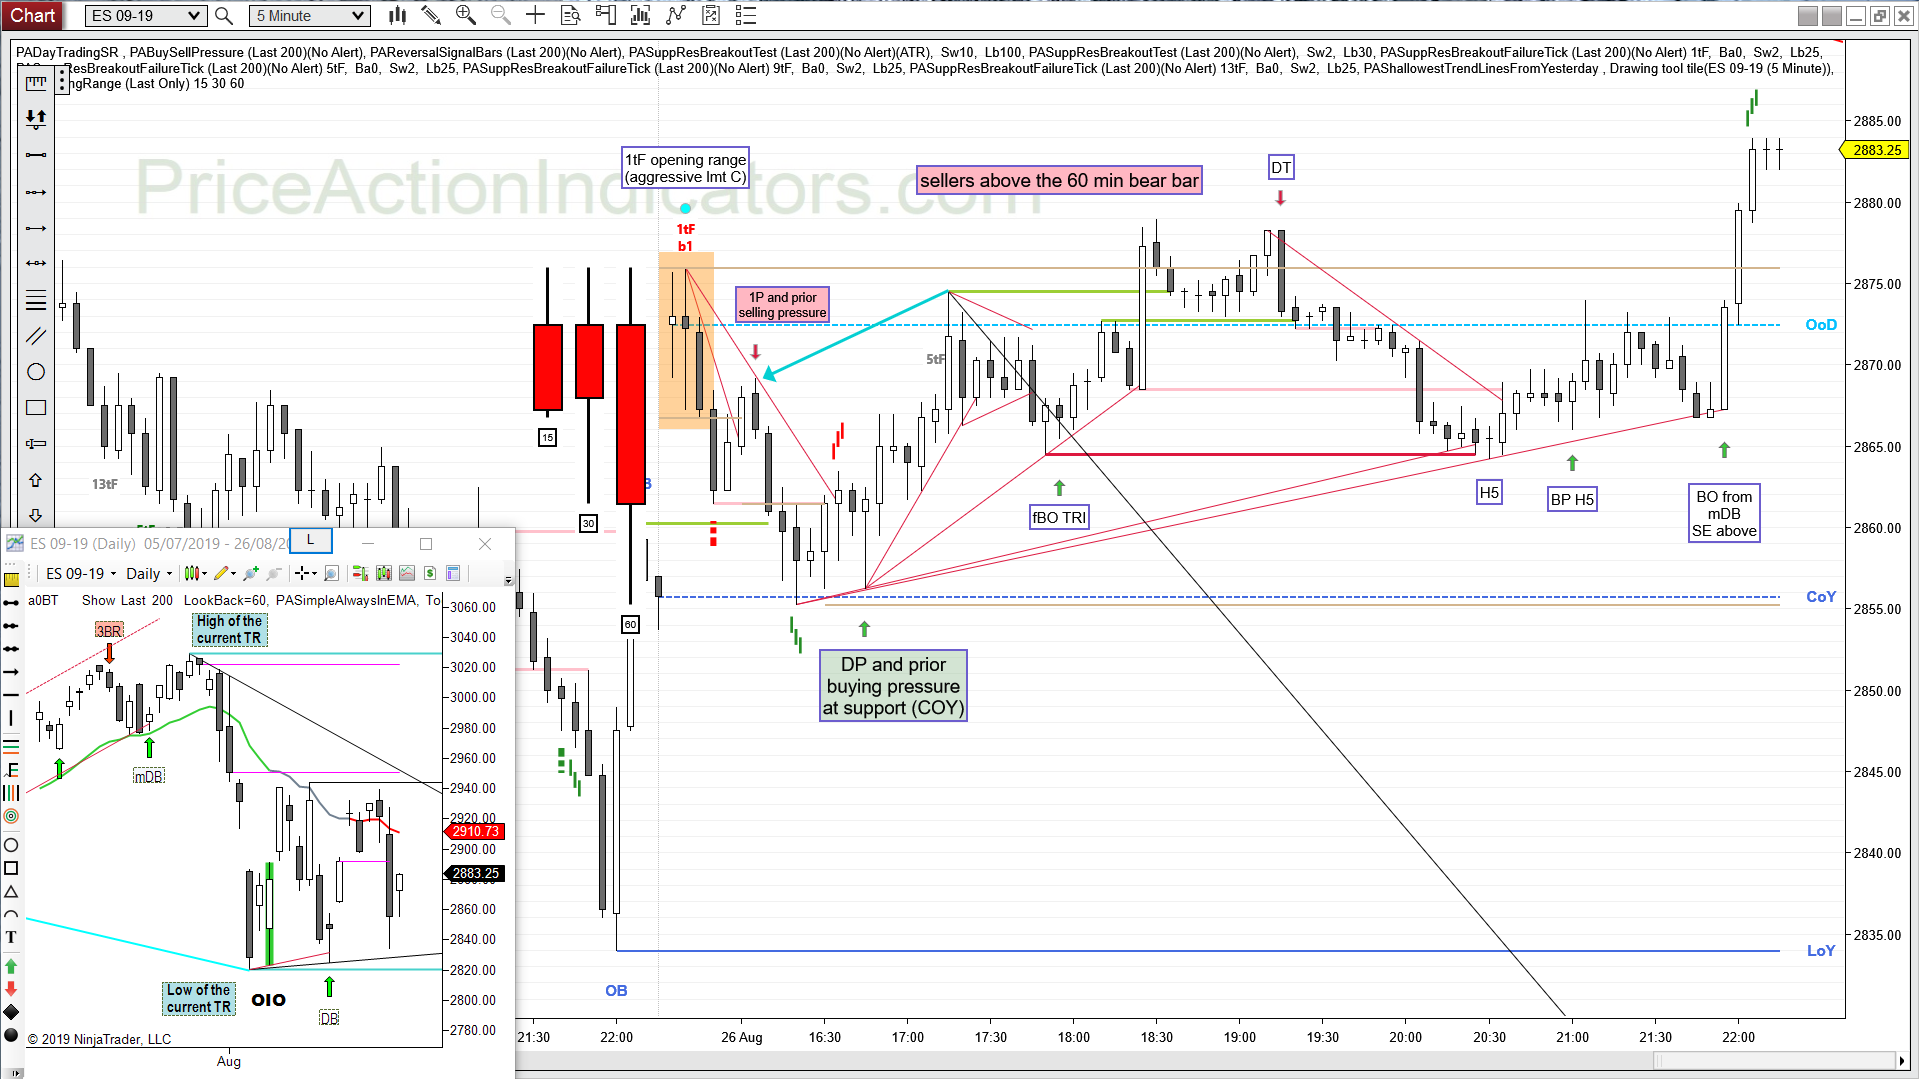
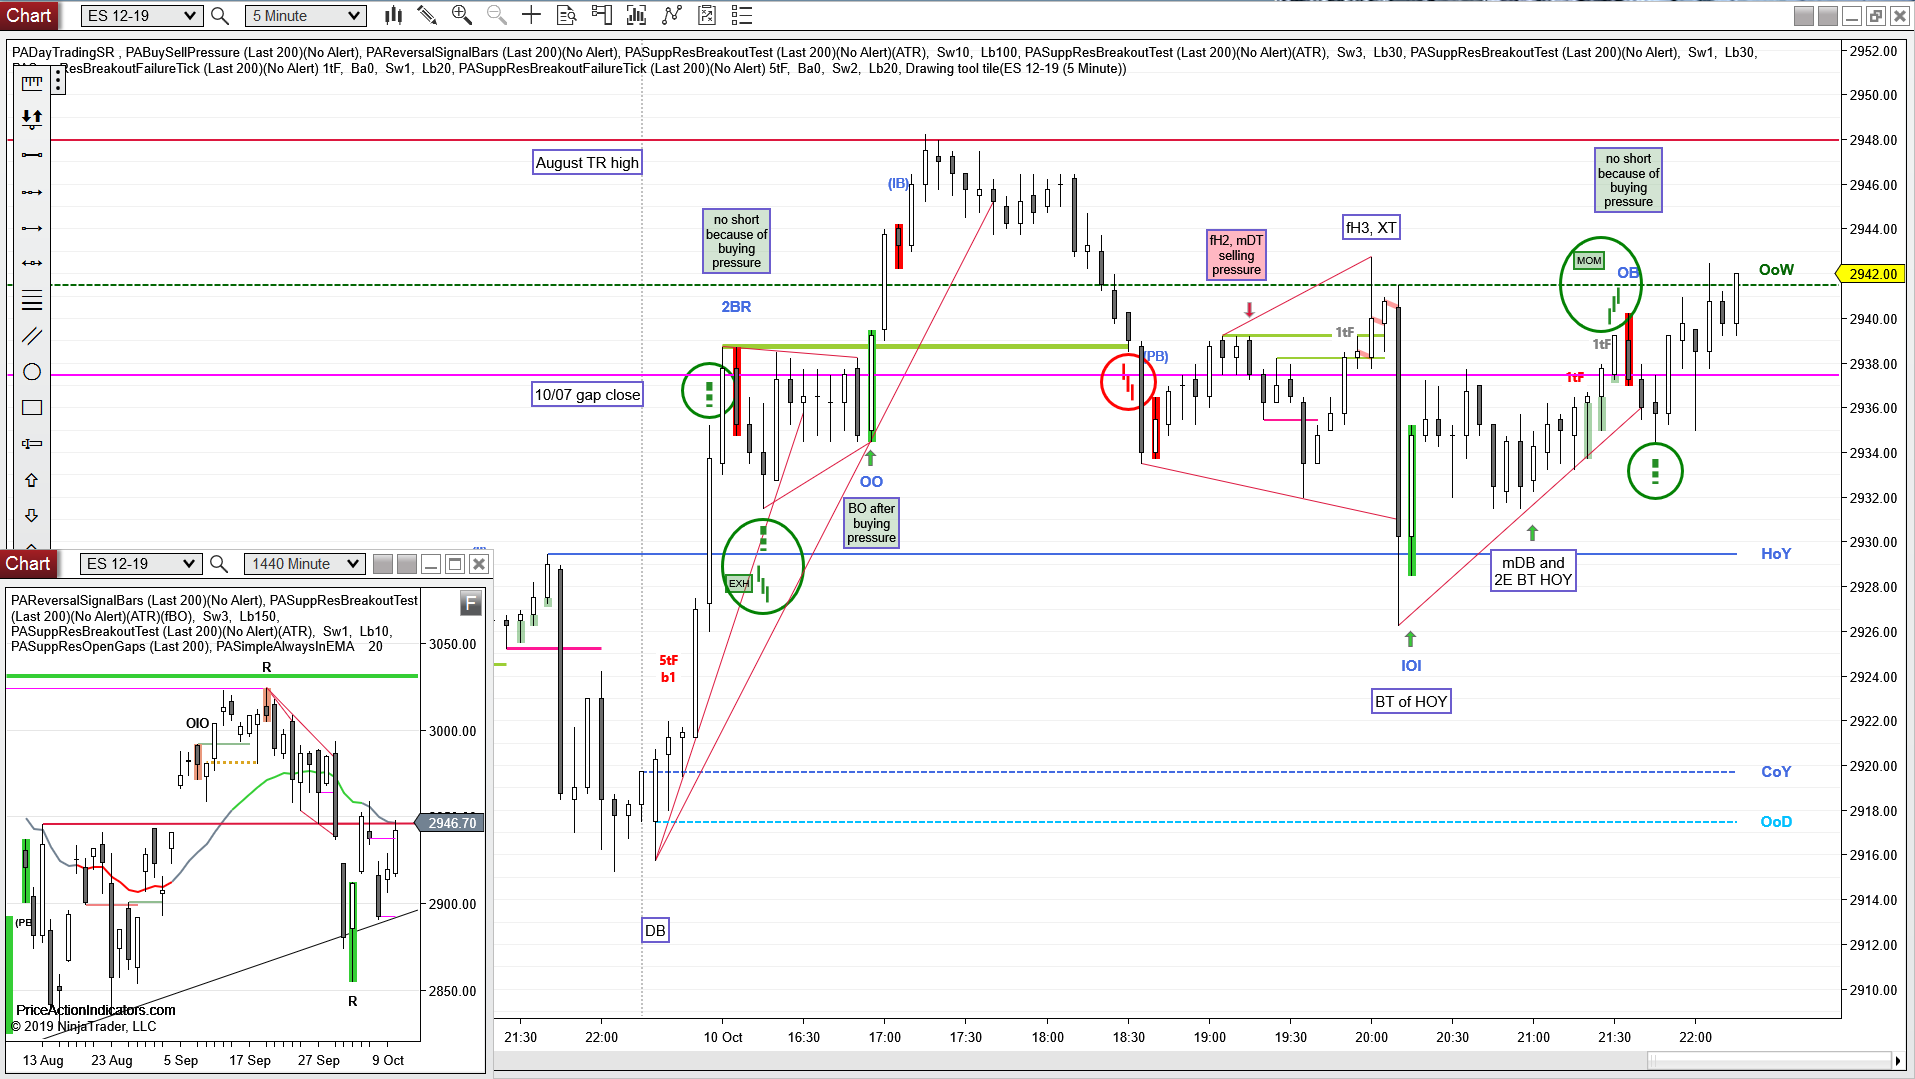
E-mini S&P 500 Future 5 min chart (trend lines, arrows and boxed text drawn by hand)
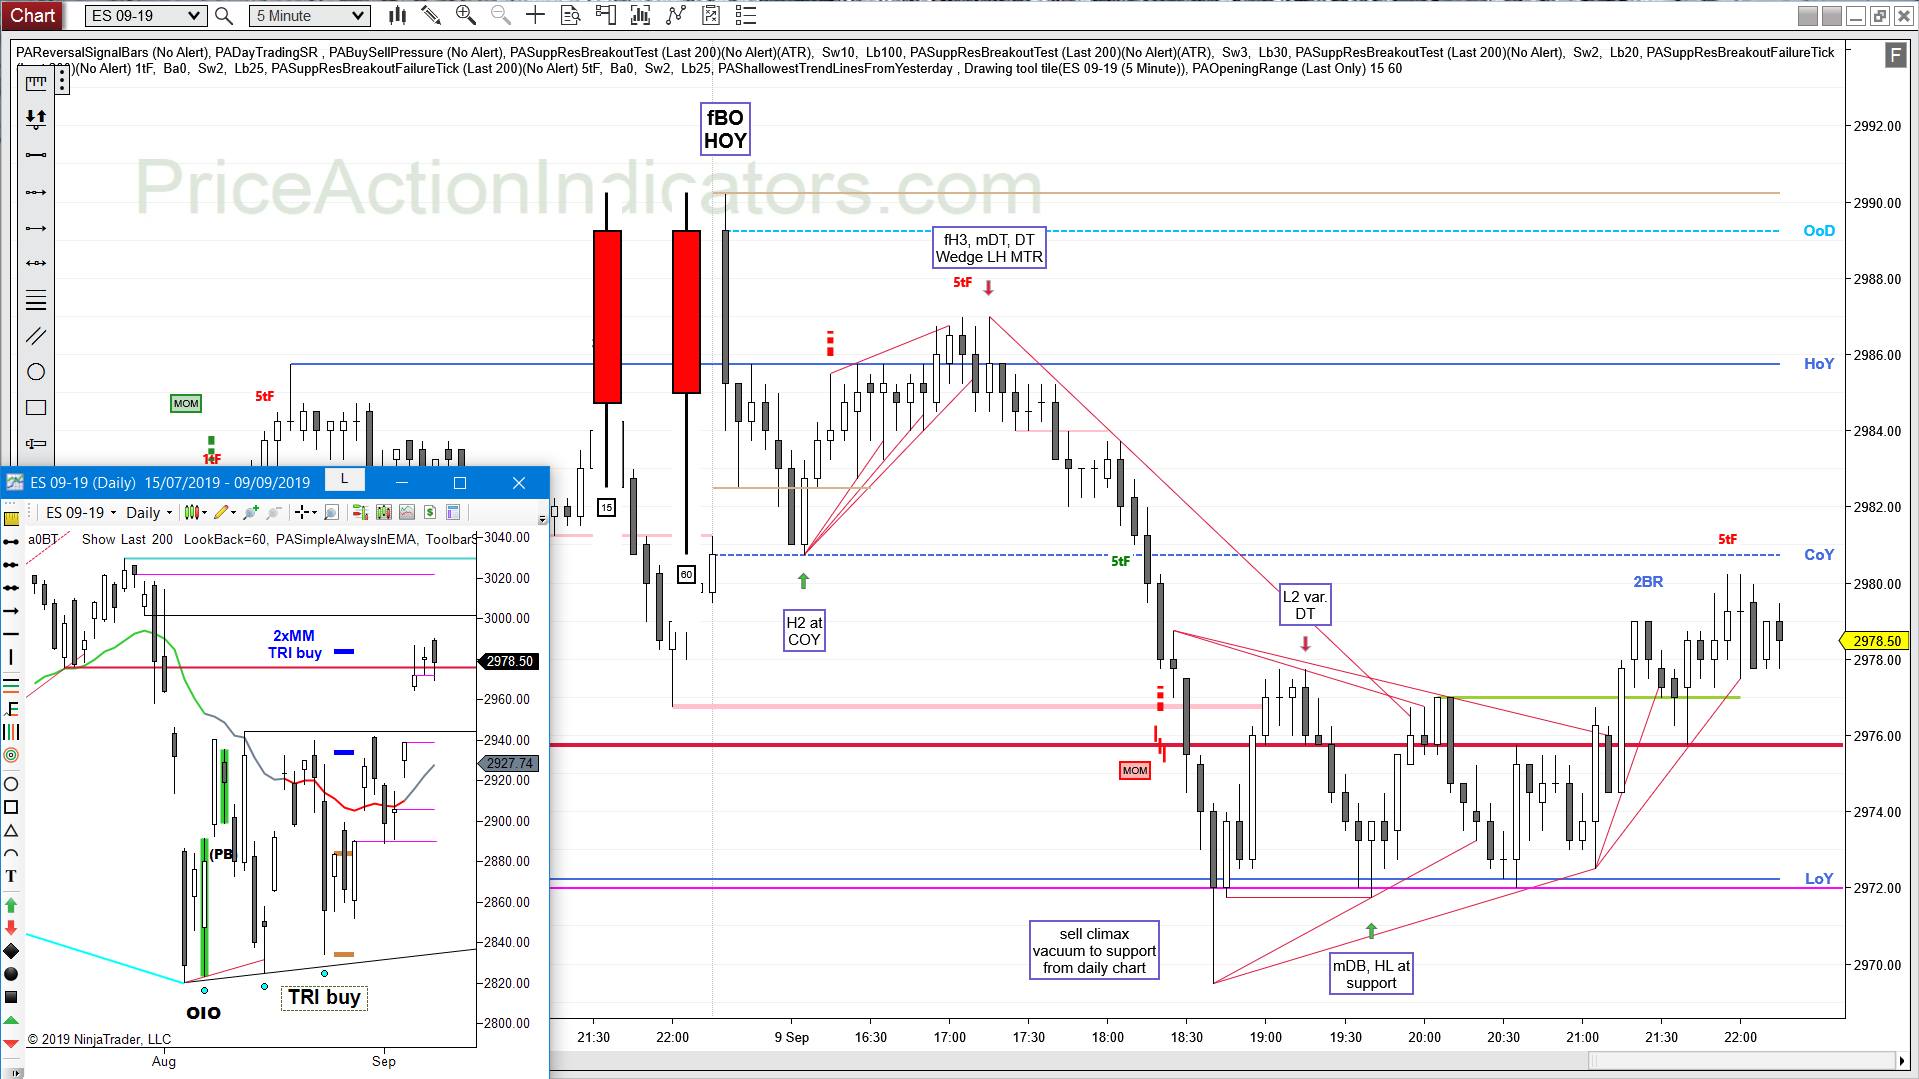
daily chart
Always In Long (AIL) since today
2nd push up for bulls, but stalling at the August TR high and EMA

E-mini ES 2019/09/09

Continuation, fBO, H2, fH3, bear CH, L2, mDB
larger triangle at support

daily chart
Always In Long (AIL) since 08/29
Outside down bar, but with a weak close (also an OIO)
a bear Signal Bar, probably sellers below

E-mini ES 2019/09/04

Bull gap, above HOY, Opening Range, bear CH, L2, fBO, fL2, H2, DT, triple top, BT, mDB

we opened above the gap from the daily chart, tested that and moved up in a bull CH

daily chart
Always In Long (AIL) since 08/29
Entry bar for yesterday’s bull Signal Bar
open above 08/30 gap and BT

E-mini ES 2019/08/26

Bull gap, mid range, Opening Range, 1P, DB, DP, fBO TRI, DT, H5, BP, mDB

the DB at COY is probably an OIO, a reversal pattern (although mid range of the prior day, if you trade the RTH chart)
I expected Brs from the daily chart at the COY
bears buy back shorts and bulls B a close near the TR low

daily chart
Always In Short (AIS) since 08/23
bull Inside Bar
bulls see a double bottom pullback (DP)