Bull gap, mid range, Opening Range, 1fBO, fL2, H2, BT, mDB, H4, 1tF BT
Some nice reactions at the S/R from the daily chart. Once we broke above the highest daily bull close (light pink area), that became support and we got a bull tend into the close.
E-mini S&P 500 Future 5 min chart (trend lines, arrows and boxed text drawn by hand)
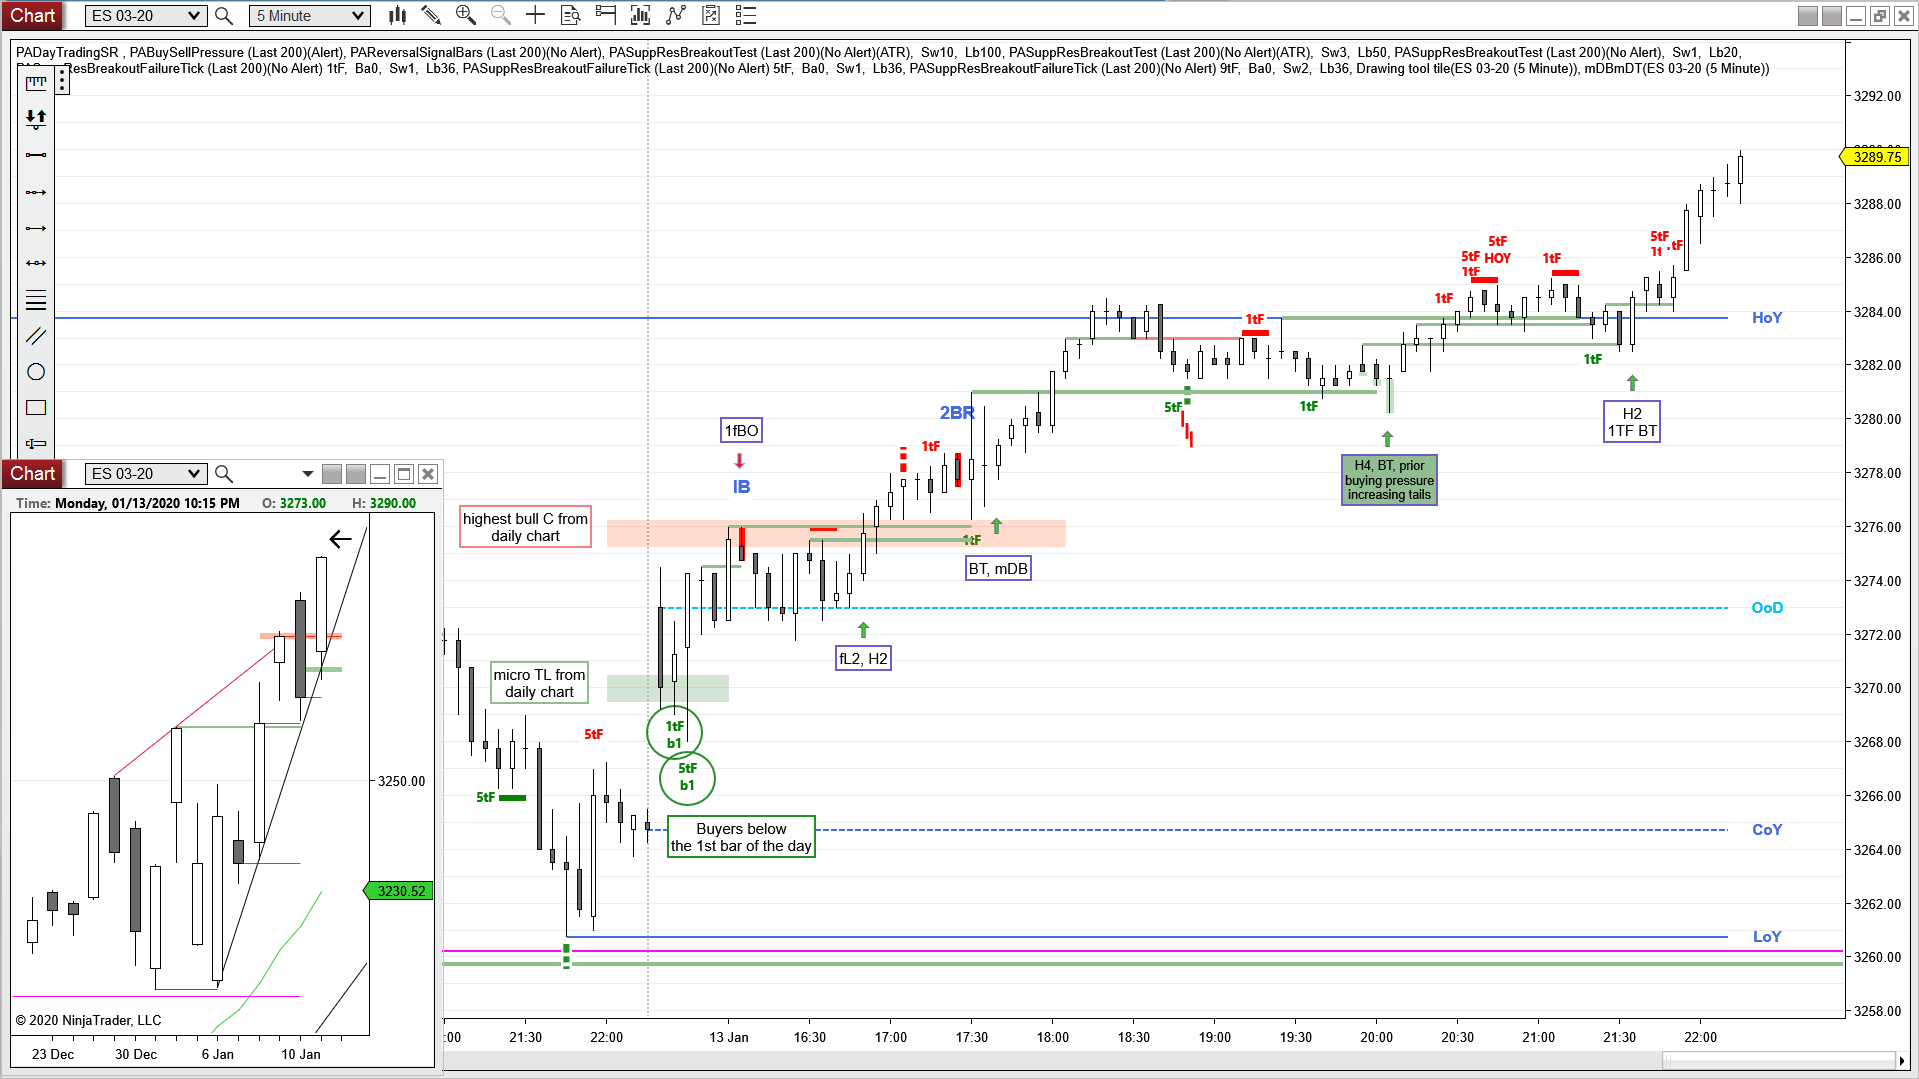
daily chart
Always In Long (AIL) since 12/06
Aggressive bulls bought the Breakout Test of the high of last week
we couldn’t even close the gap with the COY