E-mini ES 2019/08/30

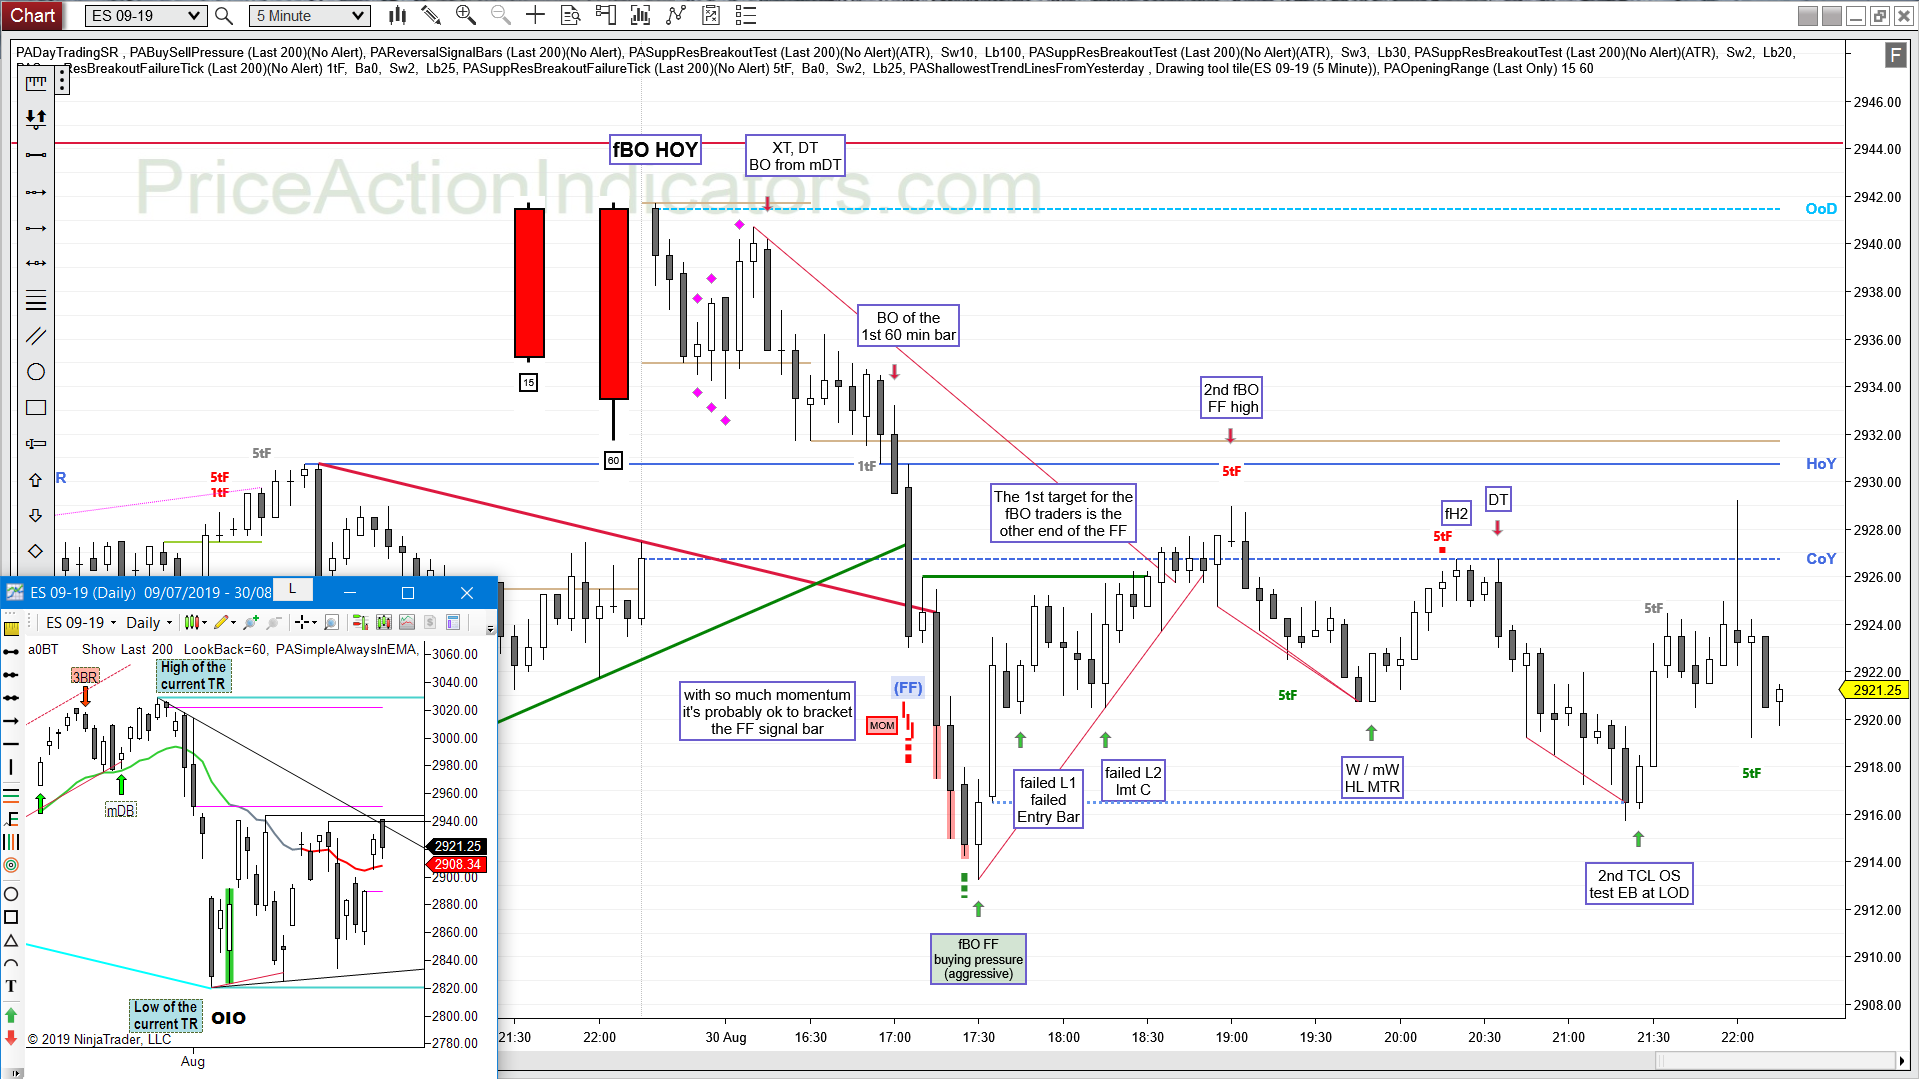
Bull gap, above HOY, TA, XT, DT, FF, fBO, fL1, fL2

daily chart
Always In Long (AIL) since 08/29
decent bear Signal Bar at the high of the August tight trading range
failed breakout of the high of last week, if price goes below the bar
also a test of the Trend Line from the ATH

E-mini ES 2018/10/16

Bull gap, mid range, XT, HL MTR, TA, fEB, fL2, H2, 1tF BO, 1tF BT, CXT, bull CH, fBO, mDB, BB

daily chart
strong bull BO, but needs FT
close right at (slightly above) the 62% fib of the large BO from last week

E-mini ES 2018/10/09

Bear gap, mid range, OR, 1fBO, TA, 1P, fBO HOY, OIO, fH2, mDT, LH MTR, IOI, 2nd fBO
b1 is a misplaced RVB

daily chart
Srs above Y OL RVB, after two large bear bodies (EB + FT)
bulls have only a weak EB