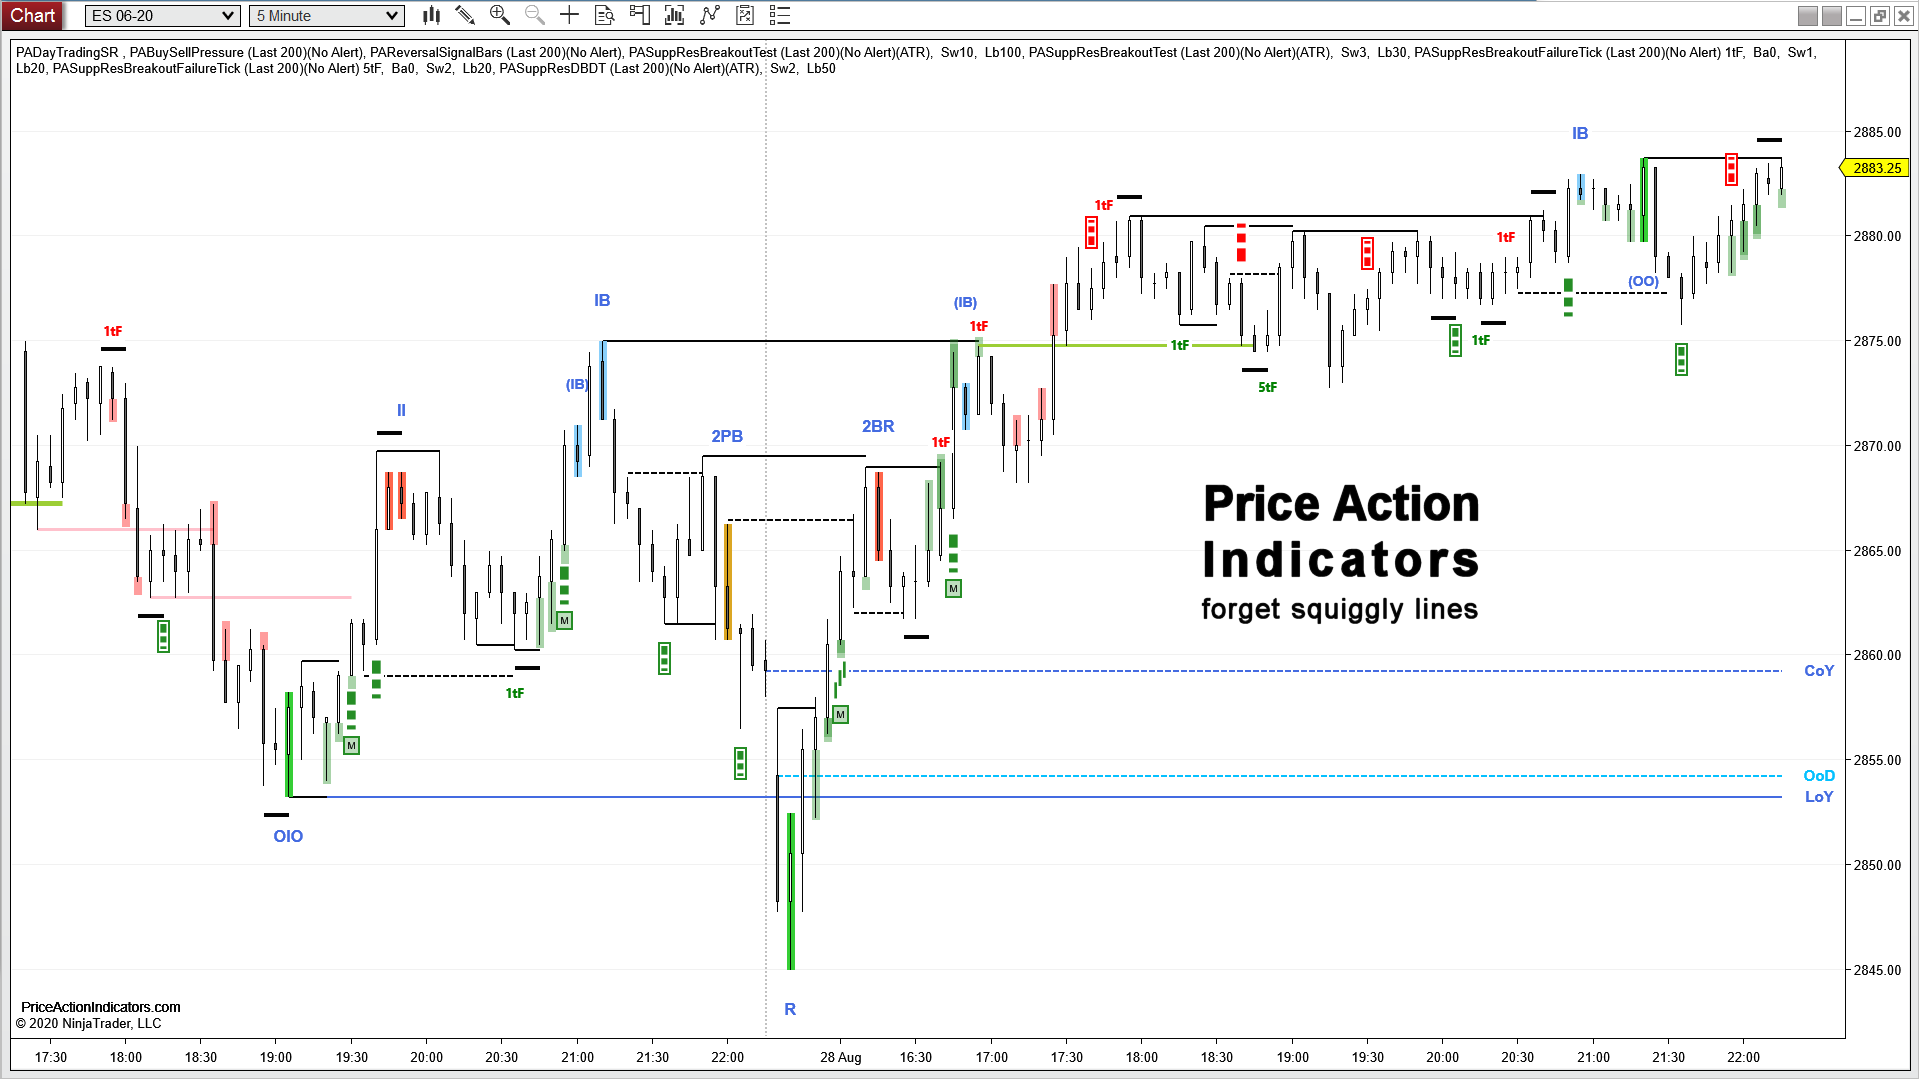
Free Price Action Indicators for NinjaTrader®
Day Trading Support/Resistance |
As a Day Trader horizontal Support and Resistance from the current and prior day are your main concern. The indicator shows: > Open/High/Low of today > High/Low/Close of yesterday > Open of the week (if price is close, it often becomes a magnet on Friday’s) Indicator name: PADayTradingSR Every setting has a short description, if you hover with the mouse pointer over the setting’s name. |
Open Gaps from Prior Days |
On instruments with RTH (regular trading hours) you often have gaps on a chart, that stay open for more than a day. Read more here: Gaps from prior Days Indicator name: PASuppResOpenGaps |
Yesterday’s shallowest Trend Lines |
As a Day Trader horizontal Support and Resistance from the current and prior day are your main concern. Add the shallowest Trend Lines from the prior day and you’re set. Read more here: Yesterday’s shallowest trend lines, be sure to draw them Indicator name: PAShallowestTrendLinesFromYesterday |
Simple AlwaysIn EMA    |
Shows Always In (Long or Short) direction using the number of recent bar closes above or below the EMA – a squiggly line, but with a different approach 😉 A trader preferably should be looking to enter the market in that direction only. Settings: > EMA period > Lookback period for number of closes above/below the EMA > Percentage of bars to close above/below the EMA in that lookback period Green plot means bullish market sentiment Red plot means bearish market sentiment Gray plot means neutral market sentiment Indicator name: PASimpleAlwaysInEMA This indicator is compatible with BloodHound from SharkIndicators or can be used in the Market Analyzer/Strategy Builder of NinjaTrader. You can call it as well from your own NinjaTrader indicators or strategies. Check out Automated Trading for BloodHound Templates. |
Show Bid/Ask |
Watch the Bid/Ask spread with Bid/Ask sizes on your chart. A large imbalance on the Bid/Ask sizes might help to see, if a support or resistance still plays a role or some profit taking is taking place.
Because of the increasing thickness of the lines, one can see an imbalance immediately. Indicator name: PAShowBidAsk |
Download free Price Action Indicators
back to Indicators
NinjaTrader® is a registered trademark of NinjaTrader Group, LLC. No NinjaTrader company has any affiliation with the owner, developer, or provider of the products or services described on this website, or any interest, ownership or otherwise, in any such product or service, or endorses, recommends or approves any such product or service.
