
A Scale-In Trading Approach
This is for advanced/experienced traders.
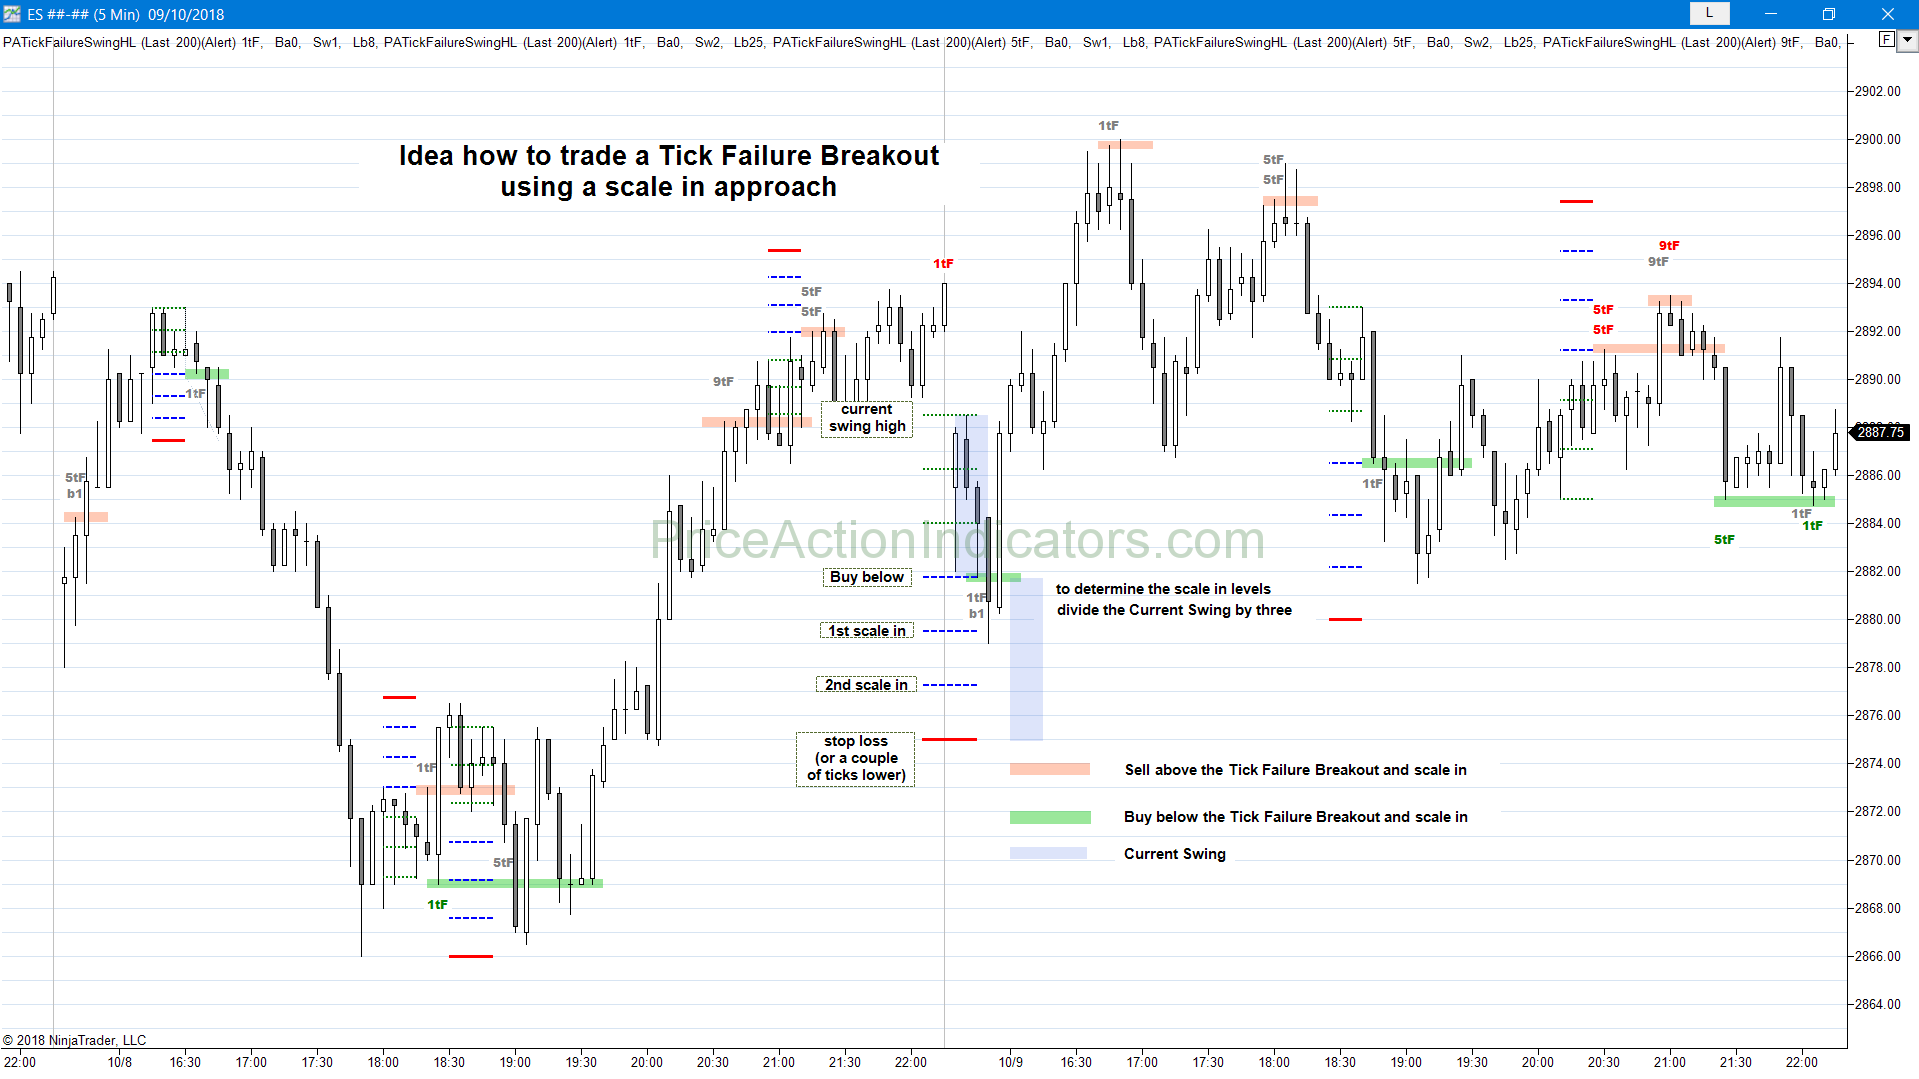
Below is a basic example, how one might trade Tick Failure Breakouts using a scale in approach.
The idea is based on fading a breakout of what appears to be trading range price action. The trading range/swing needs to be large enough. On the ES 5min chart it should be at least four points or larger.
This trading range is divided in three parts, a measured move of it is projected below or above the trading range and a breakout of it is faded with a scale-in approach.
This is no investment advice, the investor is solely responsible for the choice of the indicator signals or entry method. Please read our Disclaimer.
for the example, consider the chart below
The the 1st buy is taken below the bar, that gave the failed breakout signal.
Aggressive traders often already buy the close of the bar that gave the failed breakout signal.
If the market goes lower, the 2nd buy is taken 1/3rd the size of the trading range lower.
If the market goes lower again, the 3rd buy is taken 1/3rd the size of the trading range lower.
The stop for the entire position is a measured move of the trading range lower from the 1st entry. Add a couple of ticks to rule out the breakout going right to a measured move of the trading range and then reverse.
Support below the trading range price action, like HOY, LOY, COY or trend lines (to name a few) increase the probability of a successful trade.
Often the bar after the Tick Failure Breakout, or the context, gives already a clue, whether it makes sense to only scalp or swing parts of your position.
Please tell us what you think is missing, any kind of feedback is highly appreciated – contact us