
What do the signals mean?
The easiest way to put it: red = sellers and green = buyers
Possible Momentum Signals (acceleration)
Momentum traders bet that an asset price that is moving strongly in a given direction will continue to move in that direction until the trend loses strength. Source: FXCM.com
 |
increasing bull bodies in a bull move buying pressure |
increasing bear bodies in a bear move selling pressure |
 |
 |
decreasing lower tails in a bull move buying pressure |
decreasing upper tails in a bear move selling pressure |
 |
 |
decreasing upper tails in a bull move buying pressure |
decreasing lower tails in a bear move selling pressure |
 |
 |
decreasing overlap in a bull move buying pressure |
decreasing overlap in a bear move selling pressure |
 |
 |
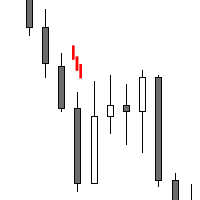
buyers on the close of the prior bar in a bull move buying pressure |
sellers on the close of the prior bar in a bear move selling pressure |
 |
 |
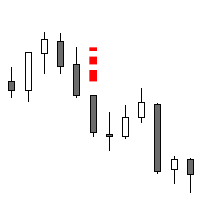
decreasing lower tails increasing bull bodies buying pressure confluence of multiple signals |
increasing bear bodies decreasing overlap selling pressure confluence of multiple signals |
 |
Possible Exhaustion Signals (deceleration)
Exhaustion is a situation in which a majority of participants trading in the same asset are either long or short, leaving few investors to take the other side of the transaction when participants wish to close their positions. For example, if everyone has already bought, when those people want to sell there will be no more buyers to sell to which will cause the price to fall. Source: Investopedia
 |
shrinking bull bodies in a bull move (outlined icon) selling pressure |
shrinking bear bodies in a bear move (outlined icon) buying pressure |
 |
 |
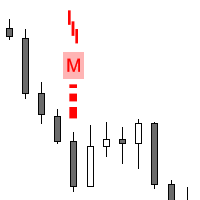
shrinking bull bodies in a bull move (outlined icon) and possible Volume Divergence selling pressure |
shrinking bear bodies in a bear move (outlined icon) and possible Volume Divergence buying pressure |
 |
 |
increasing upper tails in a bull move selling pressure |
increasing lower tails in a bear move buying pressure |
 |
 |
increasing lower tails in a bull move selling pressure |
increasing upper tails in a bear move buying pressure |
 |
 |
increasing overlap in a bull move (outlined icon) selling pressure |
increasing overlap in a bear move (outlined icon) buying pressure |
 |
 |
sellers on the close of the prior bar in a bull move selling pressure |
buyers on the close of the prior bar in a bear move buying pressure |
 |
 |
increasing lower tails increasing overlap selling pressure confluence of multiple signals |
increasing lower tails shrinking bear bodies buying pressure confluence of multiple signals |
 |
How to install the TrueType font for the Buy Sell Pressure Indicator

- Download the “PriceActionFont.zip” file from the indicator page and open it
- Unpack the PriceActionFont.zip to some location on your computer
- Double click on the file “priceaction.ttf” (the TrueType font file) to be installed in Windows
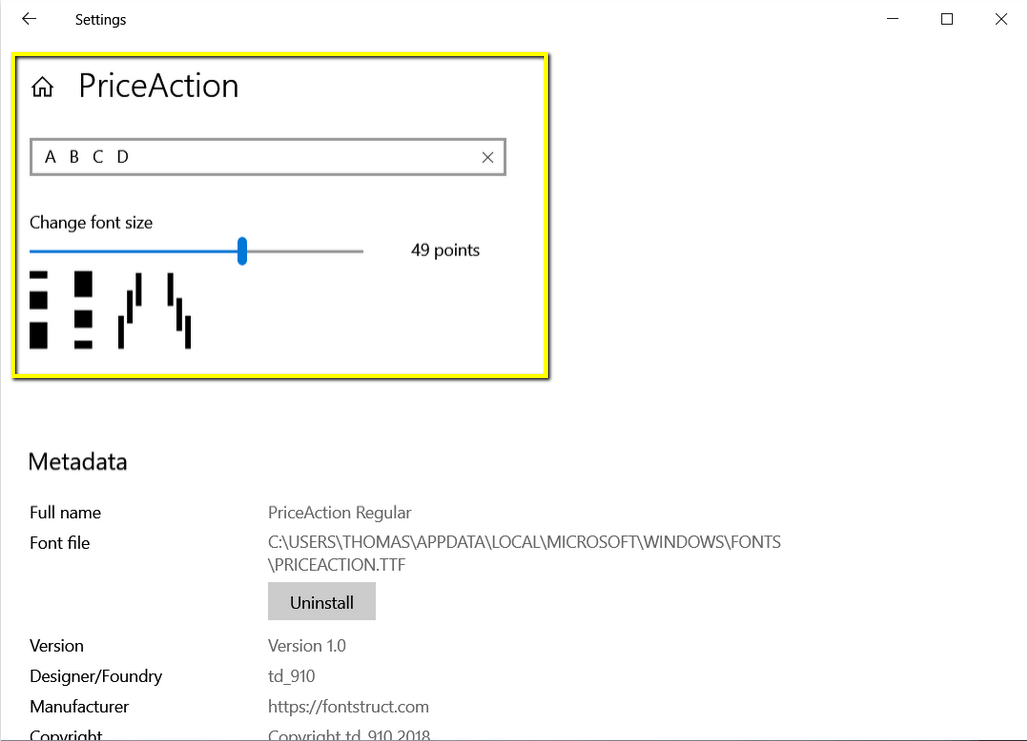
(If you want to uninstall the font later, just use the Windows Control Panel.)
Please tell us what you think is missing, any kind of feedback is highly appreciated – contact us
Back to Buy Sell Pressure