
Support and Resistance – Breakout Test
Indicator for NinjaTrader® 7/8
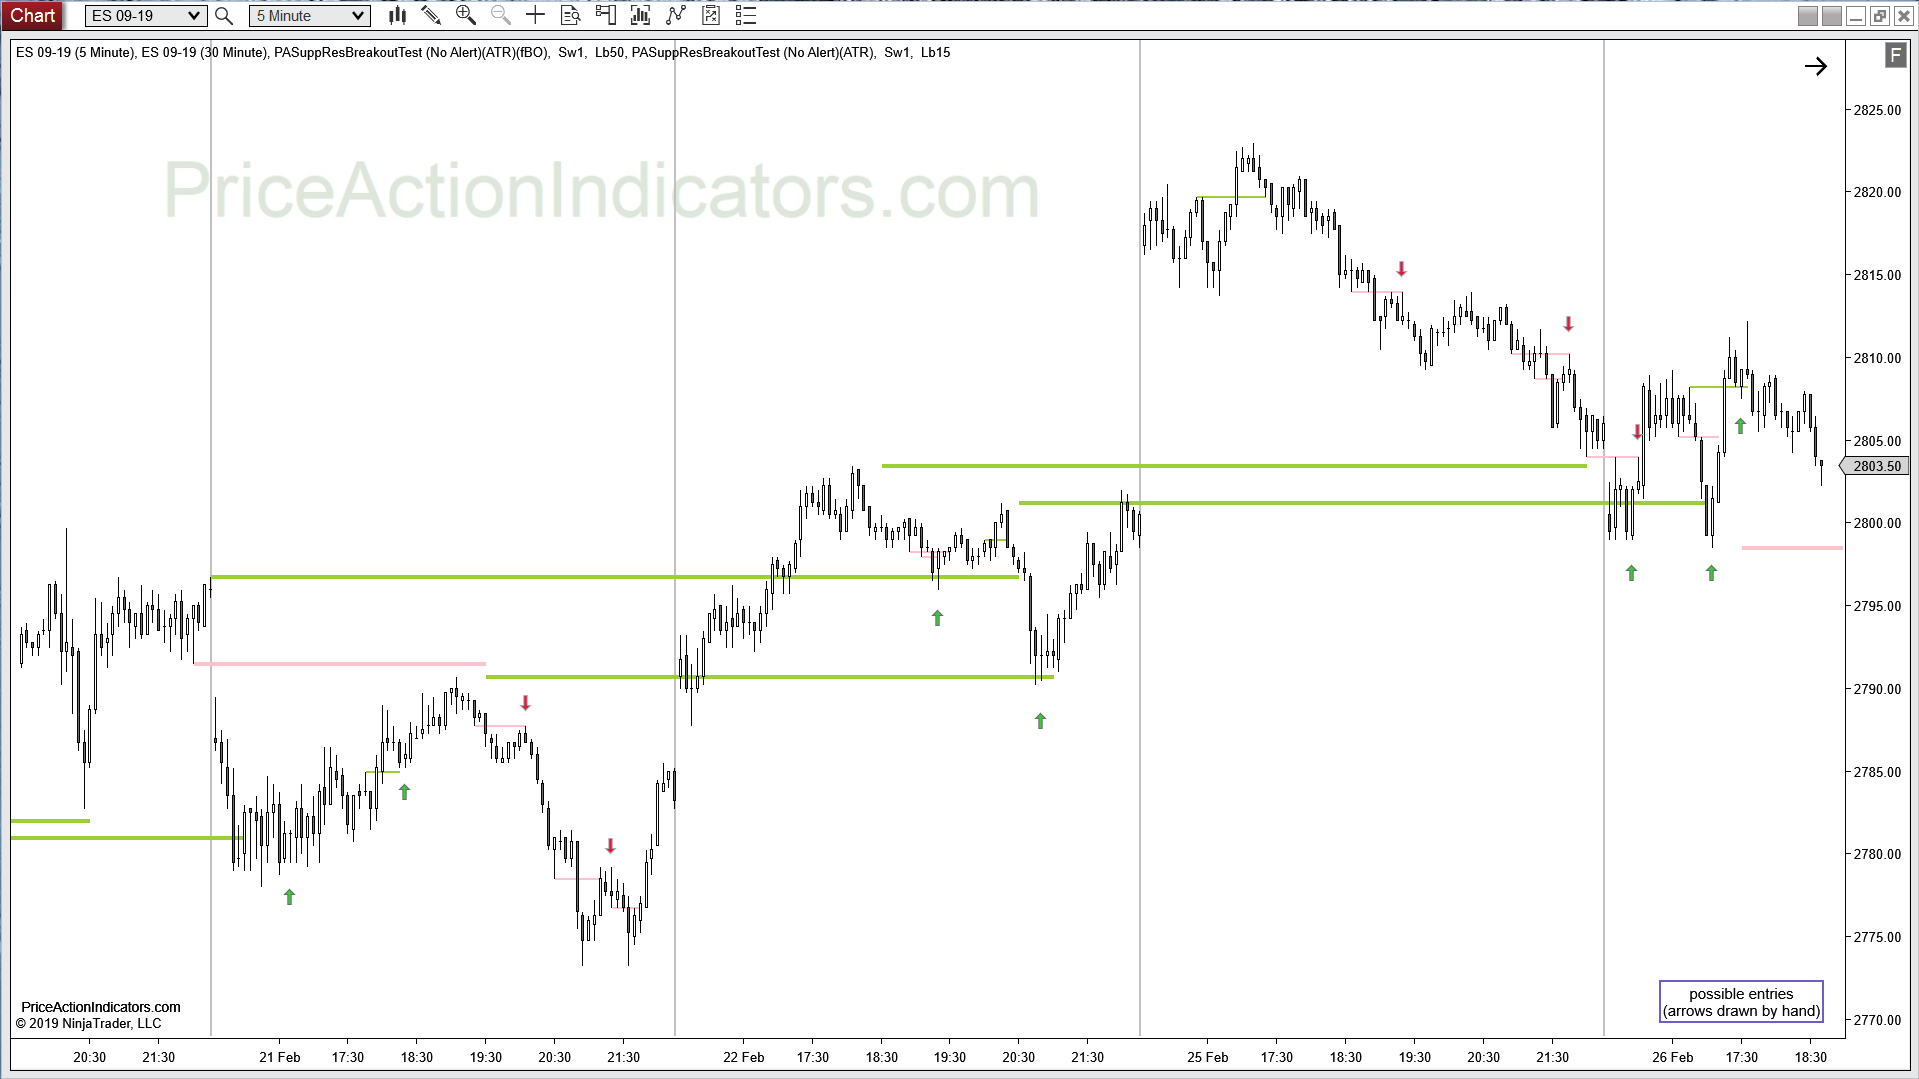
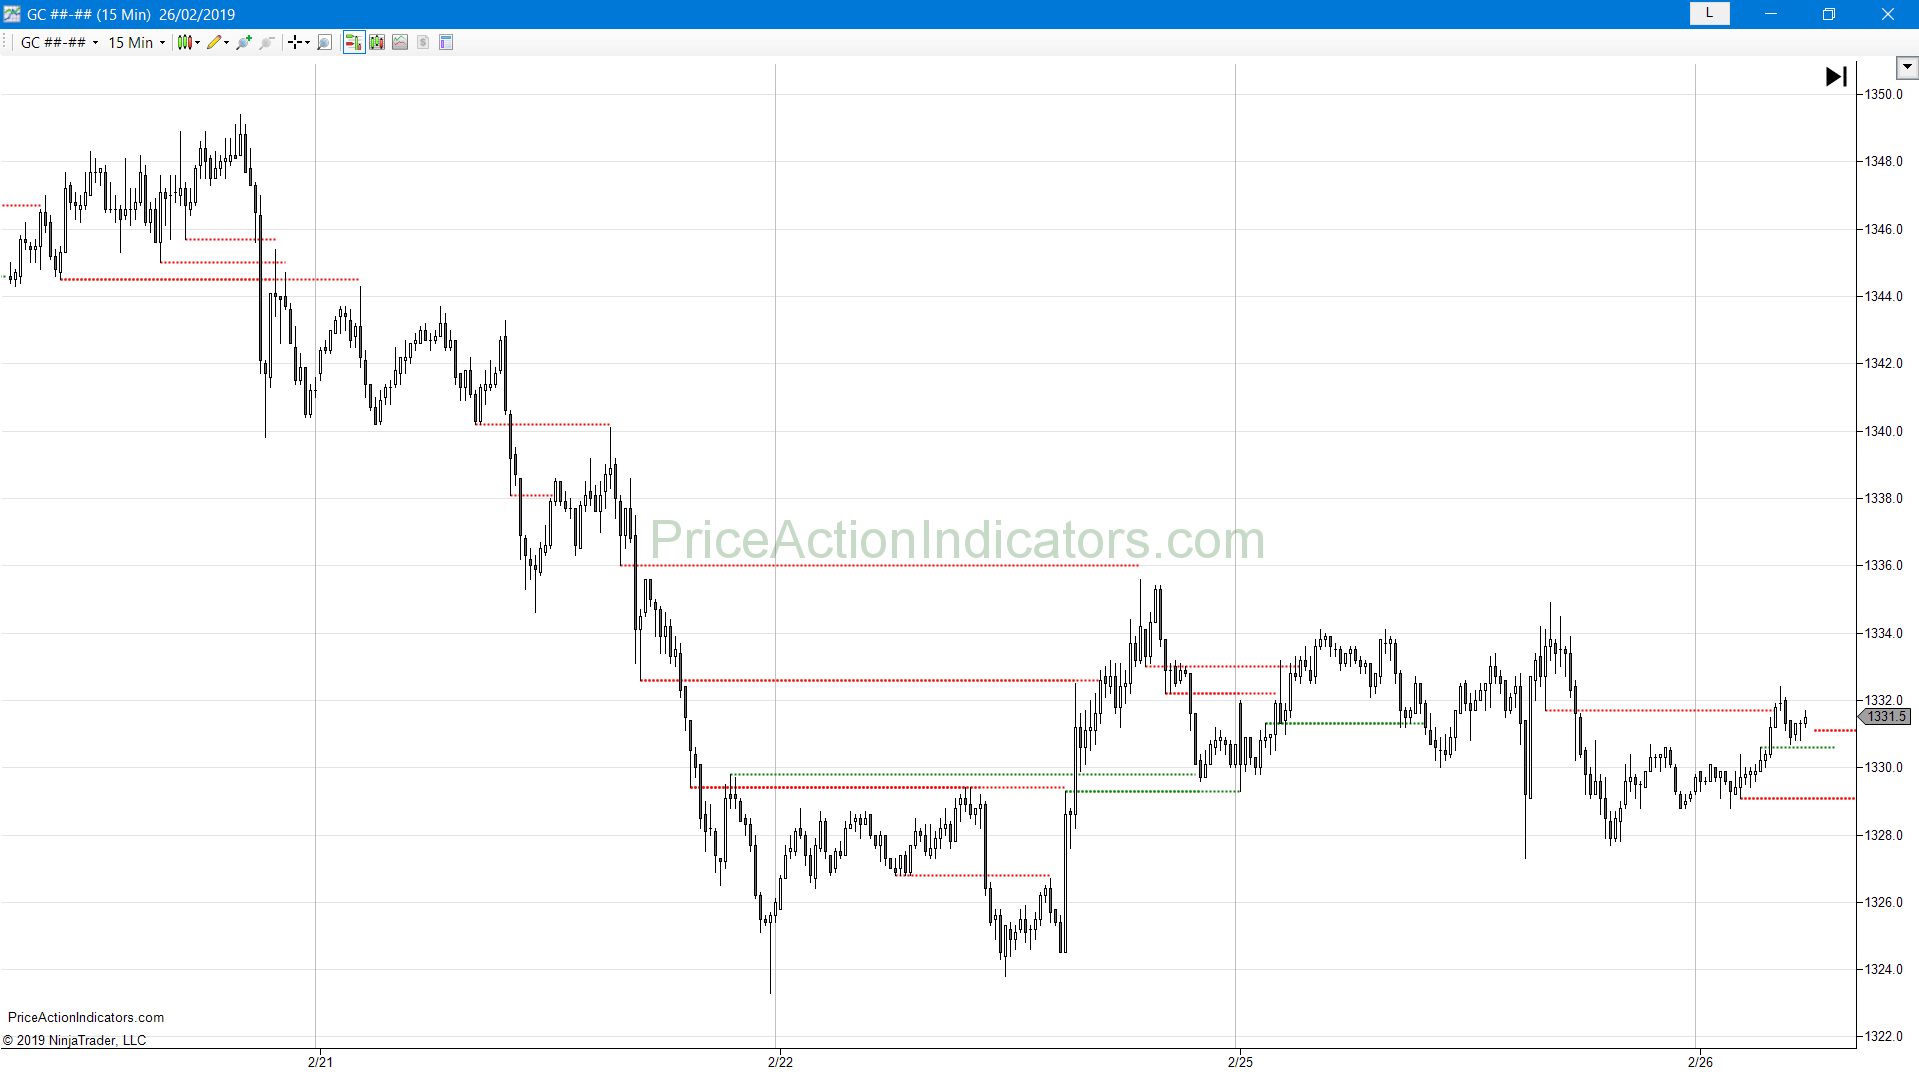
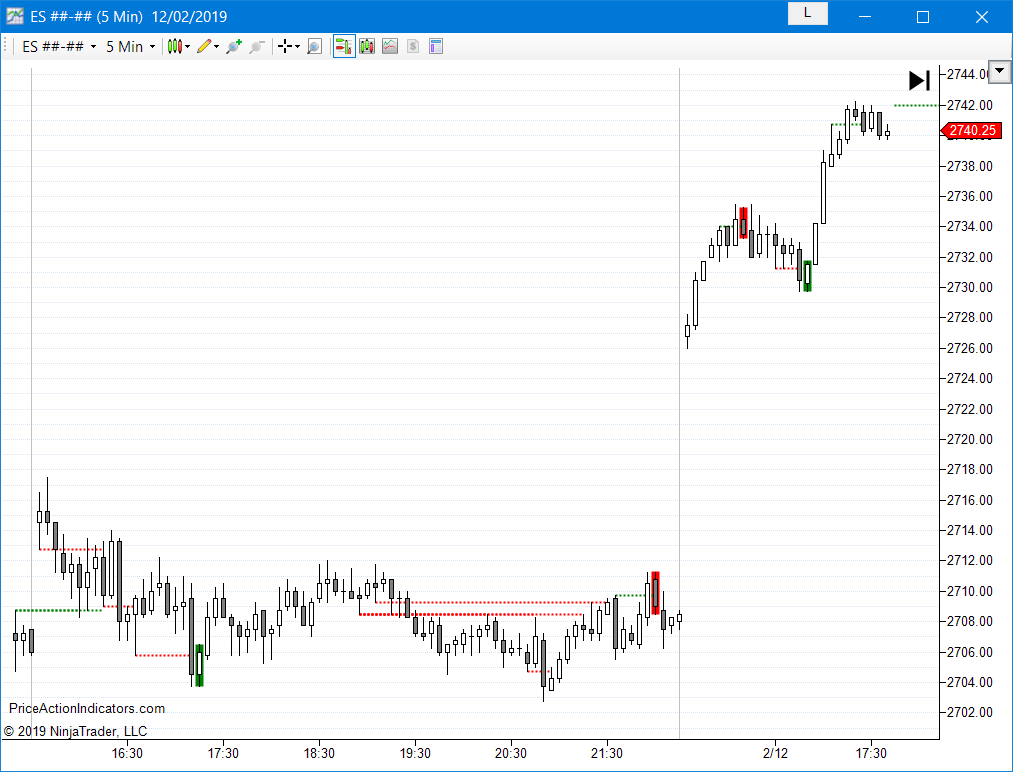
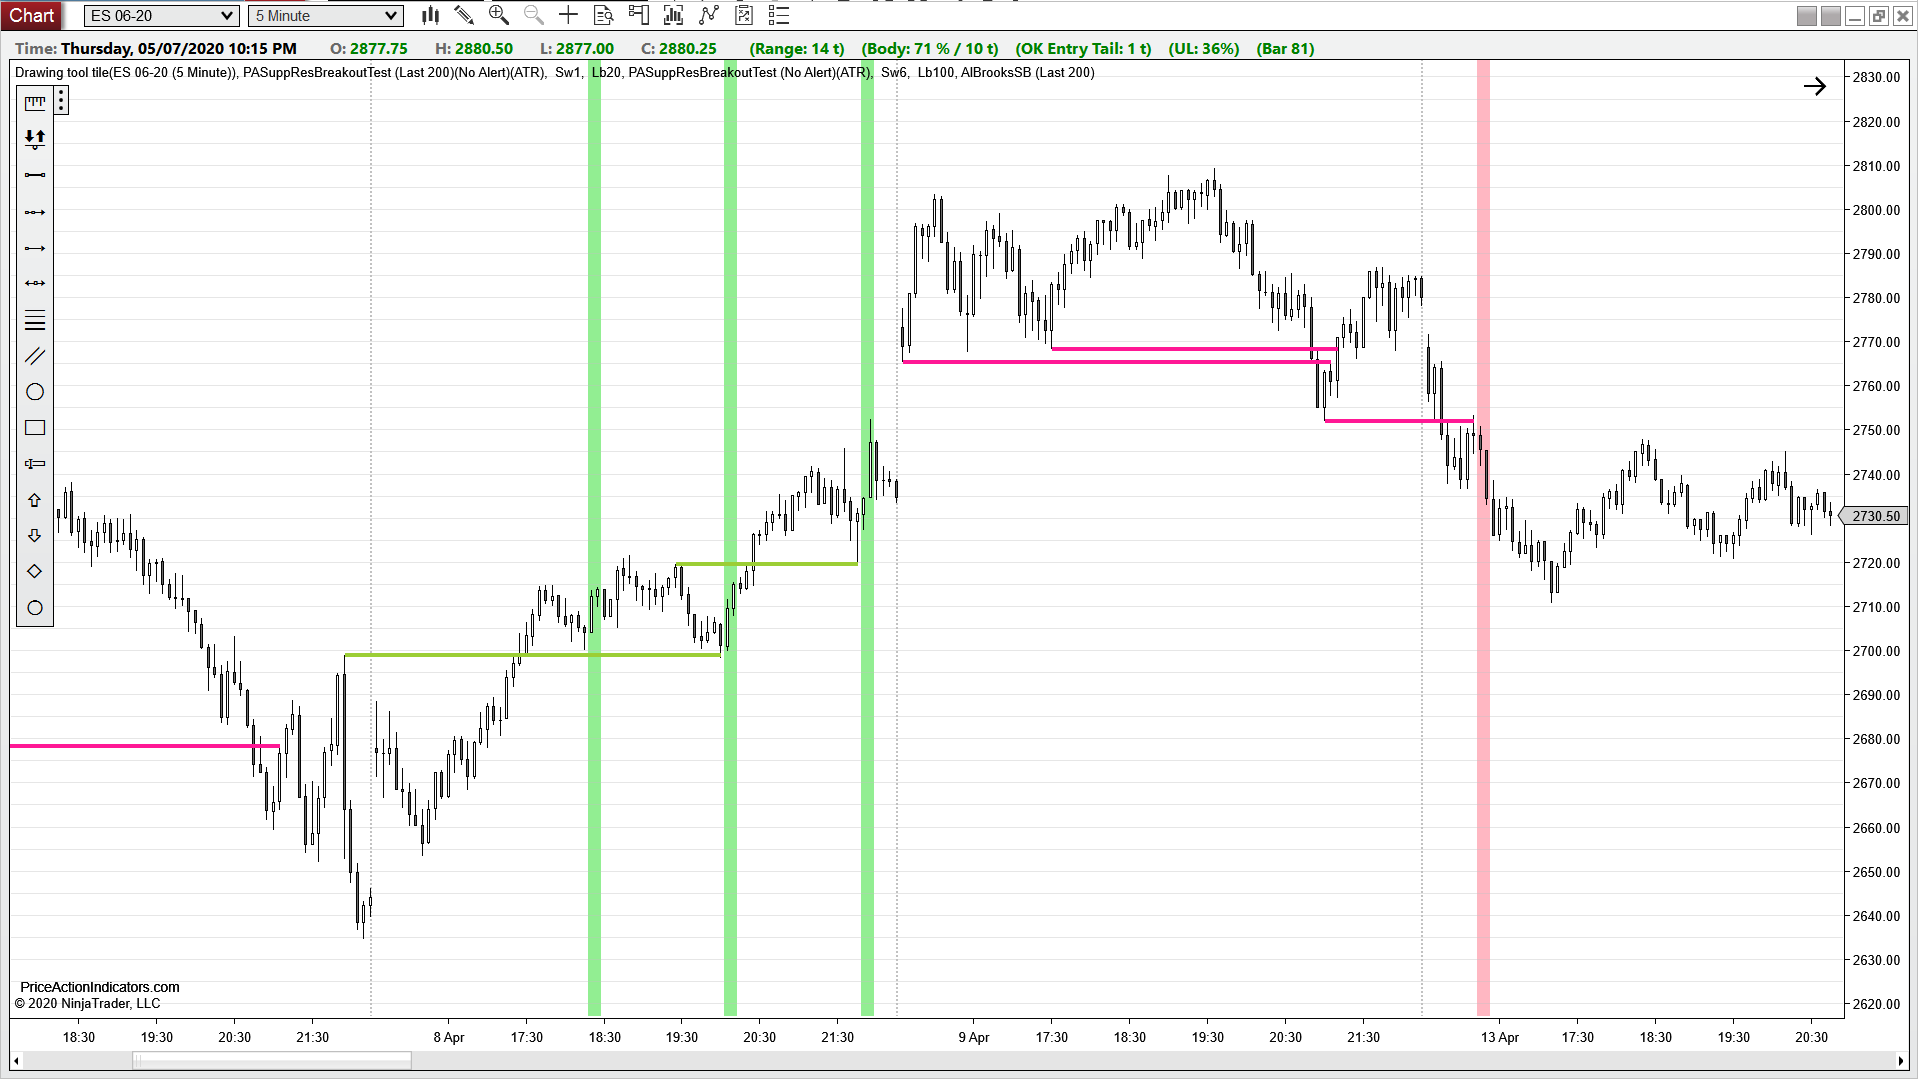
E-mini S&P 500 Future 5 min chart (arrows drawn by hand)
Features
- Shows lines for broken Support or Resistance, that are tested by subsequent price action
- use as a discretionary indicator and for Automated Trading with BloodHound
- shows signals in real-time
- alert feature
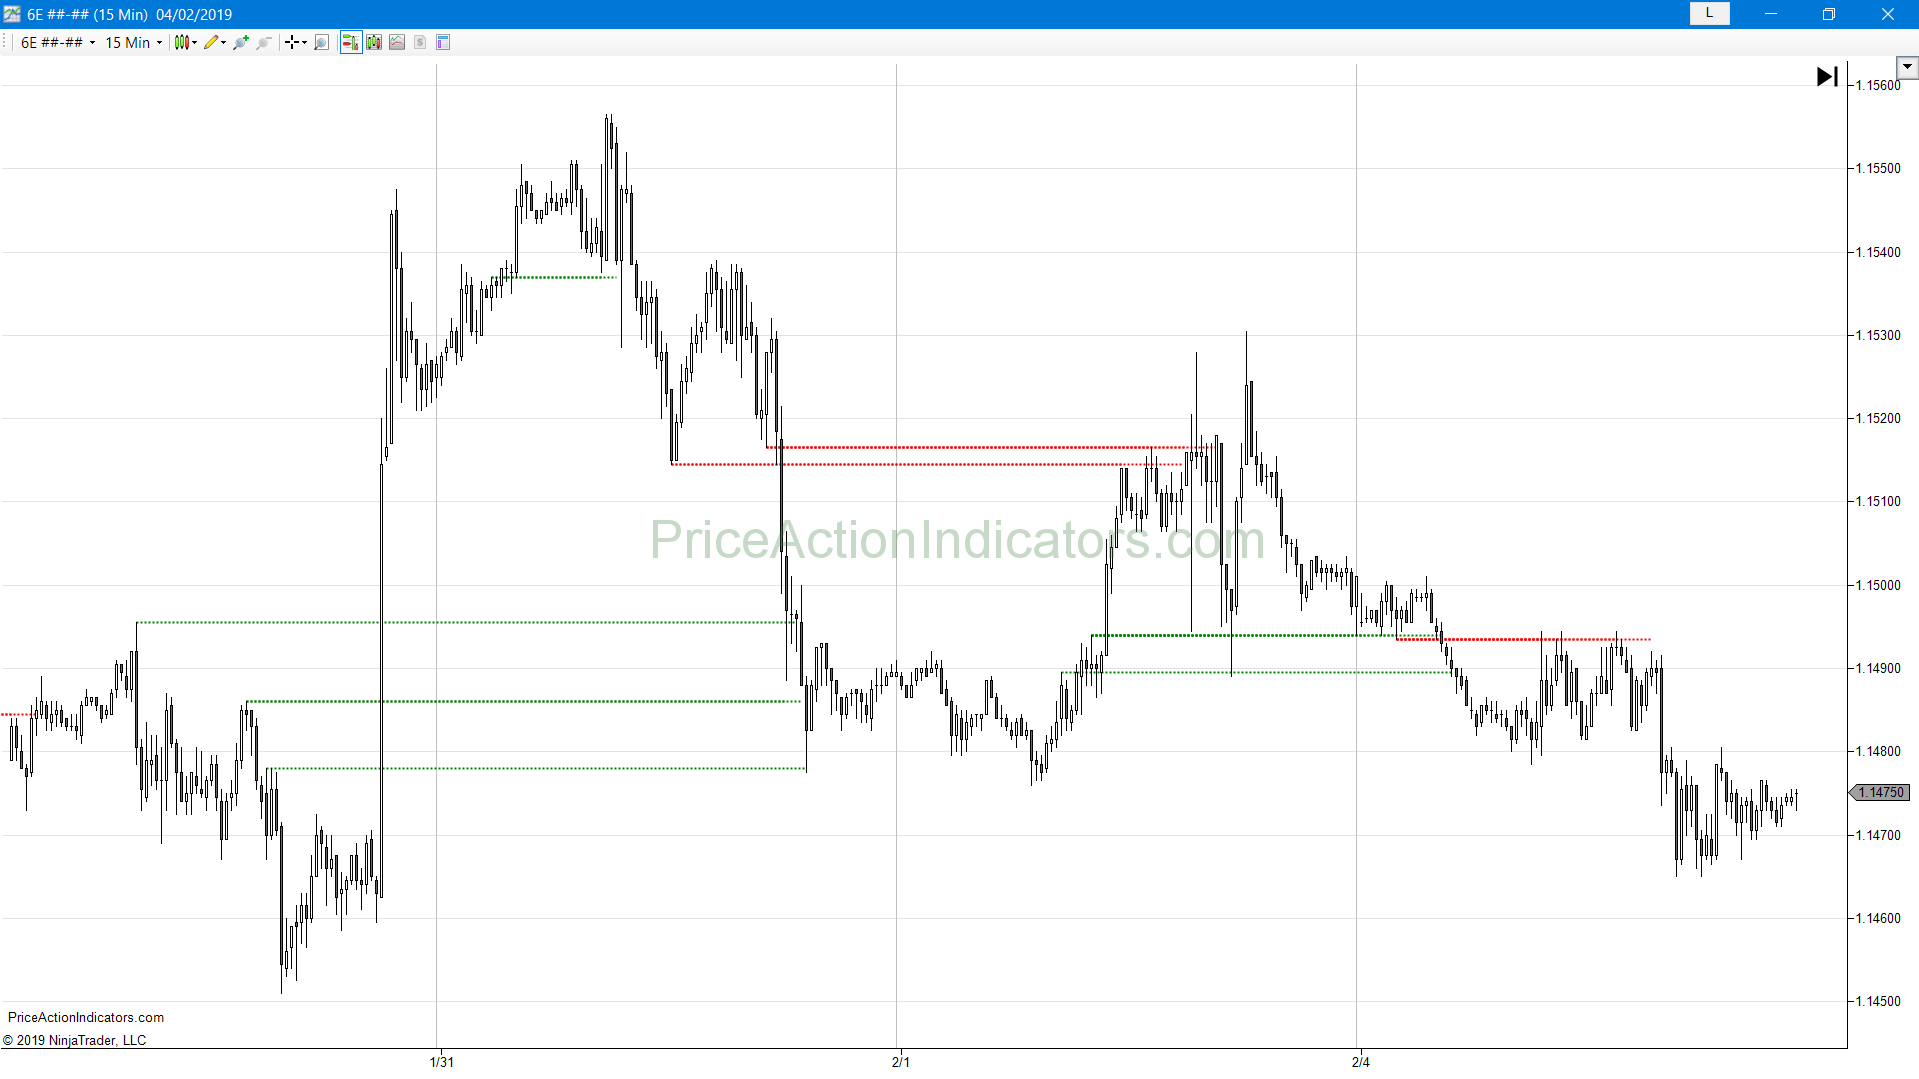
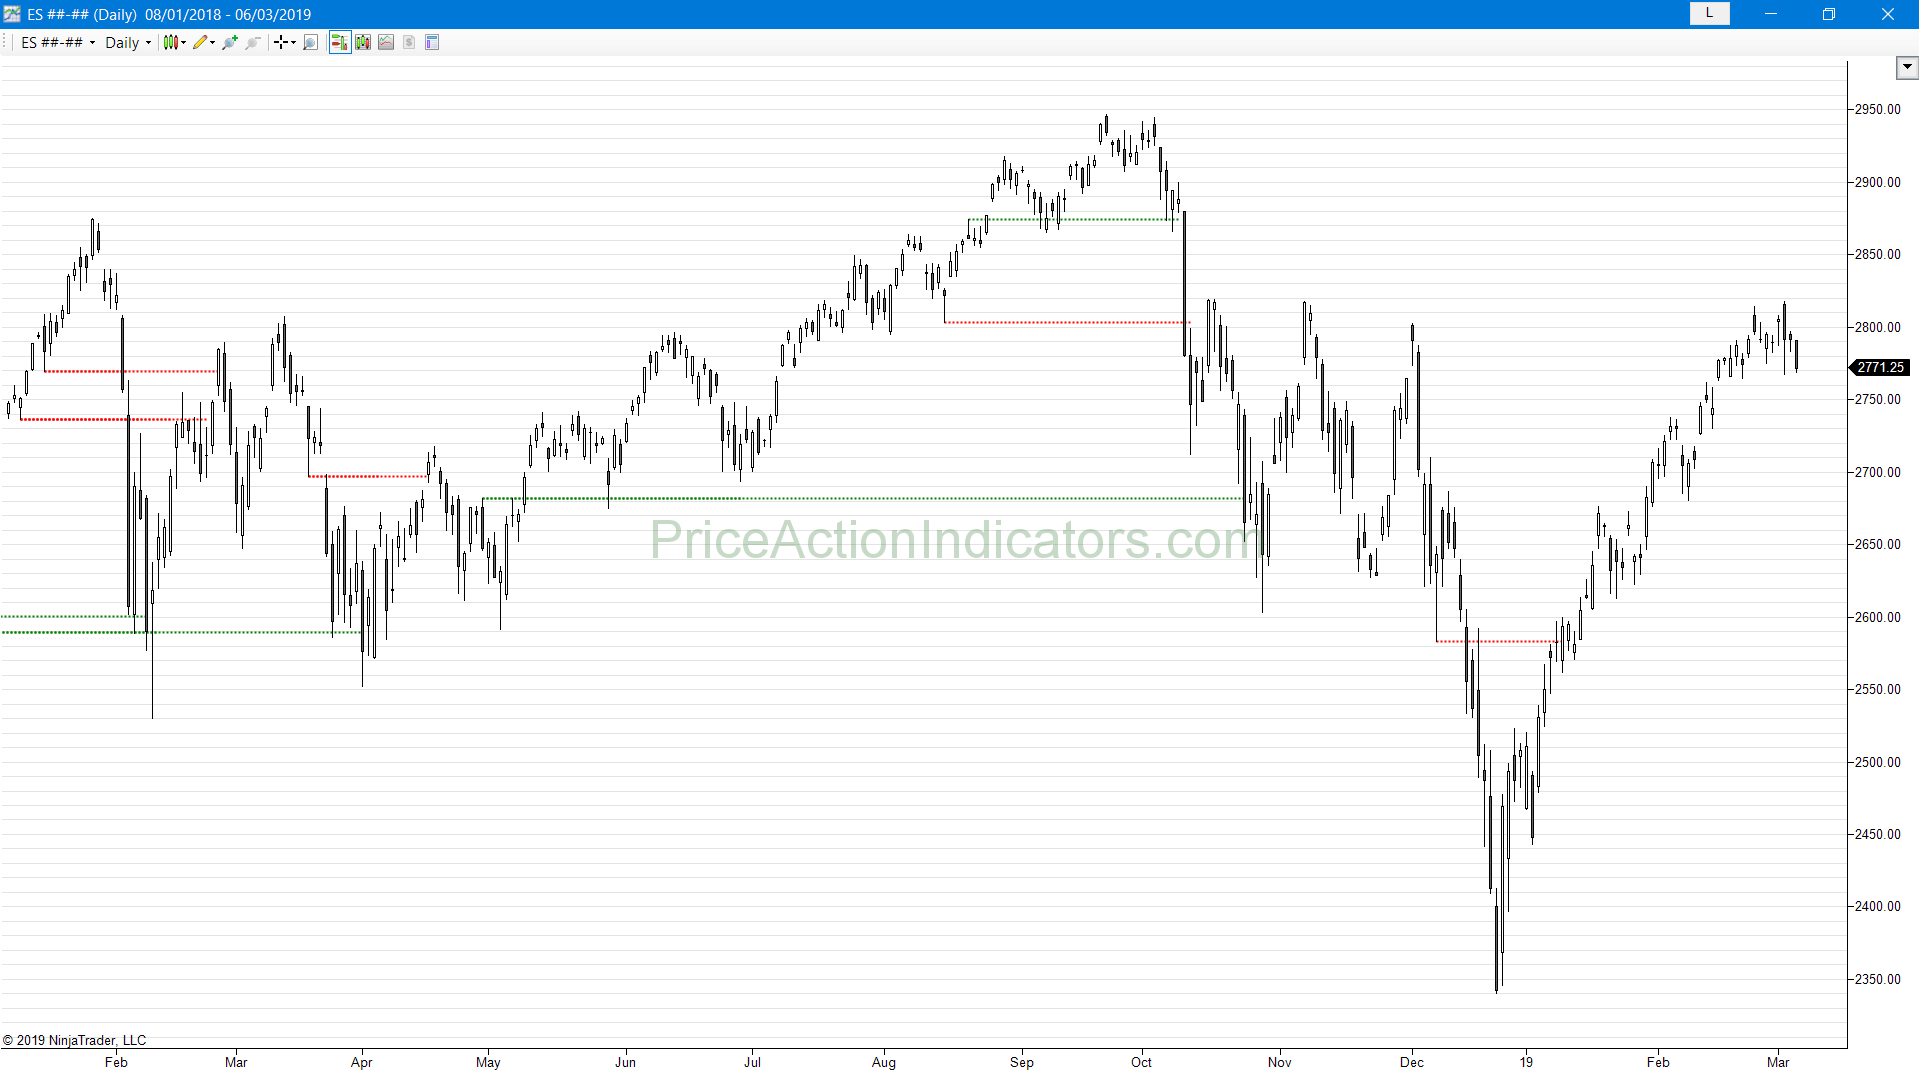
Example Charts

Example Video
Video-Link: https://youtu.be/pQd3fZYY9Lw
Download a 20 day trial version
Buy now for US $ 180
you get redirected to our reseller MyCommerce/Digital River/Share-it to place your order
to order you need your NinjaTrader® Machine ID (please see FAQ)
for license activation (please see FAQ)
Please contact us for a discount if you’re going to buy more than one indicator.
What is Support and Resistance?
Support and resistance are important levels where lots of buyers and sellers are willing to trade a security. It is probably the most popular price action concept used by price action traders. If these levels are broken, market psychology shifts and new levels of support and resistance might get established. Although single lines look nice on a chart, levels need to be seen as zones.
Like Al Brooks is saying here “One of the most useful rules in trading is that if something resembles a reliable pattern, it will likely behave like the reliable pattern. In any case, nothing is ever perfect or certain, so close is usually close enough.”
A support level is a level price tends to bounce off, find support as it falls. A resistance level is a level price tends to find resistance as it rises. If price breaks through a support and resistance level it is likely to continue until approaching another support or resistance level.
Every swing point can be considered a potential support or resistance level, although major swing highs and lows hold more significance, as they are visible to higher time frame traders too. Trend lines, trend channel lines and moving averages can be support and resistance too (usually very subjective, because of all the variants one can draw them).
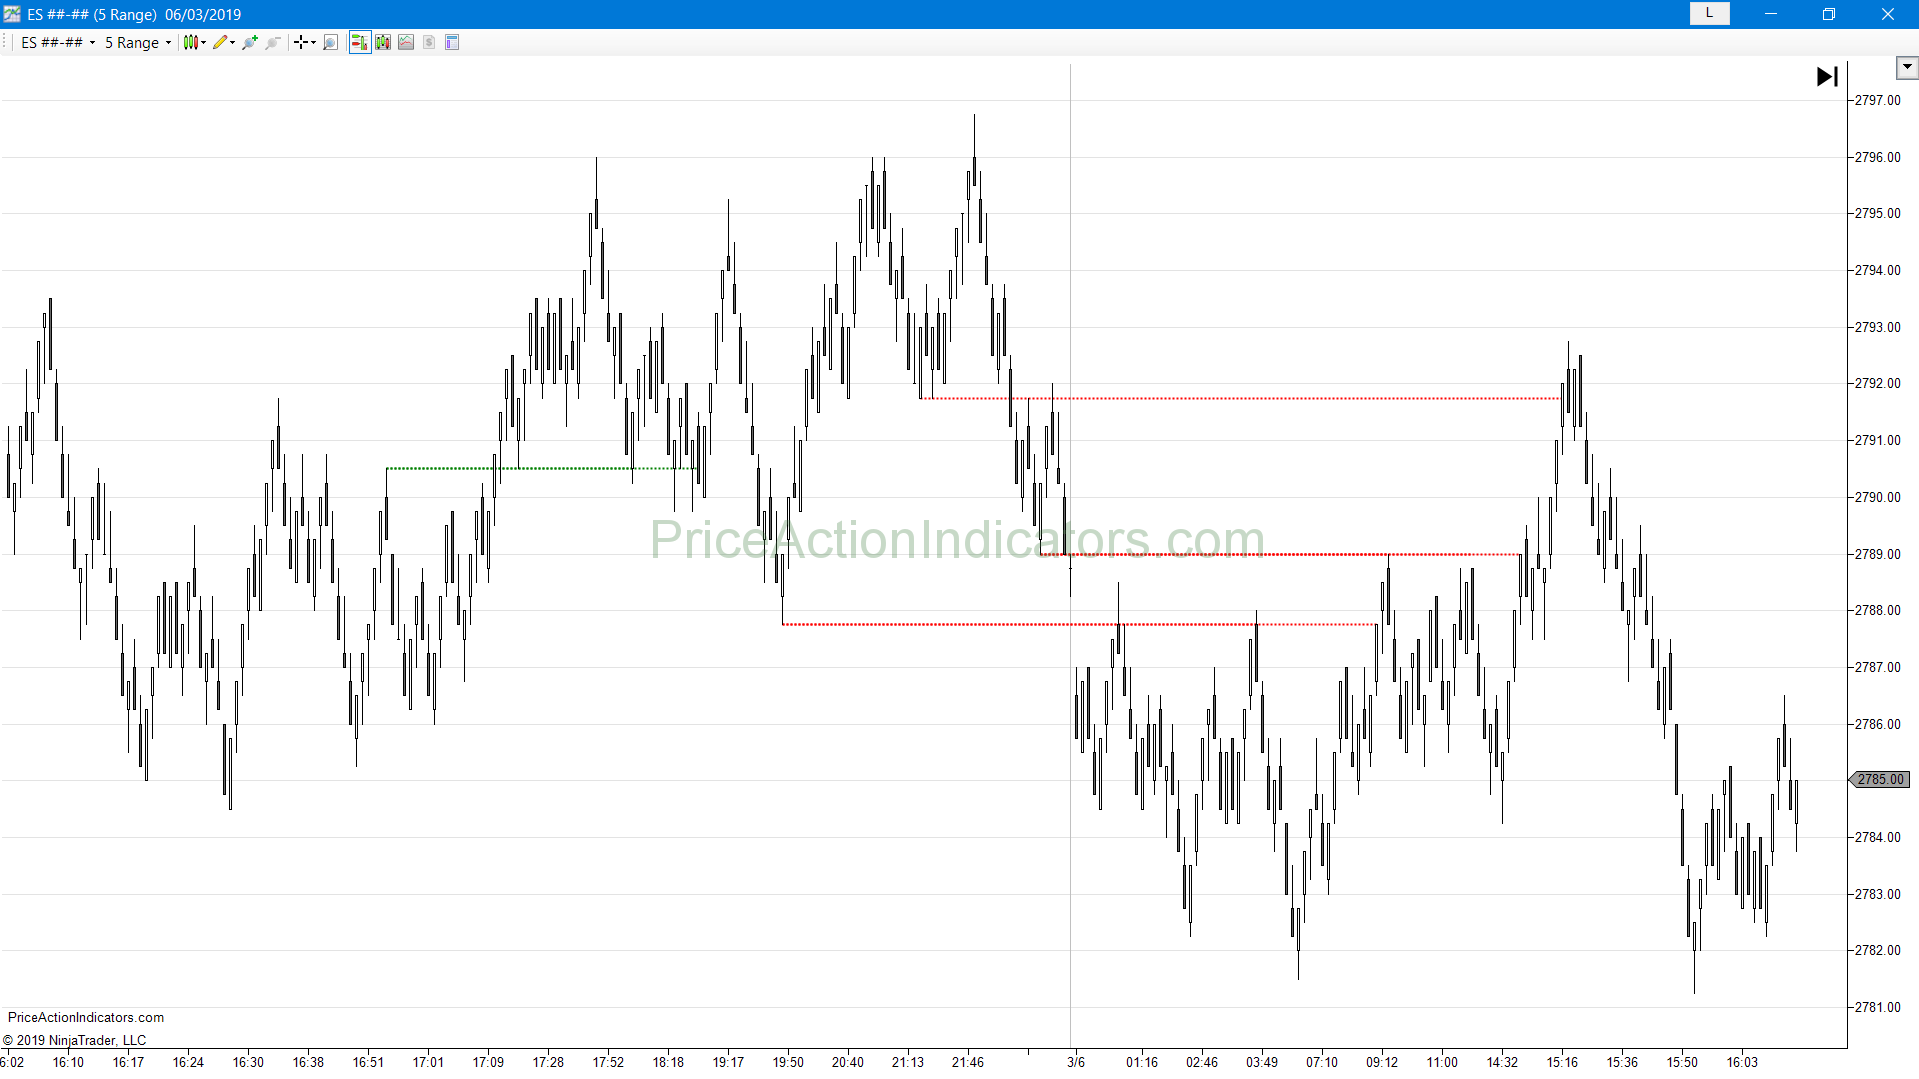
Role Reversal
A broken support level often becomes a new resistance level. The opposite is true; a broken resistance level often becomes a new support level.
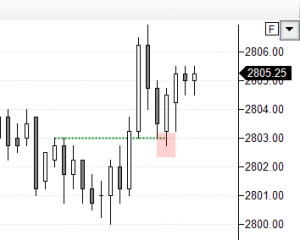
Consider the below example for a broken support level.
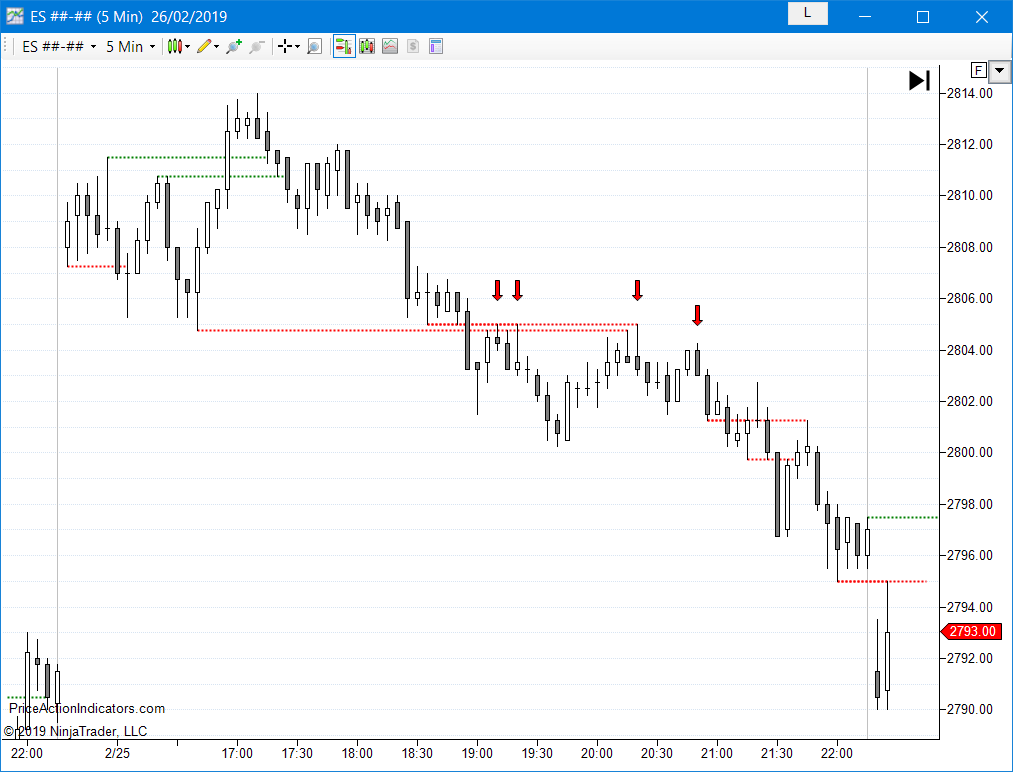
Possible Breakout Test Signal Bars (arrows drawn by hand)
The market trades back to the support level (here the low of the day). Some traders start buying, when price gets close to it and also scale-in below, in case of a failed breakout.
Despite the buying, price declines further and breaks out of the support level by a significant amount. Traders who bought at the support level and might have scaled in below to lower their average entry price, realize that they might be on the wrong side of the market and place sell orders near or at the broken support level. Early breakout traders might have been able to scalp out parts of their position and are eager to sell more as price pulls back to the former breakout point. This profit taking by early breakout traders and buying by scale in buyers creates a pull-back in the opposite direction of the breakout (the Breakout Test).
After a test of the former breakout level (the broken support) price then continues in the direction of the breakout fueled by the orders of traders, who were on the wrong side of the market and the breakout traders.
Breakout Test, Breakout Pullback
A successful breakout, that extends further in the breakout direction than a possible failed breakout, often retraces in a pull-back against the direction of the breakout. Some traders believe, that a successful Breakout Test will not pull-back past the earlier point of breakout. But, this often depends on the size of the breakout and context (trading range, trend and strength of the trend e.g. spike or a channel).
Can I simply trade every signal?
- this largely depends on context, trading style and stop loss (risk), also on your ability to scale in and the use of wide or swing stops (below the last higher low or above the last lower high in a trend)
- to increase the probability of a successful trade you can wait for a strong Reversal Signal Bar after a couple of pushes at a broken support or resistance level and trade the Breakout Test with a stop entry
- in a pullback in a trend it’s reasonable to buy/sell closes (exhaustion) near broken support or resistance levels to enter with trend
- look for confluence with signals from other indicators, e.g. Buying/Selling Pressure, Tick Failures (see below)
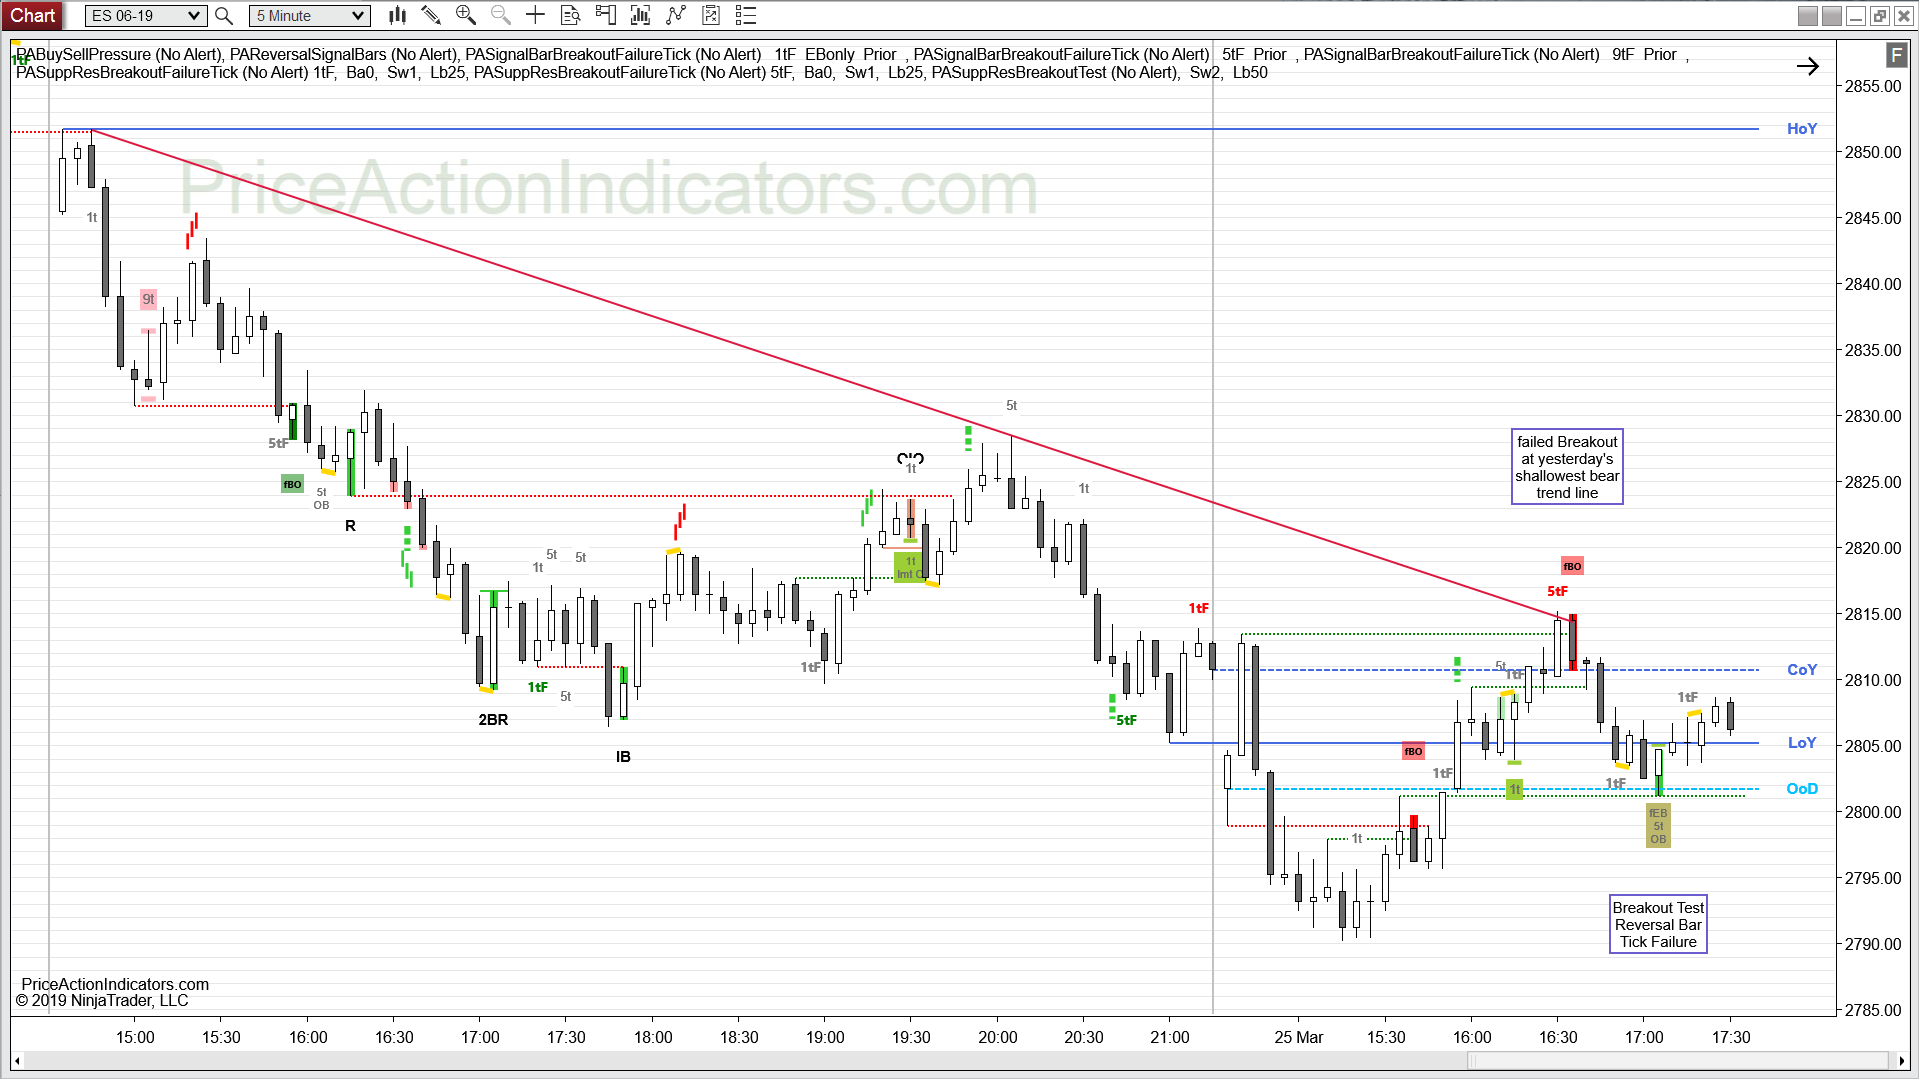
Examples from the Blog
Here are a couple of the latest blog posts, that highlight the signals of the S/R Breakout Test indicator in context.
Read more here: More Charts
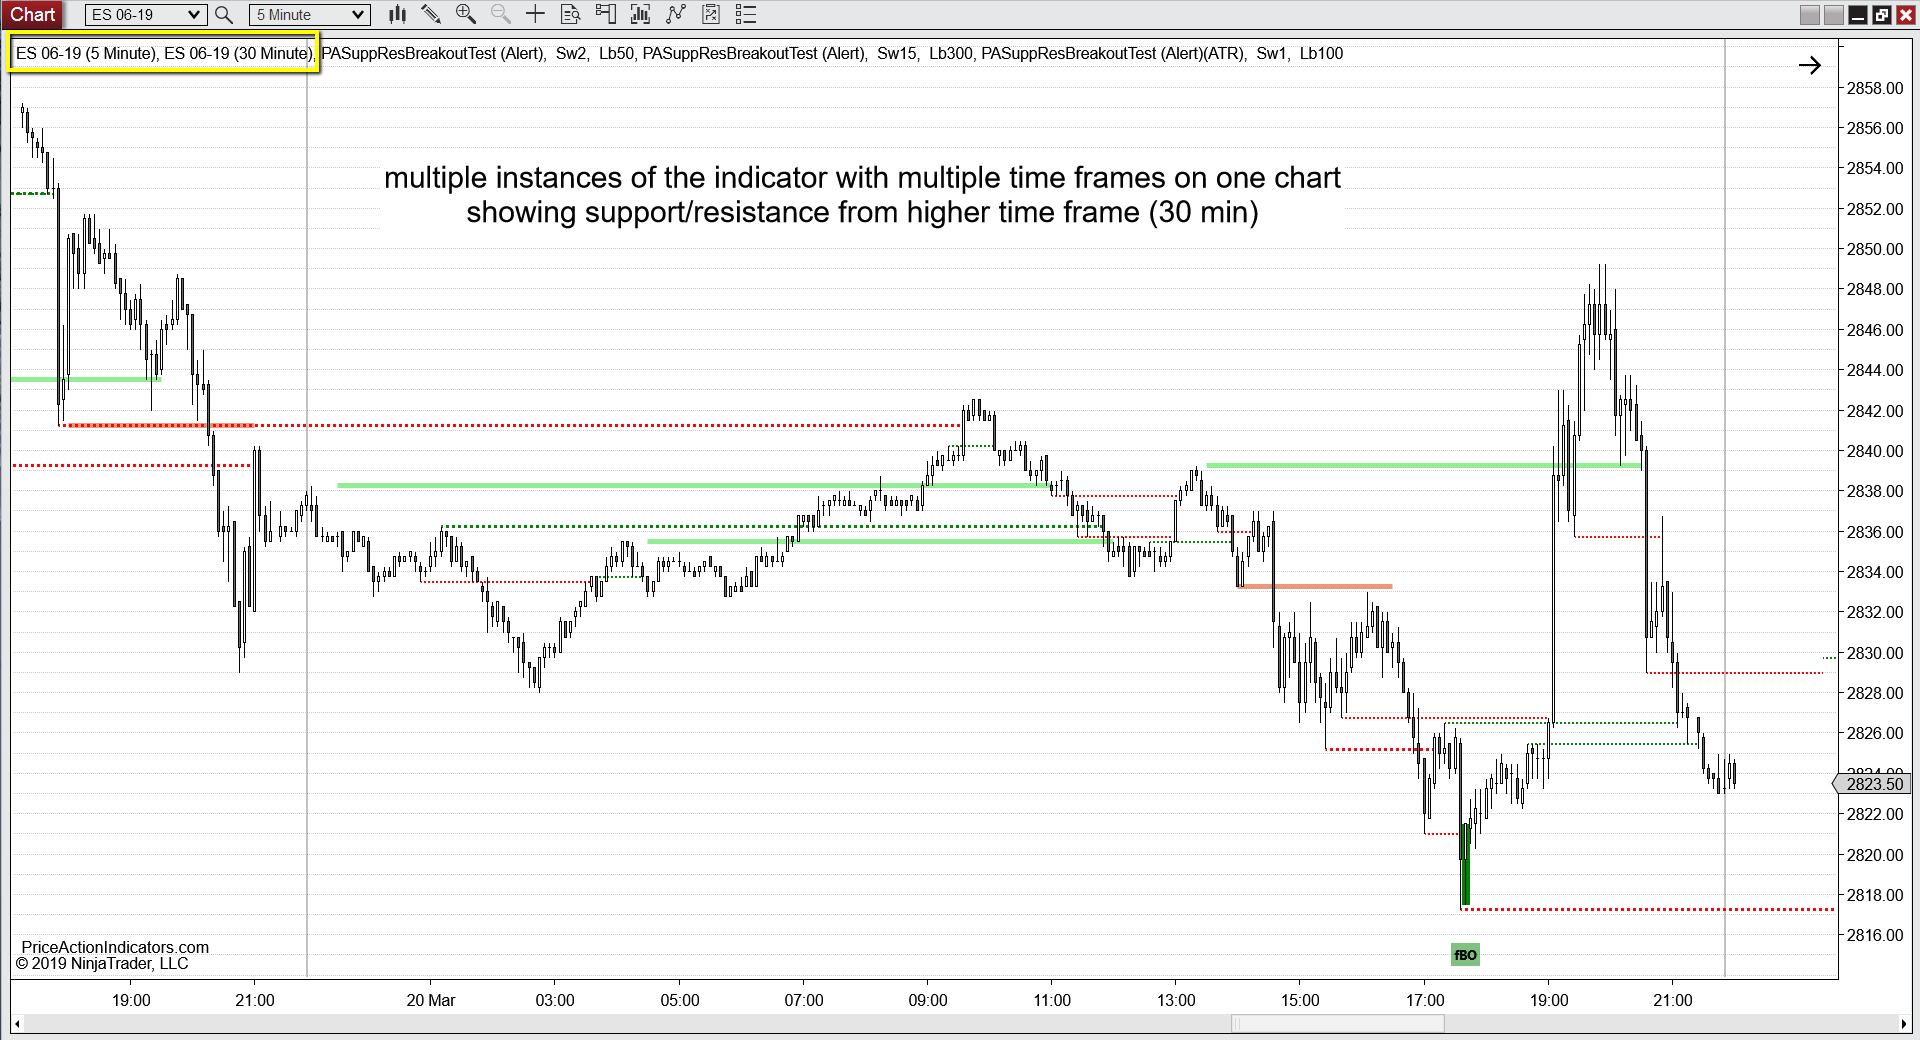
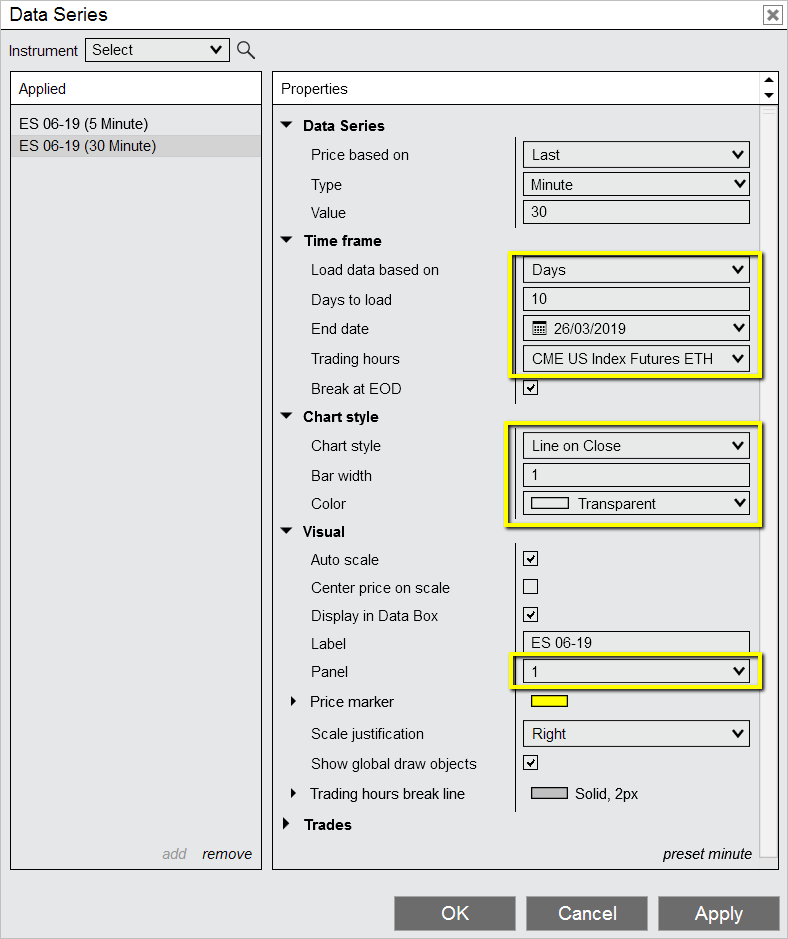
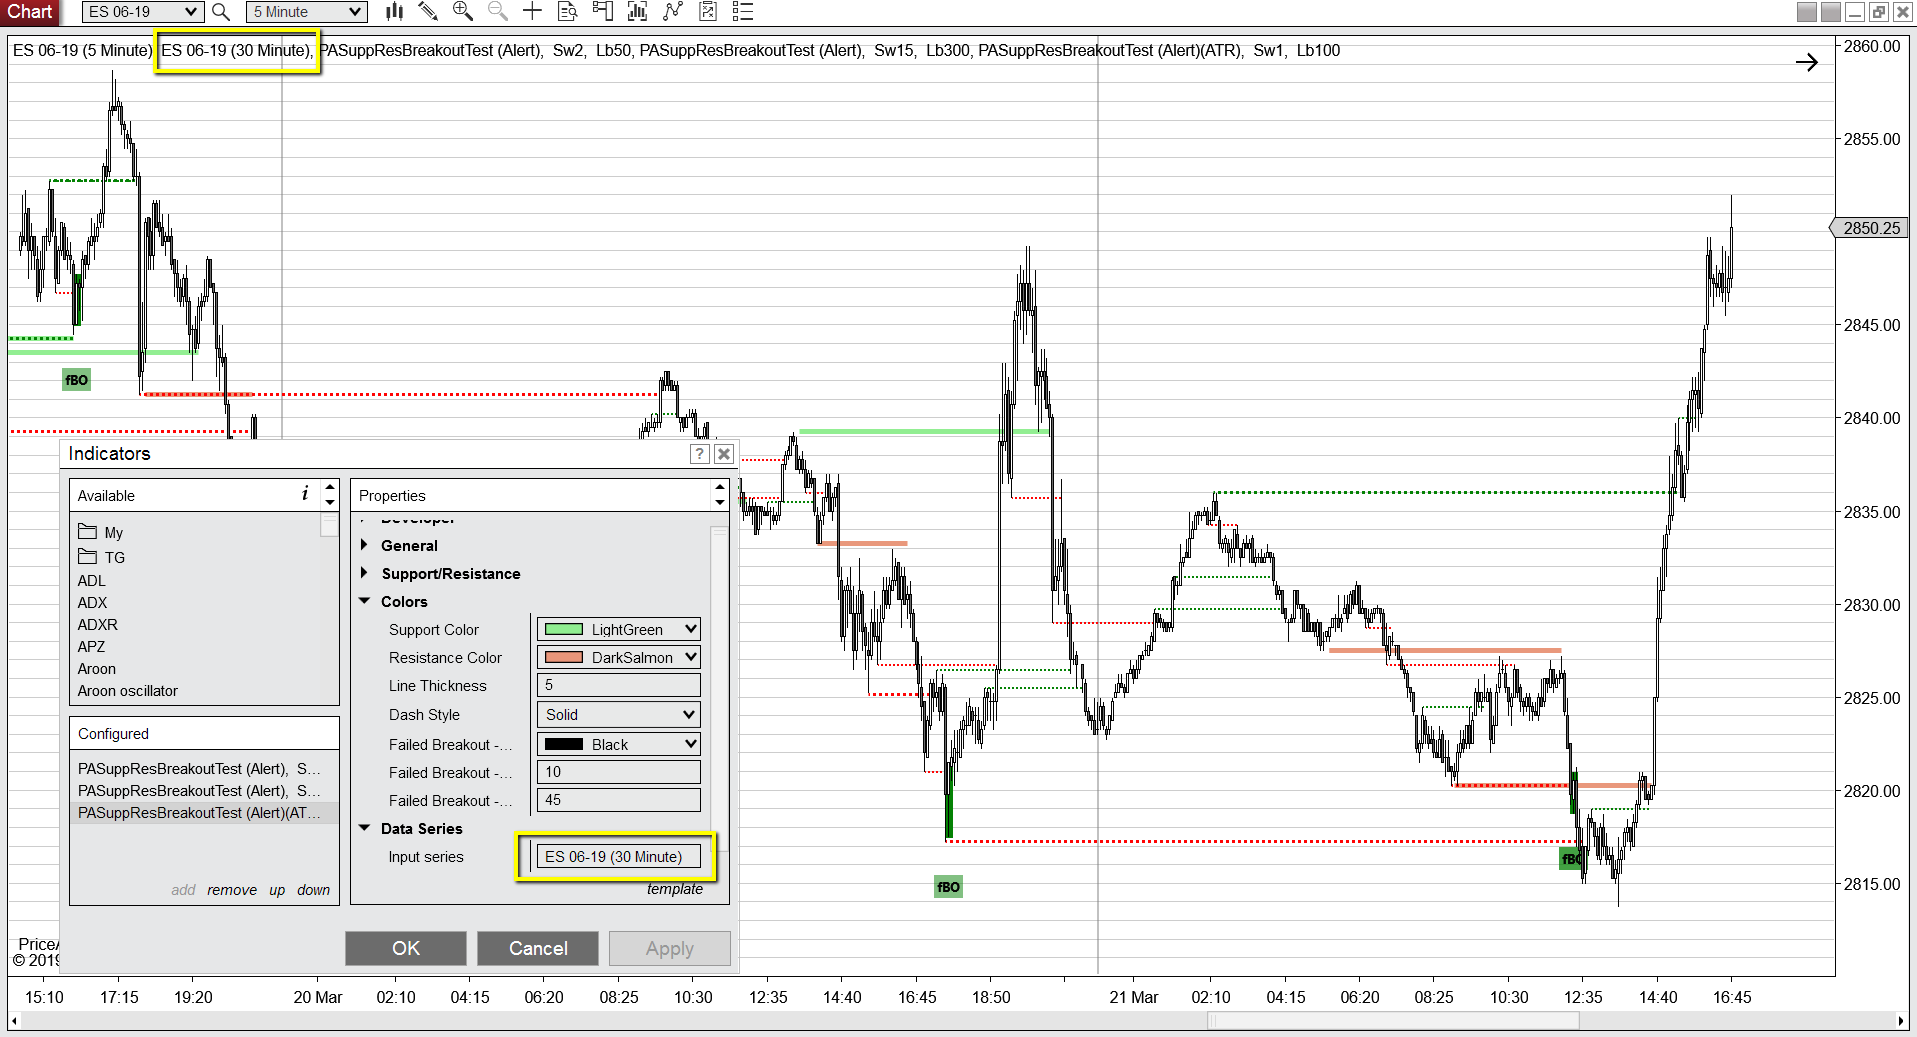
Multiple instances of the indicator with multiple time frames on one chart
If you want to limit the number of charts to look at you can setup a chart with multiple time frames (e.g. a higher time frame) on one panel. The higher time frame data series will be overlaid and transparent.
To use the support and resistance of the 30 min time frame on a 5 min chart you need to add a 2nd data series to that 5 min chart and set the chart style to “Line on Close” and the color to “Transparent”. The “Days to load”, “Trading hours” and “Panel” should match the 1st data series.
Then use the 30 min data series as the “Input series” for the Breakout Test indicator. Make sure to use another line style and thickness of the support/resistance lines to distinguish them from the 5 min lines.
Failed Breakout (Beta)
Some traders consider a counter trend bar after the breakout bar a failed breakout. The indicator tries to show those by coloring the background of that counter trend bar (the signal bar). This is no investment advice, the investor is solely responsible for the choice of the indicator signals or entry method. Please read our Disclaimer.
What are the settings?
Indicator name: PASuppResBreakoutTest

Show Last 200 Bars only
Show the indicator signals only for the last 200 bars, which will speed up a reload of the chart or indicator
Sound Alert
Play a sound and show an alert in the alert window
Sound Alert Percent
Sound Alert, when Bar is to (Percent) complete (does not work for Range, Kagi or LineBreak)
leave Rearm Seconds 0 (zero), if using on a Range, Kagi or LineBreak chart
Sound Alert Rearm Seconds
Rearm Sound Alert after (Rearm Seconds)
if not using Sound Alert Percent or for Range, Kagi or LineBreak
Sound Alert File
Pick a .WAV file from the NinjaTrader sound folder (how to install sounds, see here )
Swing Strength
Show Breakout Test lines only for swings with a certain swing strength
e.g. 1 = one bar with a lower high to the left and right of a swing high
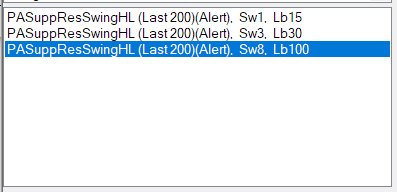
use one or more instances of the indicator to show support/resistance levels of a certain strength a certain number of bars back only
Positive Tolerance and Negative Tolerance

Positive and Negative Tolerance is set in ticks
a gap between the broken support or resistance level and price is considered a Positive Tolerance, an overlap is considered Negative Tolerance
in “ATR_Tolerance” mode these are a multipliers, please see below
Minimum Breakout
Minimum Breakout is set in ticks
Set the minimum breakout of a support or resistance level, before it can reverse it’s role (before it is considered broken) here.
The larger the breakout of a support or resistance level, the higher is the probability, that enough traders consider it to be broken and traders who earlier faded the breakout try to get out of their positions near the support or resistance level. A successful scalp can be a good number for that, like two points in the ES e-mini.
in “ATR_Tolerance” mode this is a multiplier, please see below
ATR_Tolerance
Use “ATR_Tolerance” mode for Positive/Negative Tolerance and Minimum Breakout instead of ticks.
With this mode, the ATR(10) is divided by the ATR_Divisor and then multiplied by the values set for Positive, Negative Tolerance and Minimum Breakout.
Example: ATR_Divisor = 10
Positive Tolerance = 1
Negative Tolerance = 2
Minimum Breakout = 6
ATR(10) = 3 points (calculated from the last 10 bars)
Positive Tolerance = 1/10 * 3 points = 0.3 points
Negative Tolerance = 2/10 * 3 points = 0.6 points
Minimum Breakout = 6/10 * 3 points = 1.8 points
ATR_Divisor
The ATR(10) is divided by the ATR_Divisor (higher values give smaller tolerance) and then multiplied by the values set for Positive, Negative Tolerance and Minimum Breakout
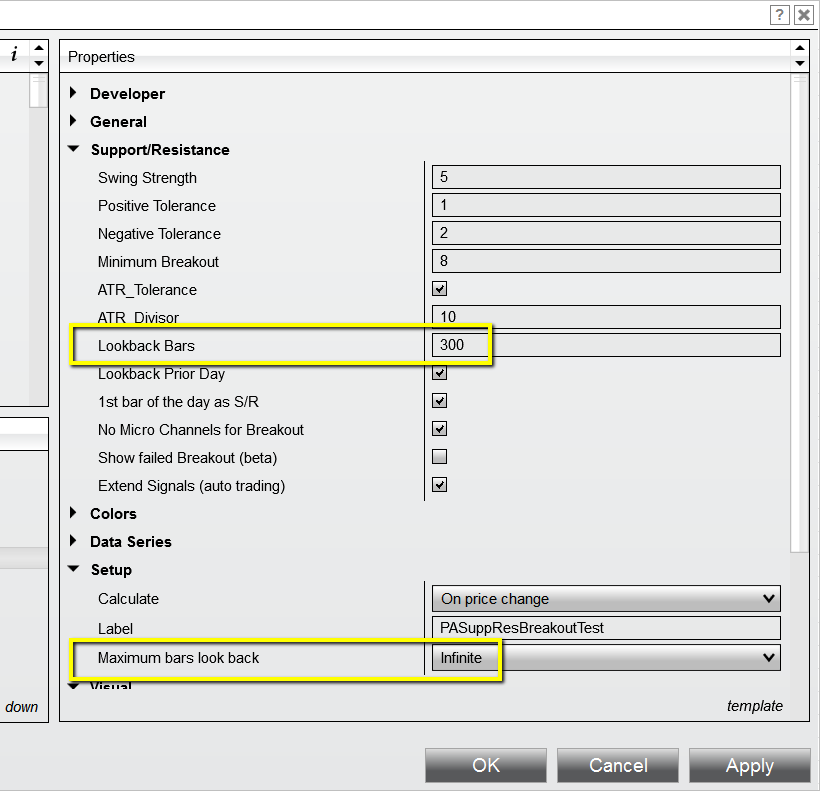
Lookback Bars
Number of bars back to look for a swing high or low
If you want to use a Lookback larger than 256, set “Maximum bars look back” to “Infinite” in the Setup of the indicator.
Look back Prior Day
Show support or resistance from the prior session
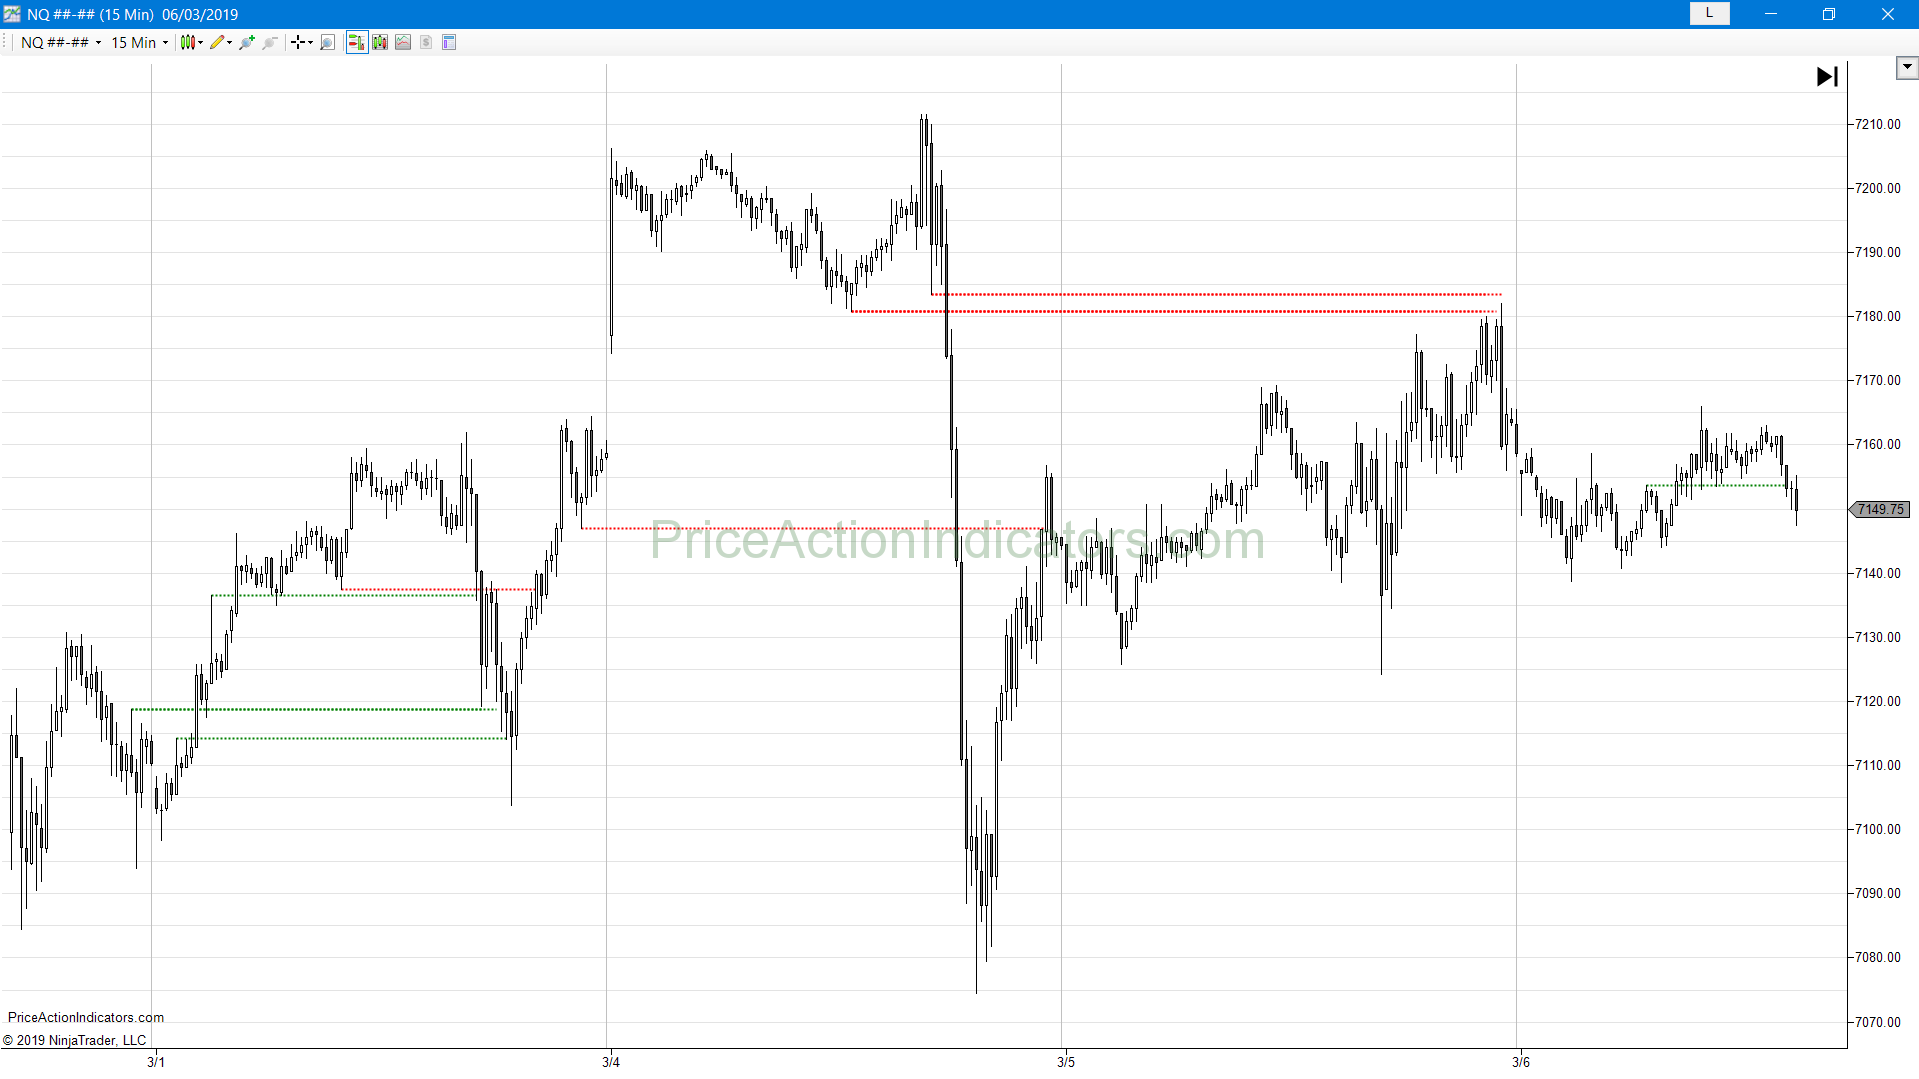
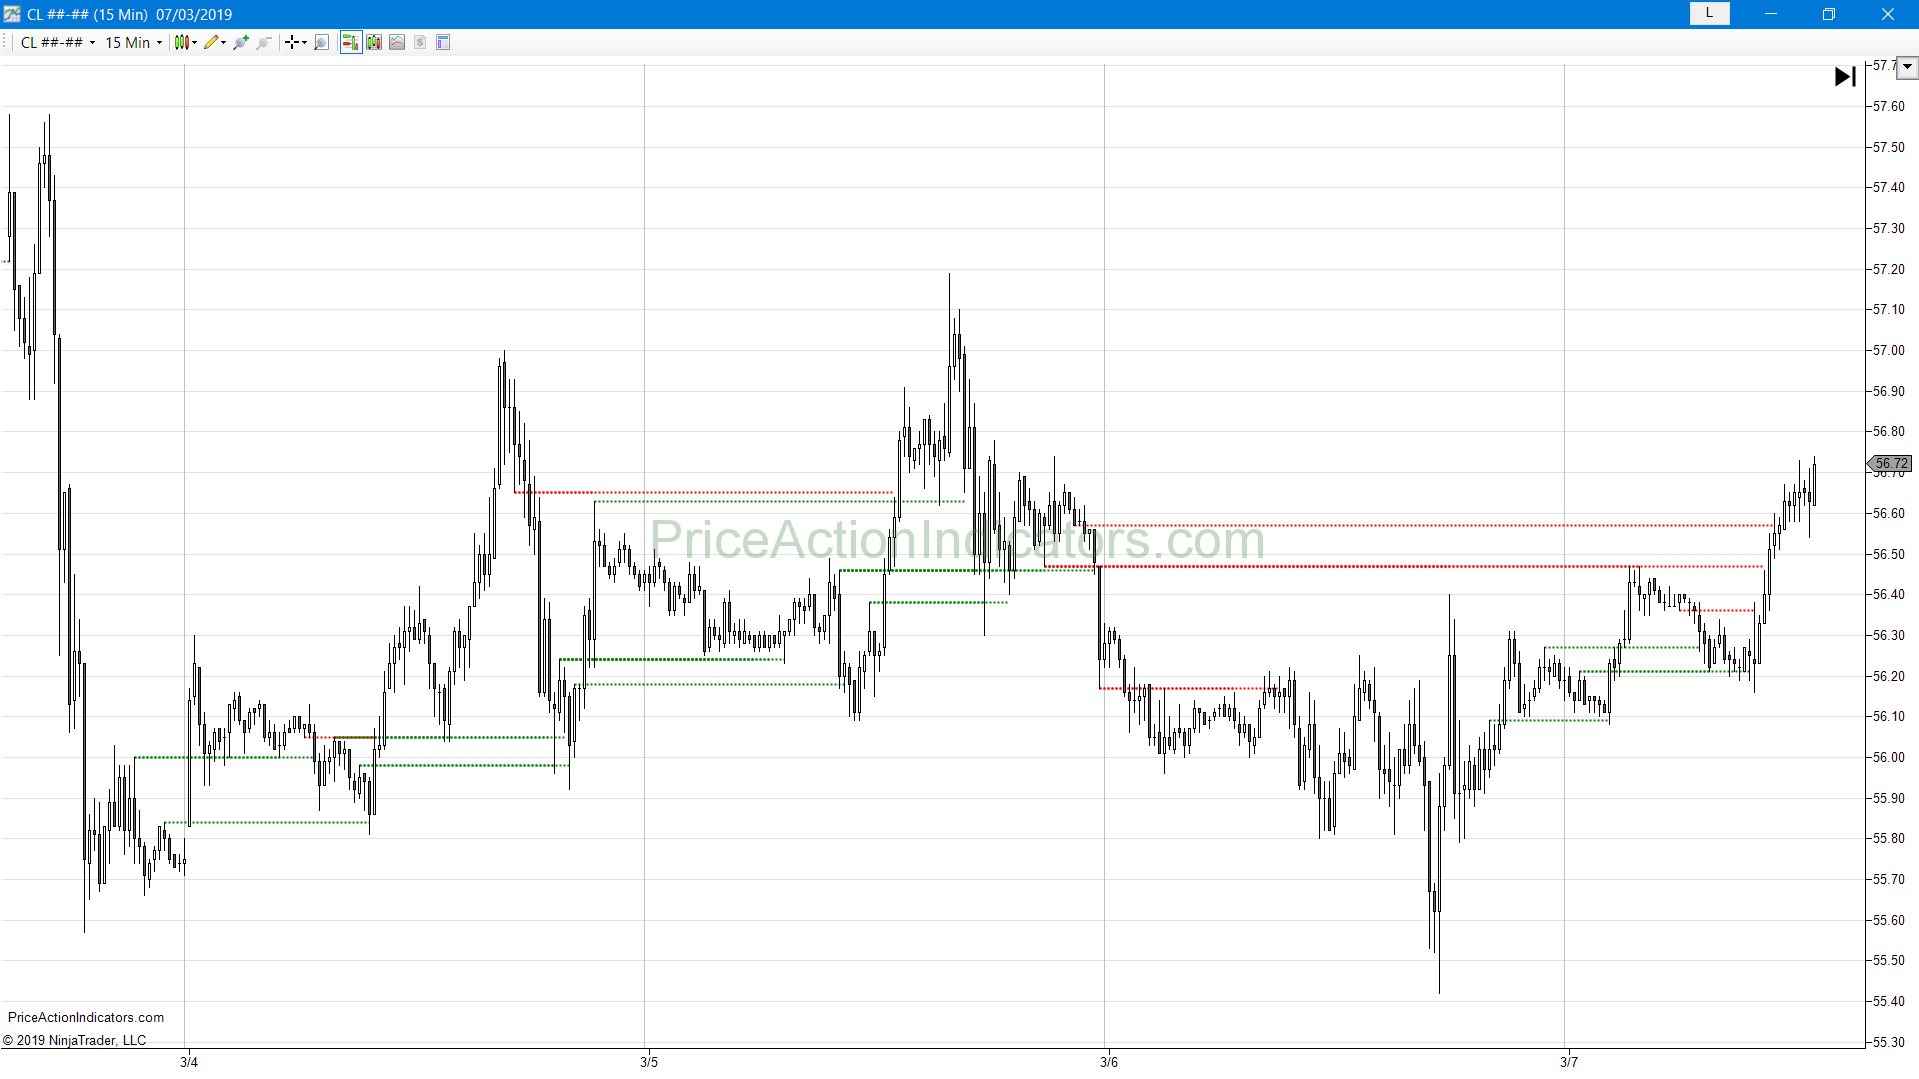
No Micro Channels for Breakout
A micro channel is a weak kind of breakout, where the 1st bar of the breakout doesn’t have to close beyond the breakout point. The two charts below show how the setting works on a 5 min chart of the ES E-mini.


Show failed Breakout (beta)
Show possible failed Breakouts on the next bar after the breakout bar (beta)
Extend Signals (auto trading – NT8 only)
Use this setting, if using the indicator for automated trading (Bloodhound or your own indicators/strategies).
If switched on, the signal for the Breakout Test (in the data series) is extended to the next two bars after the pivot, depending on price.
Line Thickness
e.g. use thicker lines for higher strength support and resistance
DashStyle for Support and Resistance Lines
e.g. use different dash styles for higher strength support and resistance
back to Indicators