
Reversal Signal Bars
Indicator for NinjaTrader® 7/8
Features
- shows the following Signal Bars & Patterns
– Inside Bar
– Reversal Bar (also called Pin Bar)
– Inside Inside Pattern
– Inside/Outside/Inside Pattern
– Outside/Inside/Outside Pattern
– Two Bar Reversal
– Three Bar Reversal
– Outside/Outside Pattern
– Outside Bar
– Final Flag (impending reversal)
– Inside Bar Breakout Pullback
– Two Bar Breakout Pullback
– Entry Bar and Breakout Bar
– Inside Inside failed Breakout
– Inside Outside Inside Continuation
– Inside Inside Pullback
– Multi-Bar Reversal (NEW)
- “Barb Wire” (a special kind of a tight trading range)
- show entry and possible locations for a stop loss
- configure minimum Signal Bar/Pattern size and minimum Overshoot of prior bars
- configure bar size for 1st bar of session on a gap up/dn (for RTH traders, a large 1st bar of the day is often a trading range)
- use as a discretionary indicator and for Automated Trading with BloodHound
- use in NinjaTrader Market Analyzer
- alert feature
- does not work on HeikenAshi, Kagi, Renko, PointAndFigure and LineBreak charts
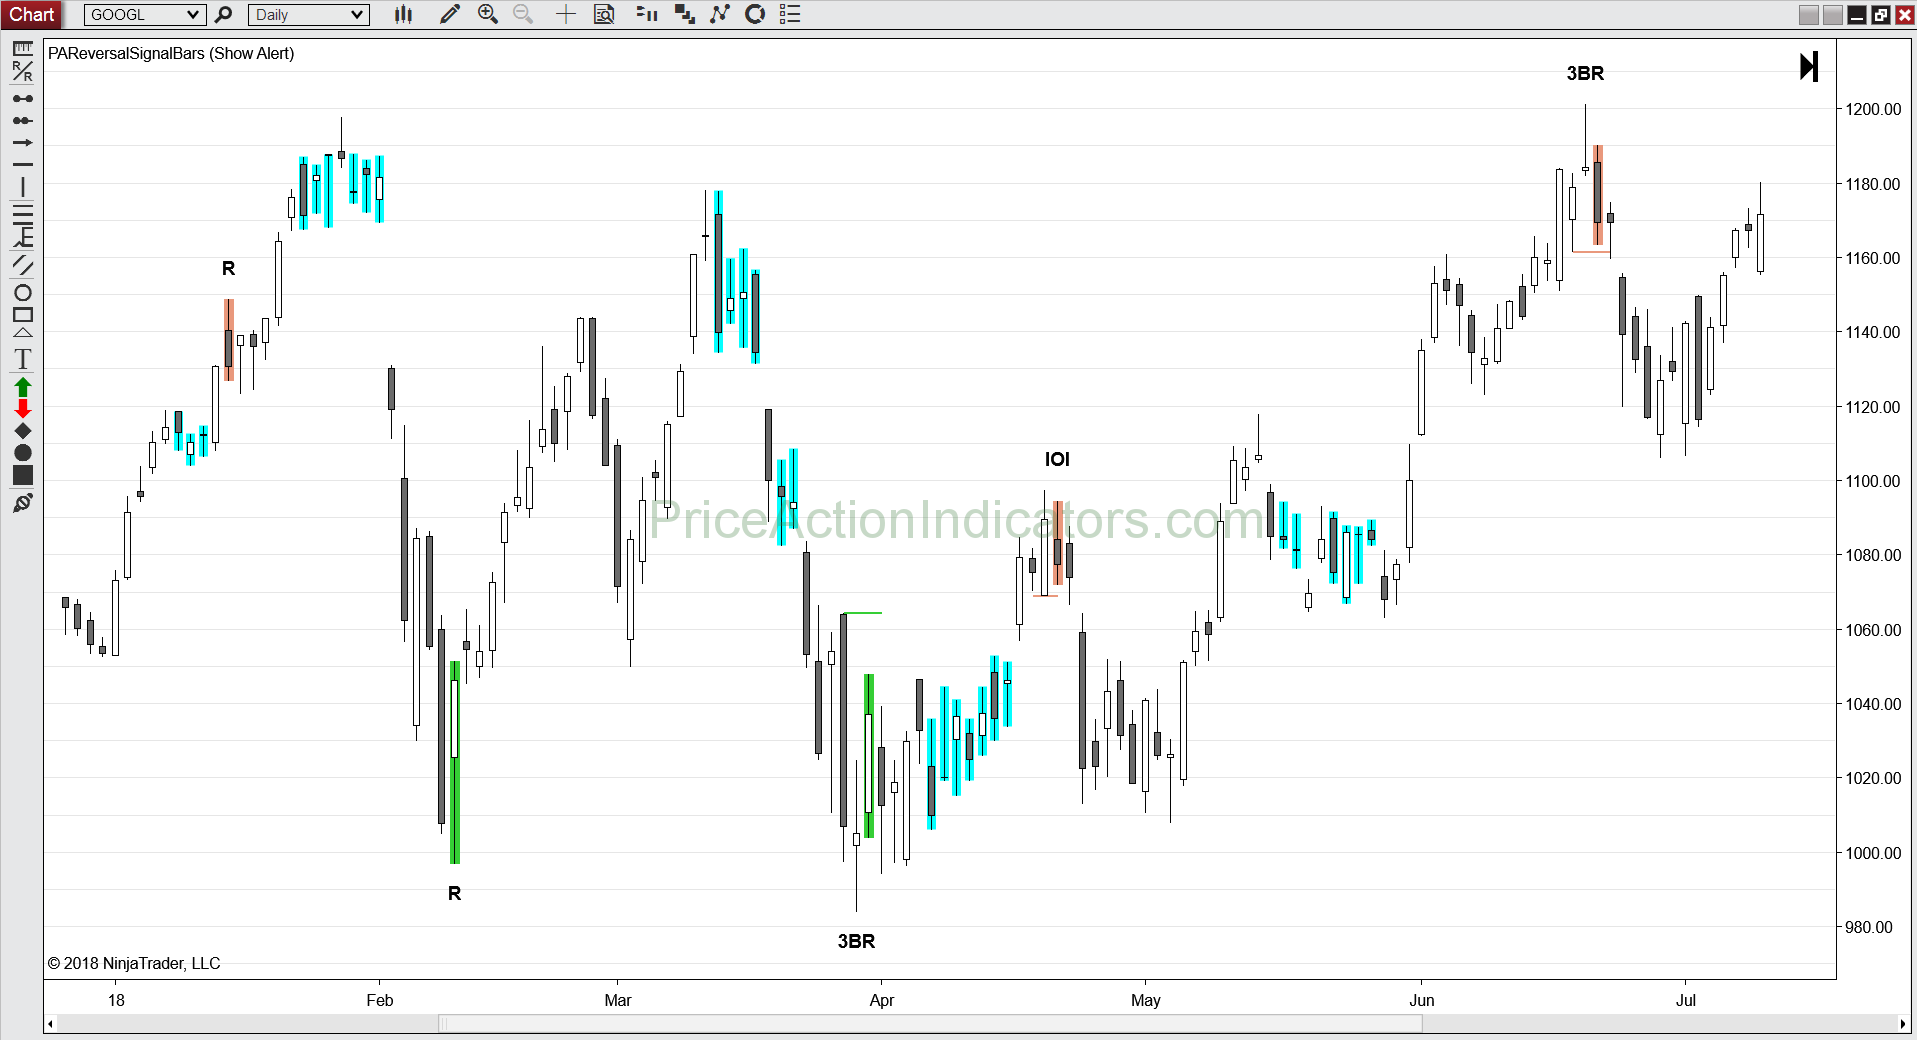
Example Charts


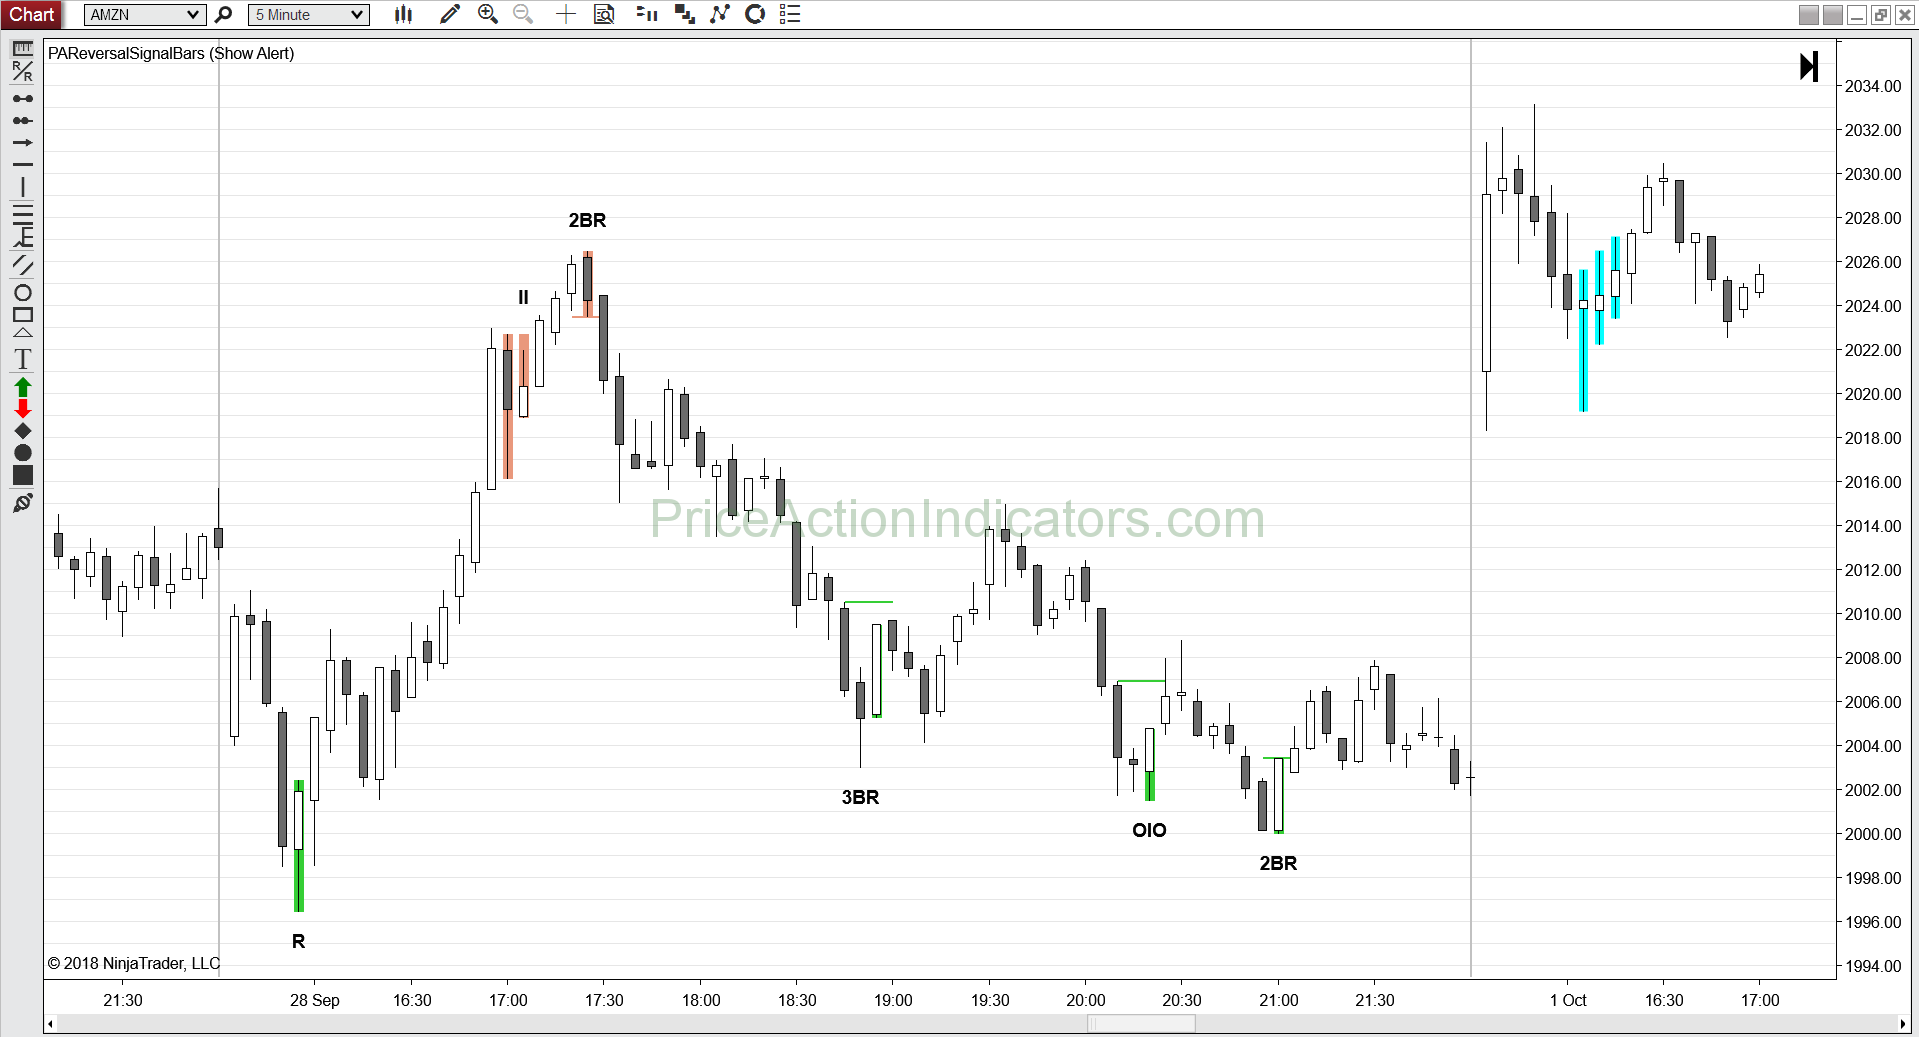
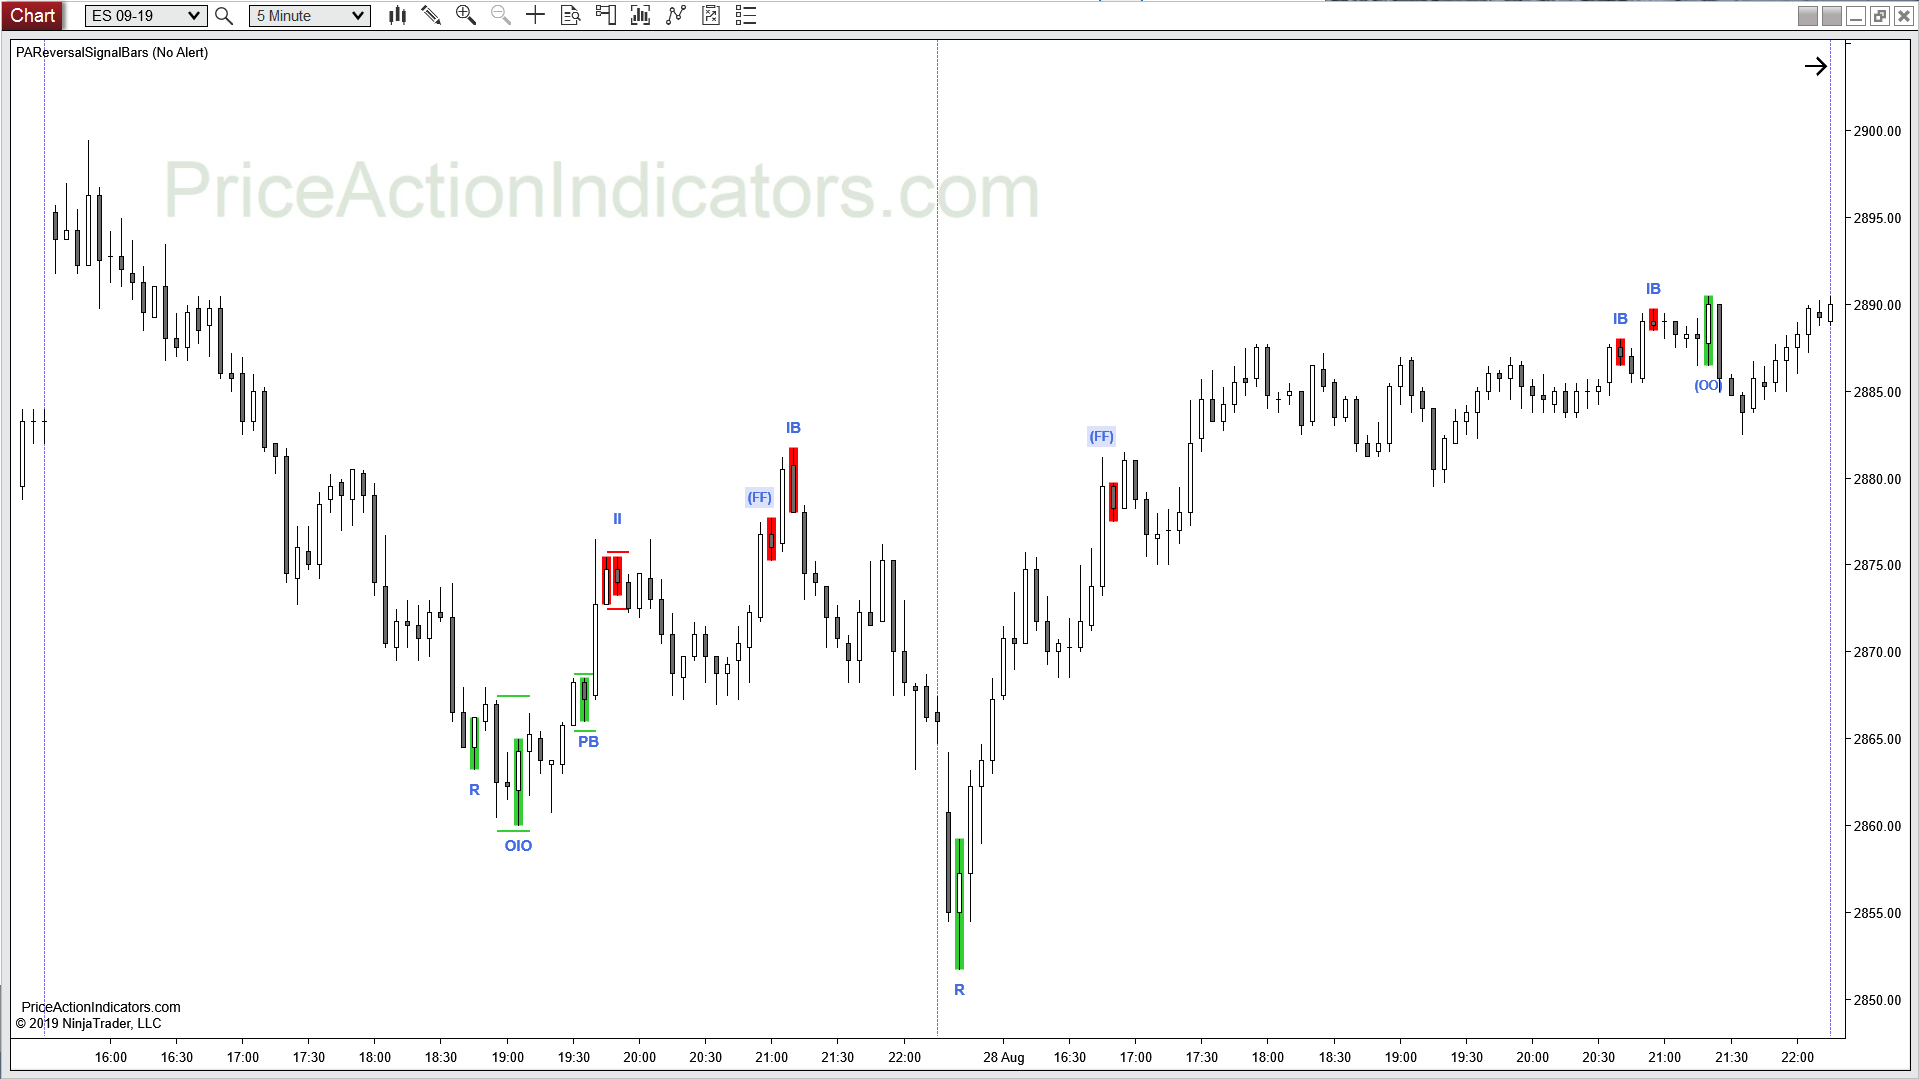
Recent E-mini ES 5 min RTH charts
Download a 20 day trial version
Buy now for US $ 230
you get redirected to our reseller MyCommerce/Digital River/Share-it to place your order
to order you need your NinjaTrader® Machine ID (please see FAQ)
for license activation (please see FAQ)
Please contact us for a discount if you’re going to buy more than one indicator.
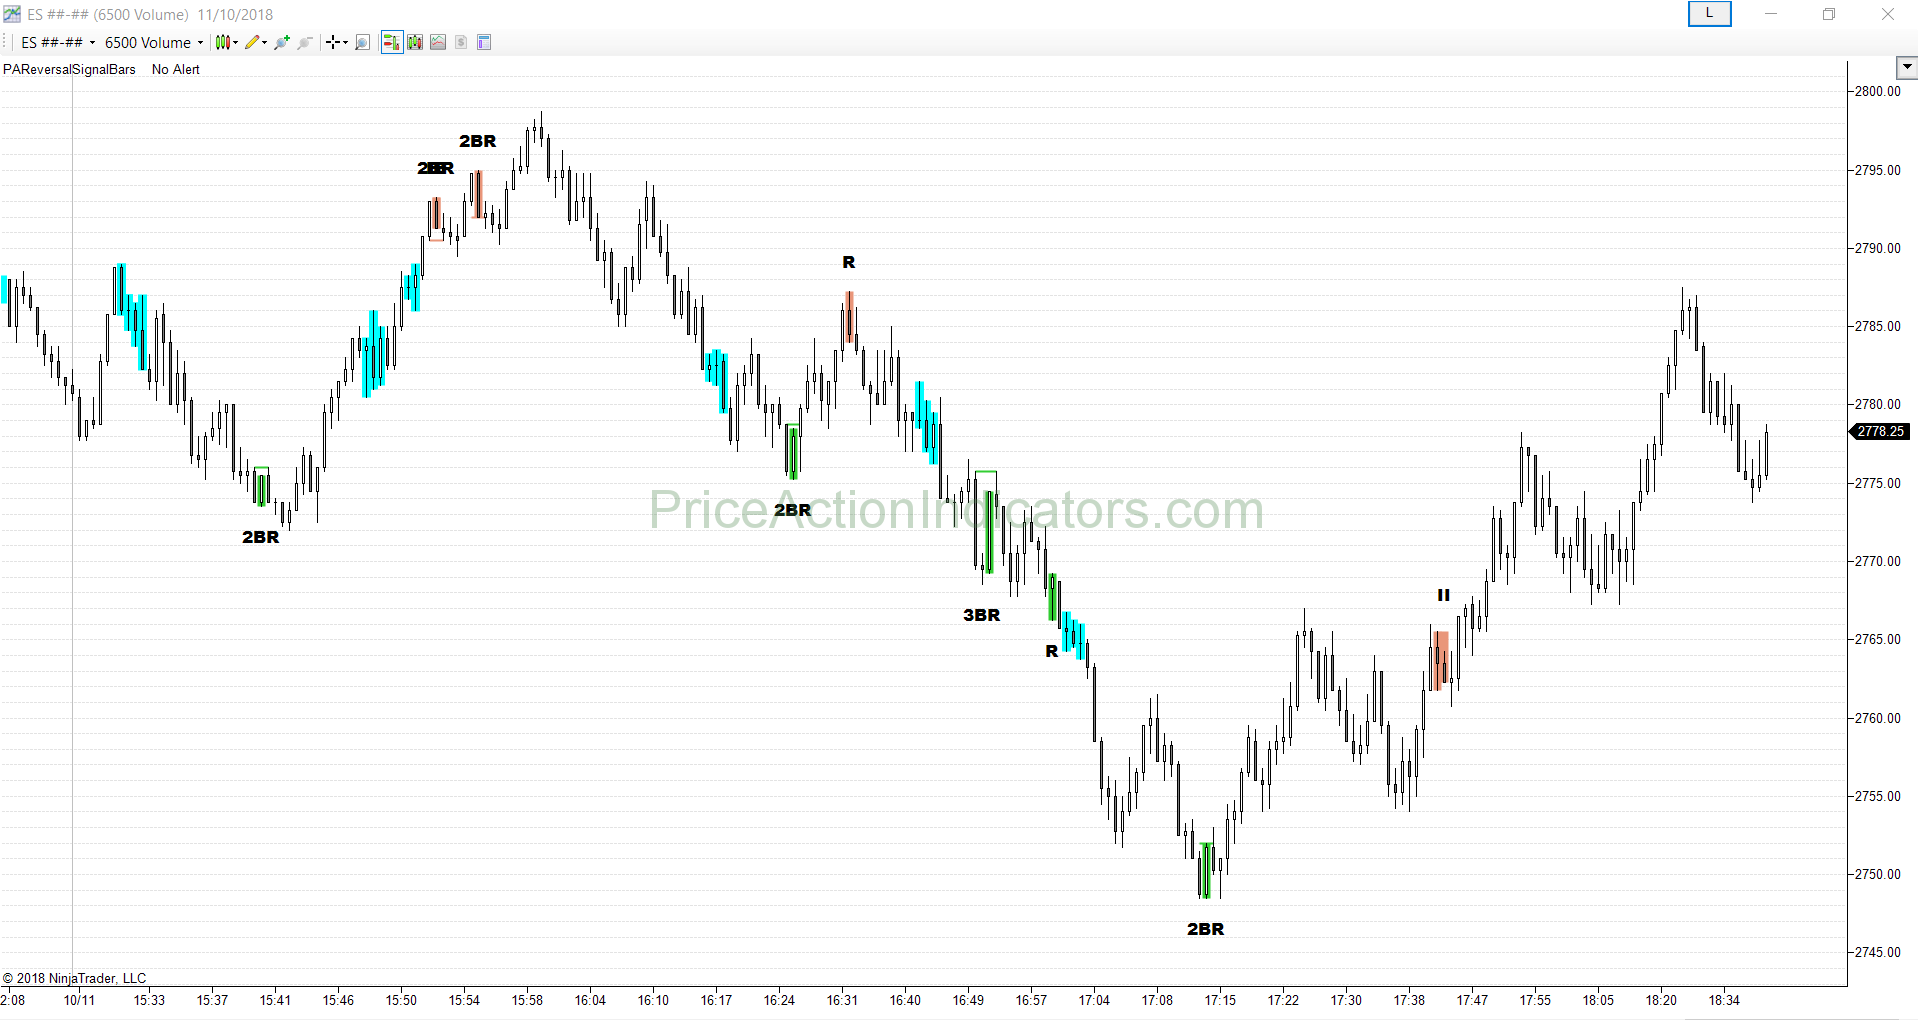
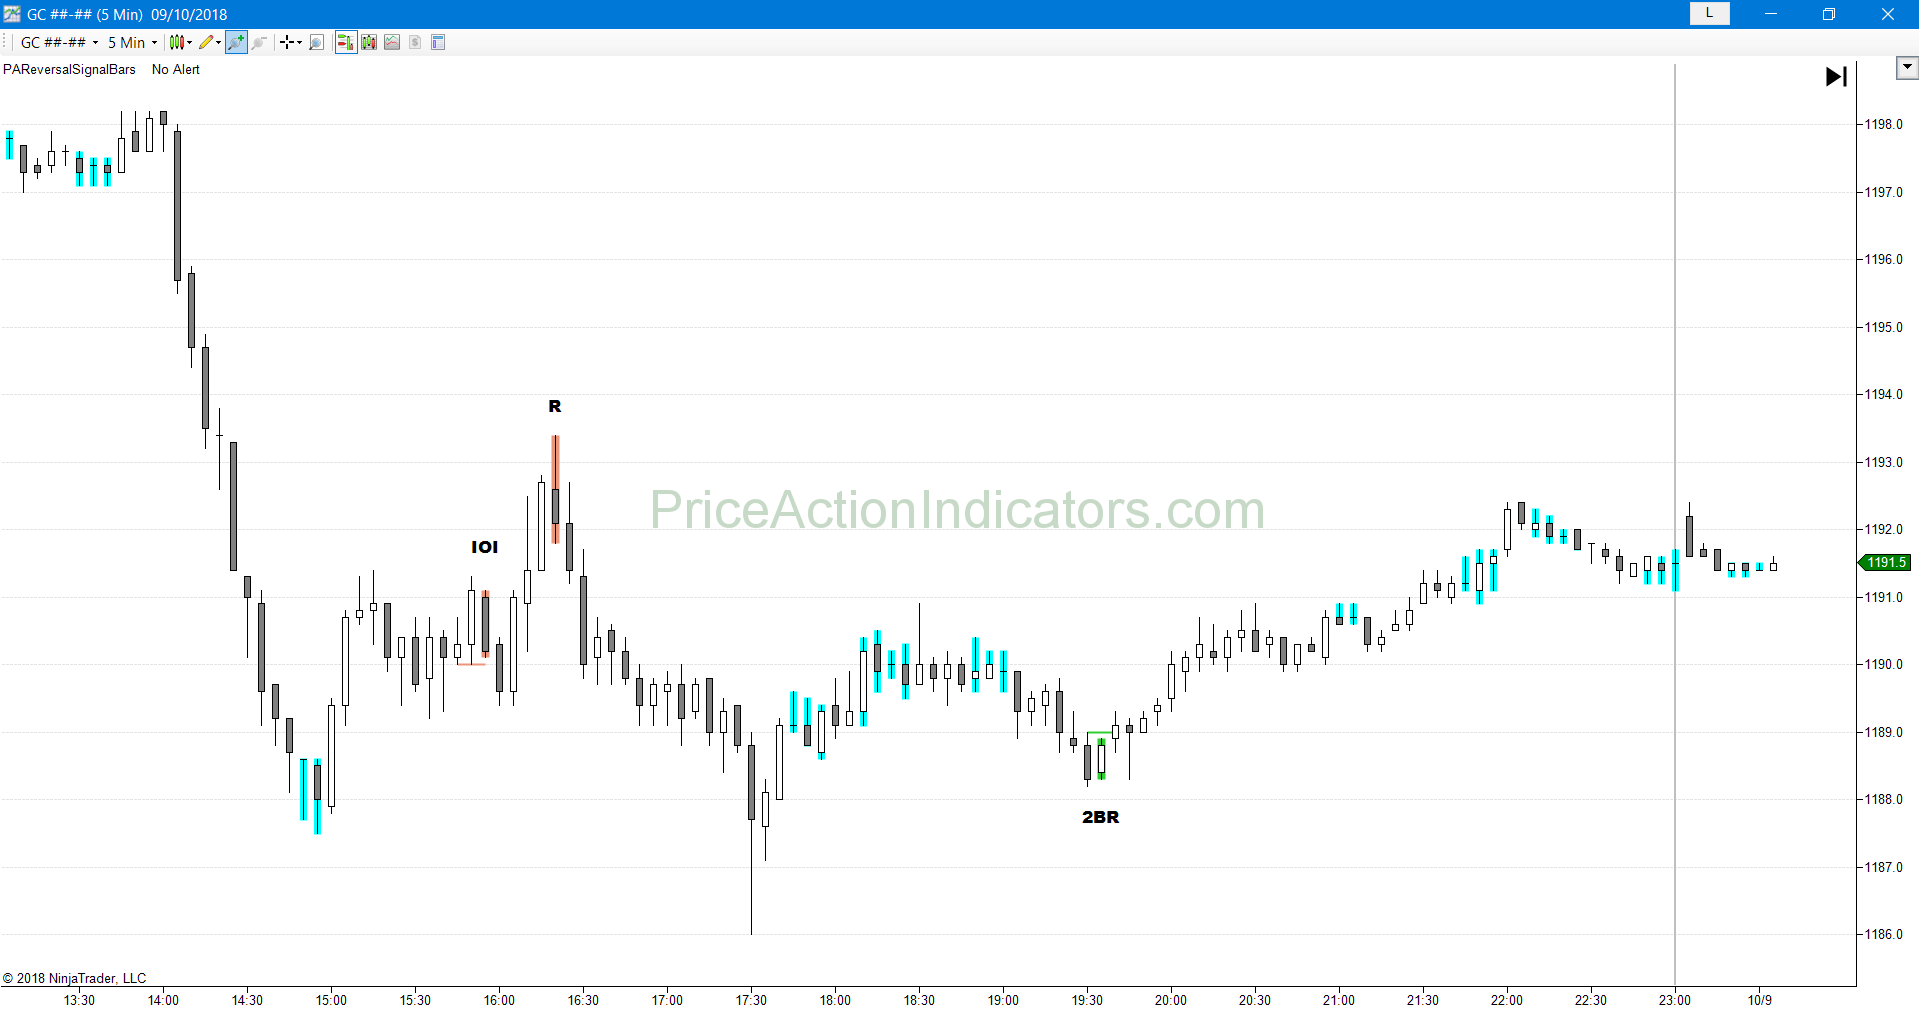
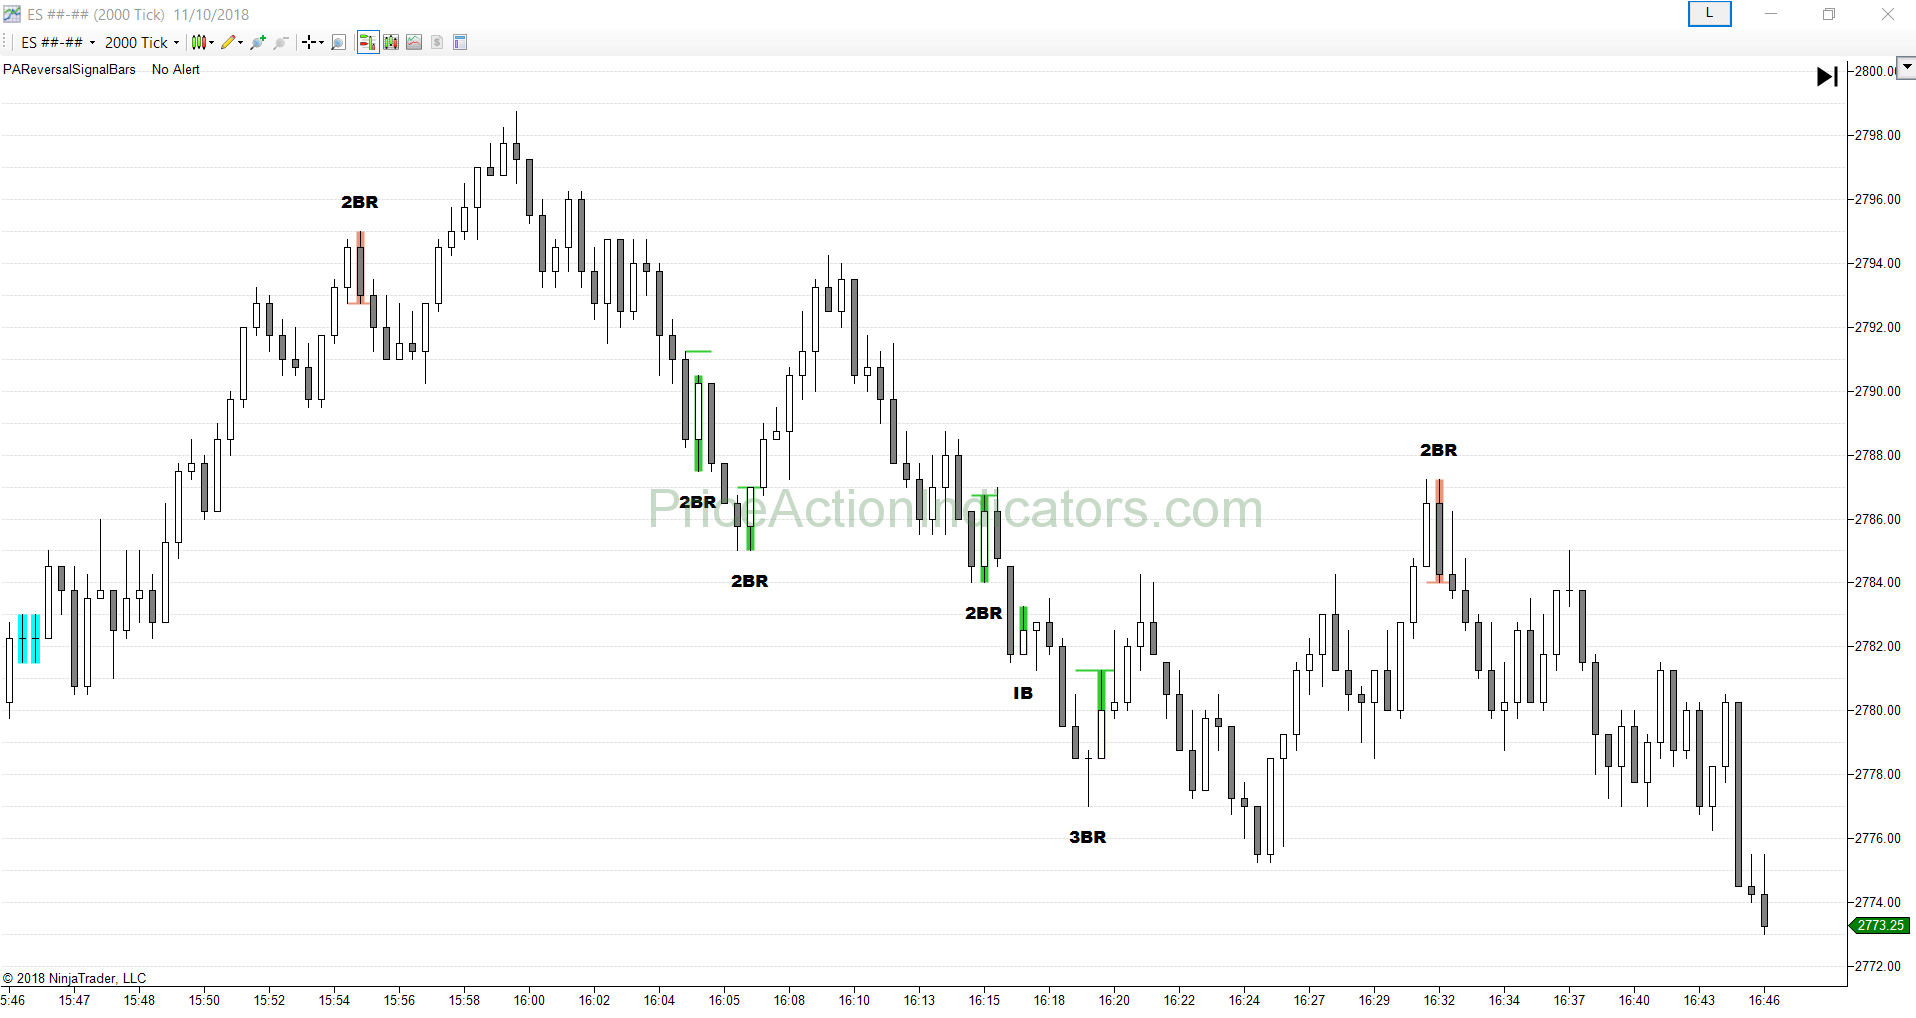
Reversal Signal Bars and Patterns
A Reversal Signal can be a single candlestick or a pattern that signals a trader that a possible reversal is likely setting up. Sometimes a Signal Bar can be a setup for a trade in either direction.
Read more here: Signal Bars & Patterns
How to enter on a Reversal Signal
There are several ways how to enter a trade on a reversal signal. All have advantages and disadvantages and finally depend on the market context and the trader.
Read more here: Entry Strategies
How to Trade – Reversal Signals
Once a Reversal Signal shows up on the chart place a stop entry buy order one tick above the bar or pattern (for bull). The closest logical stop goes below the bar or pattern – a bar/pattern stop.
Read more here: How to Trade a Reversal Signal
“The indicator paid for itself after a week :)”
Santosh D.
Automated Trading
Only the NinjaTrader 8 version of the Reversal Signal Bars indicator is compatible with BloodHound from SharkIndicators or can be used in the Market Analyzer/Strategy Builder of NinjaTrader. You can call it as well from your own NinjaTrader indicators or strategies.
Read more here.
Can I simply trade every Reversal Signal?
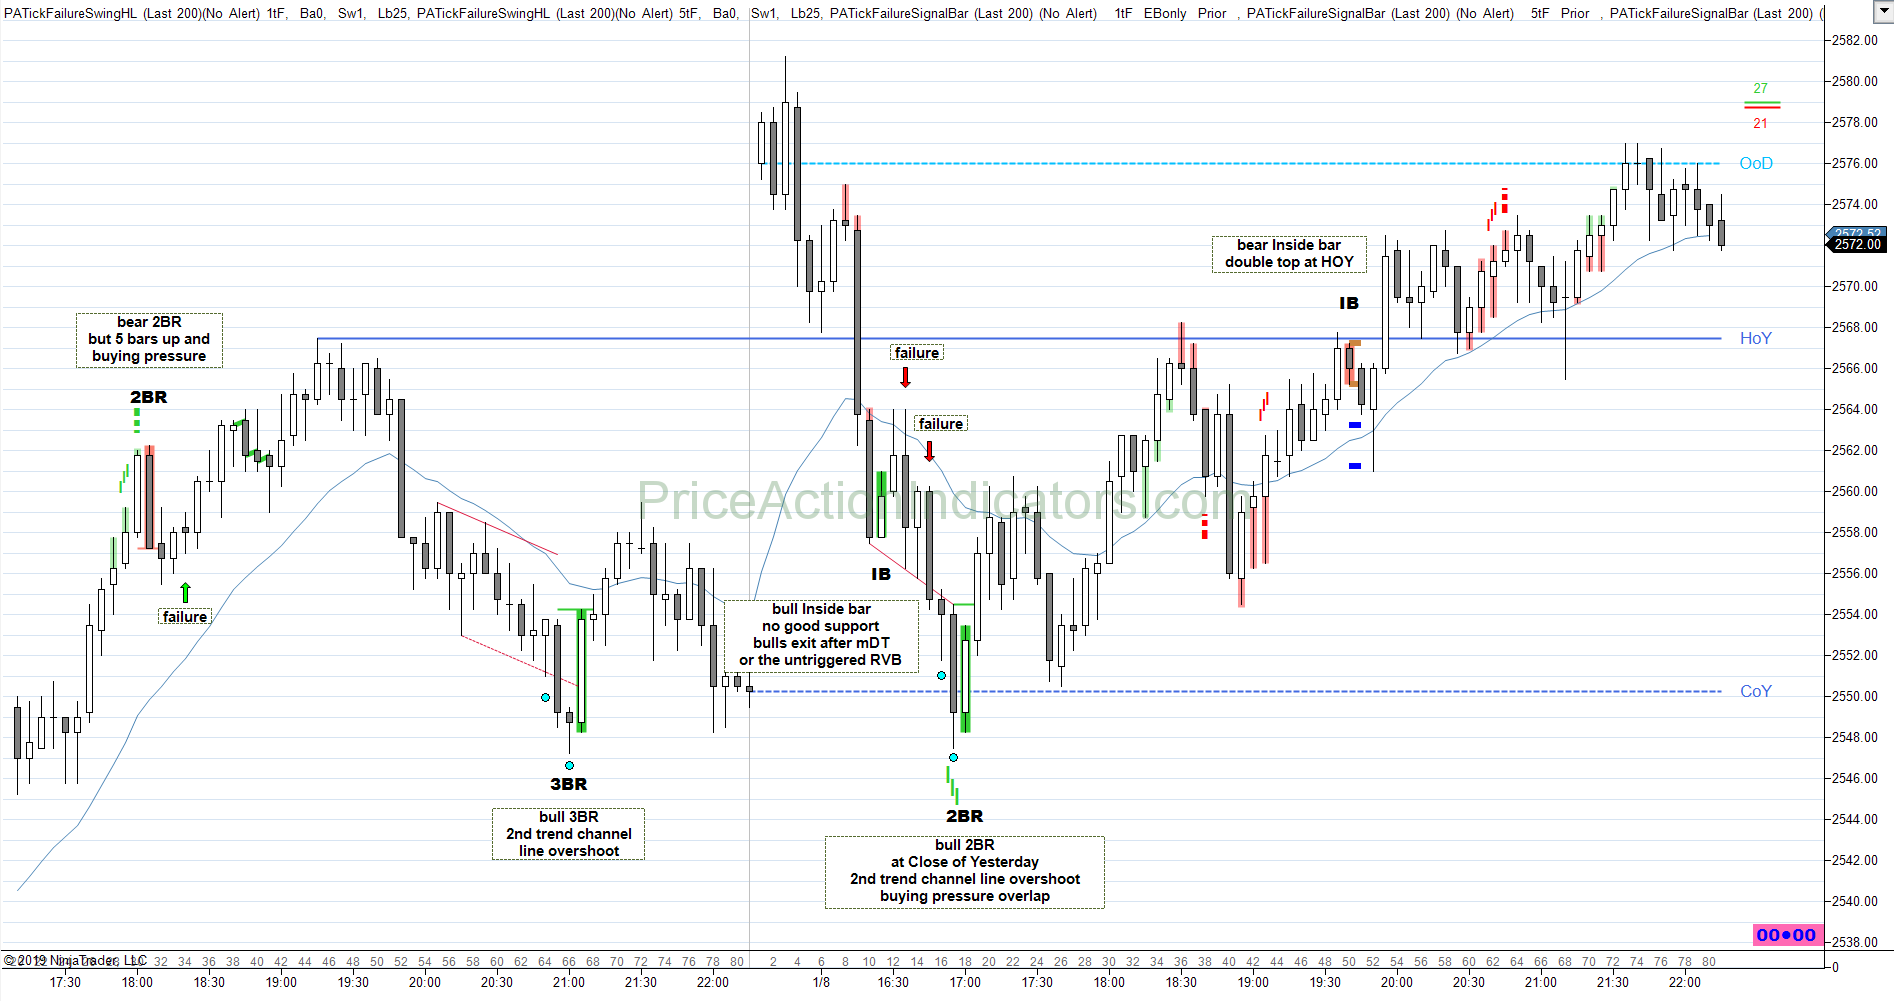
This largely depends on context, trading style and stop loss (e.g. using a wider stop, than a bar stop), also on your ability to scale in. Please check out this separate post about Reversals. Also check out the Blog for more examples on how to use Reversal Signal Bars in your trading.
Confluence is very important in trading and means to have several (at least two) reasons to take a trade. Your 1st reason is the reversal signal bar/pattern and your 2nd reason can be e.g. support at HOY/LOY/COY, measured moves, trend line / trend channel line overshoot, Buying/Selling Pressure, Tick Failure Breakouts, Breakout Tests, a 2nd attempt to reverse and many more.
What are the Settings?
The default settings are “optimized” for the ES E-mini 5 min RTH chart and probably need to be tweaked especially to the “personality” and time frame of the instrument you’re trading.
If you trade the MES, load the indicator on the ES chart (the volume is much larger) and take the trades on the MES with the price from the ES contract. Sometimes the MES overshoots though.
Indicator name: PAReversalSignalBars
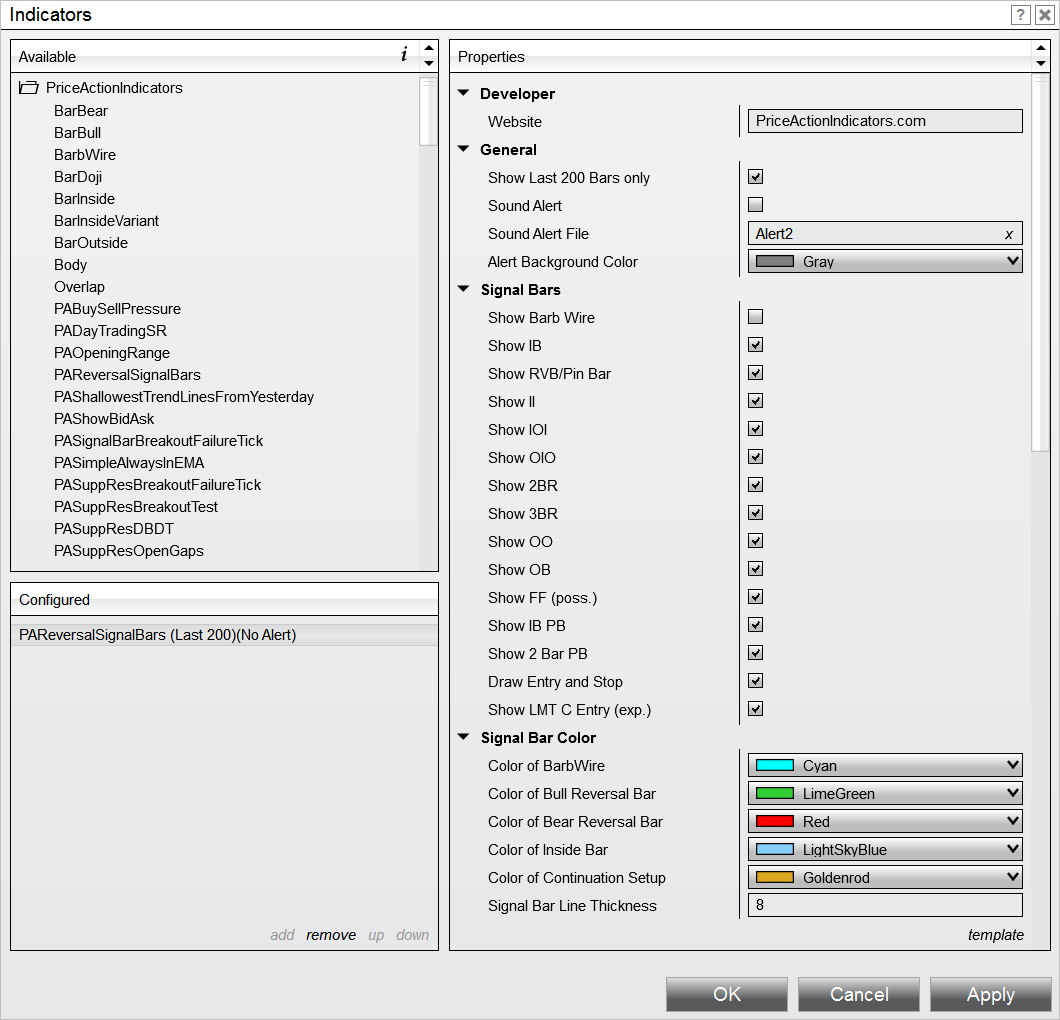
Show Last 200 Bars only
Show the indicator signals only for the last 200 bars, which will speed up a reload of the chart or indicator. Switch off for back testing.
Sound Alert
Play a sound and show an alert in the alert window
Sound Alert File
Pick a .WAV file from the NinjaTrader sound folder (how to install sounds, see here )
Signal Bar
Enable or disable to show the different Reversal Signal Bars or Patterns
Please refer here for Signal Bars.
Draw Entry and Stop
The stop entry price and possible stop loss prices are drawn on the chart.
Show LMT C
Show a possible limit close buy/sell for a Signal Bar (instead of a stop entry above/below the Signal Bar). The features of the Signal Bar and relation to prior bars determine, if this shows up for a specific bar.
That is an experimental feature.
Show Supporting Volume
Shows, if volume compared to prior bars is supporting a trade.
That is an experimental feature.
Signal Bar Color
Signal Bar Color and the thickness of the line to highlight them on the chart
IB PB and 2 Bar PB are the continuation setups
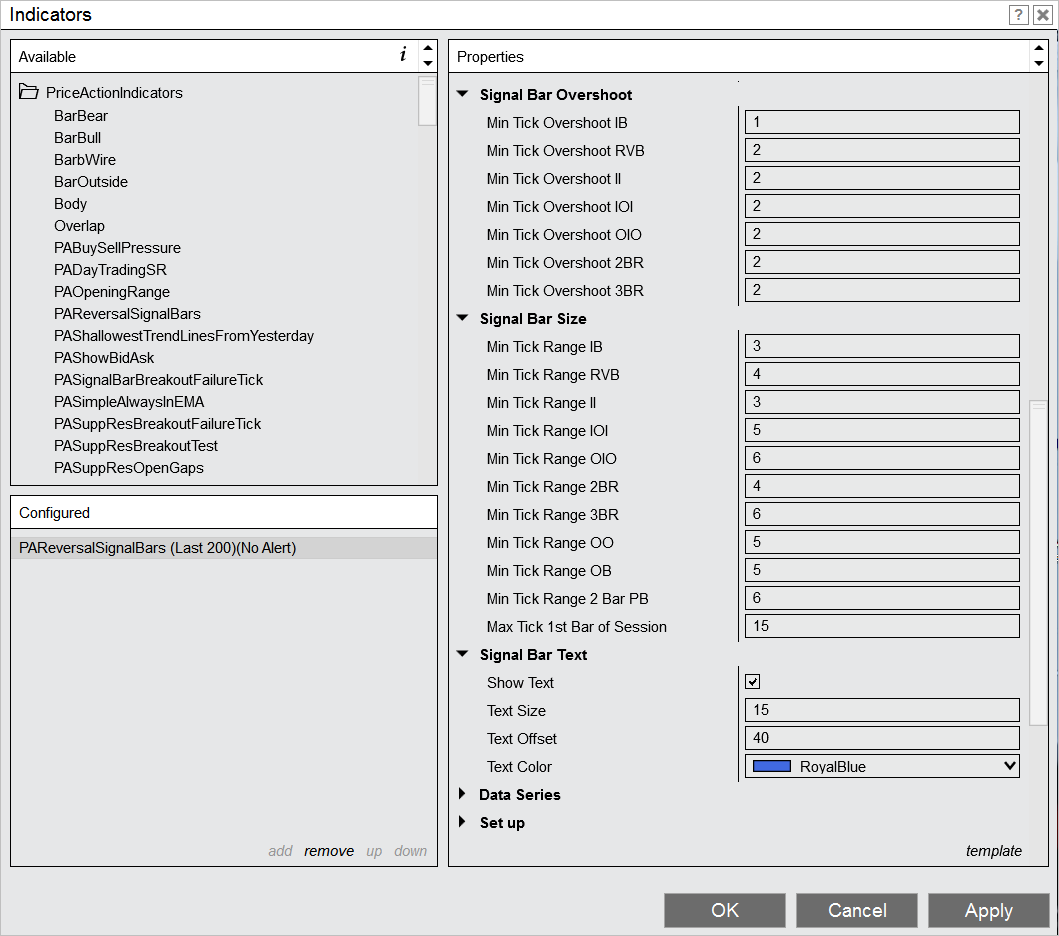
What do I need to set the Signal Bar Overshoot to?
Set the minimum Overshoot depending on the instrument, time frame or bar type you are trading. Overshoot is also called “underlap” (opposite to overlap), which basically is the number of ticks, the Reversal Signal Bar/Pattern dips beyond the prior bar or bars.
It’s best to set the minimum Overshoot to at least two ticks. A too small minimum Overshoot and not enough breakout traders get trapped. Experiment to find out the right settings for your instrument and time frame.
I use the above settings to trade the ES E-mini 5 minute chart.
What do I need to set the Signal Bar Size to?
Set the minimum Signal Bar Size depending on the instrument, time frame or bar type you are trading.
Signal Bar size also largely depends on the average daily range. Keep in mind, that reversals are extreme behavior. Strong reversals often have large Signal Bars. The range of a reversal bar is often around the average range of recent bars.
On large days on the ES E-mini future 5 minute chart you can get a reversal Bar of 20 point range (which is 80 ticks). On smaller days that can be 1.5 to 4 points only. Or take stocks, a reversal bar on the daily AMZN chart can have the size of $70, which is 7000 ticks. Experiment to find out the right settings for your instrument and time frame.
I use the above settings to trade the ES E-mini 5 minute chart.
Signal Bar Text
Enable or disable the display of text, text color, size and offset from Signal Bar high or low
Plots
The plots can be used in the NinjaTrader Market Analyzer.
back to Indicators