
Support and Resistance – Opening Range
Indicator for NinjaTrader® 8 ONLY!
Features
- Calculate the Opening Range High/Low for the first 5, 15, 30 or 60 minutes of the trading session
- Show bars from higher time frames (5, 15, 30 and 60 minutes) on the trading chart
- Show closes from higher time frame bars on the trading chart
- Show the open of the day
- Alert feature for a close above/below the Opening Range
- Real-time signals (Calculate: On price change)
- does not work on Second, HeikenAshi, Kagi, Renko, PointAndFigure and LineBreak charts
Example Charts
Download a 20 day trial version
Buy now for US $ 80
you get redirected to our reseller MyCommerce/Digital River/Share-it to place your order
to order you need your NinjaTrader® Machine ID (please see FAQ)
for license activation (please see FAQ)
Please contact us for a discount if you’re going to buy more than one indicator.
What is Support and Resistance?
Support and resistance are important levels where lots of buyers and sellers are willing to trade a security. If these levels are broken, market psychology can shift and new levels of support and resistance might get established. Although single lines look nice on a chart, levels need to be seen as zones.
Like Al Brooks is saying here “One of the most useful rules in trading is that if something resembles a reliable pattern, it will likely behave like the reliable pattern. In any case, nothing is ever perfect or certain, so close is usually close enough.”
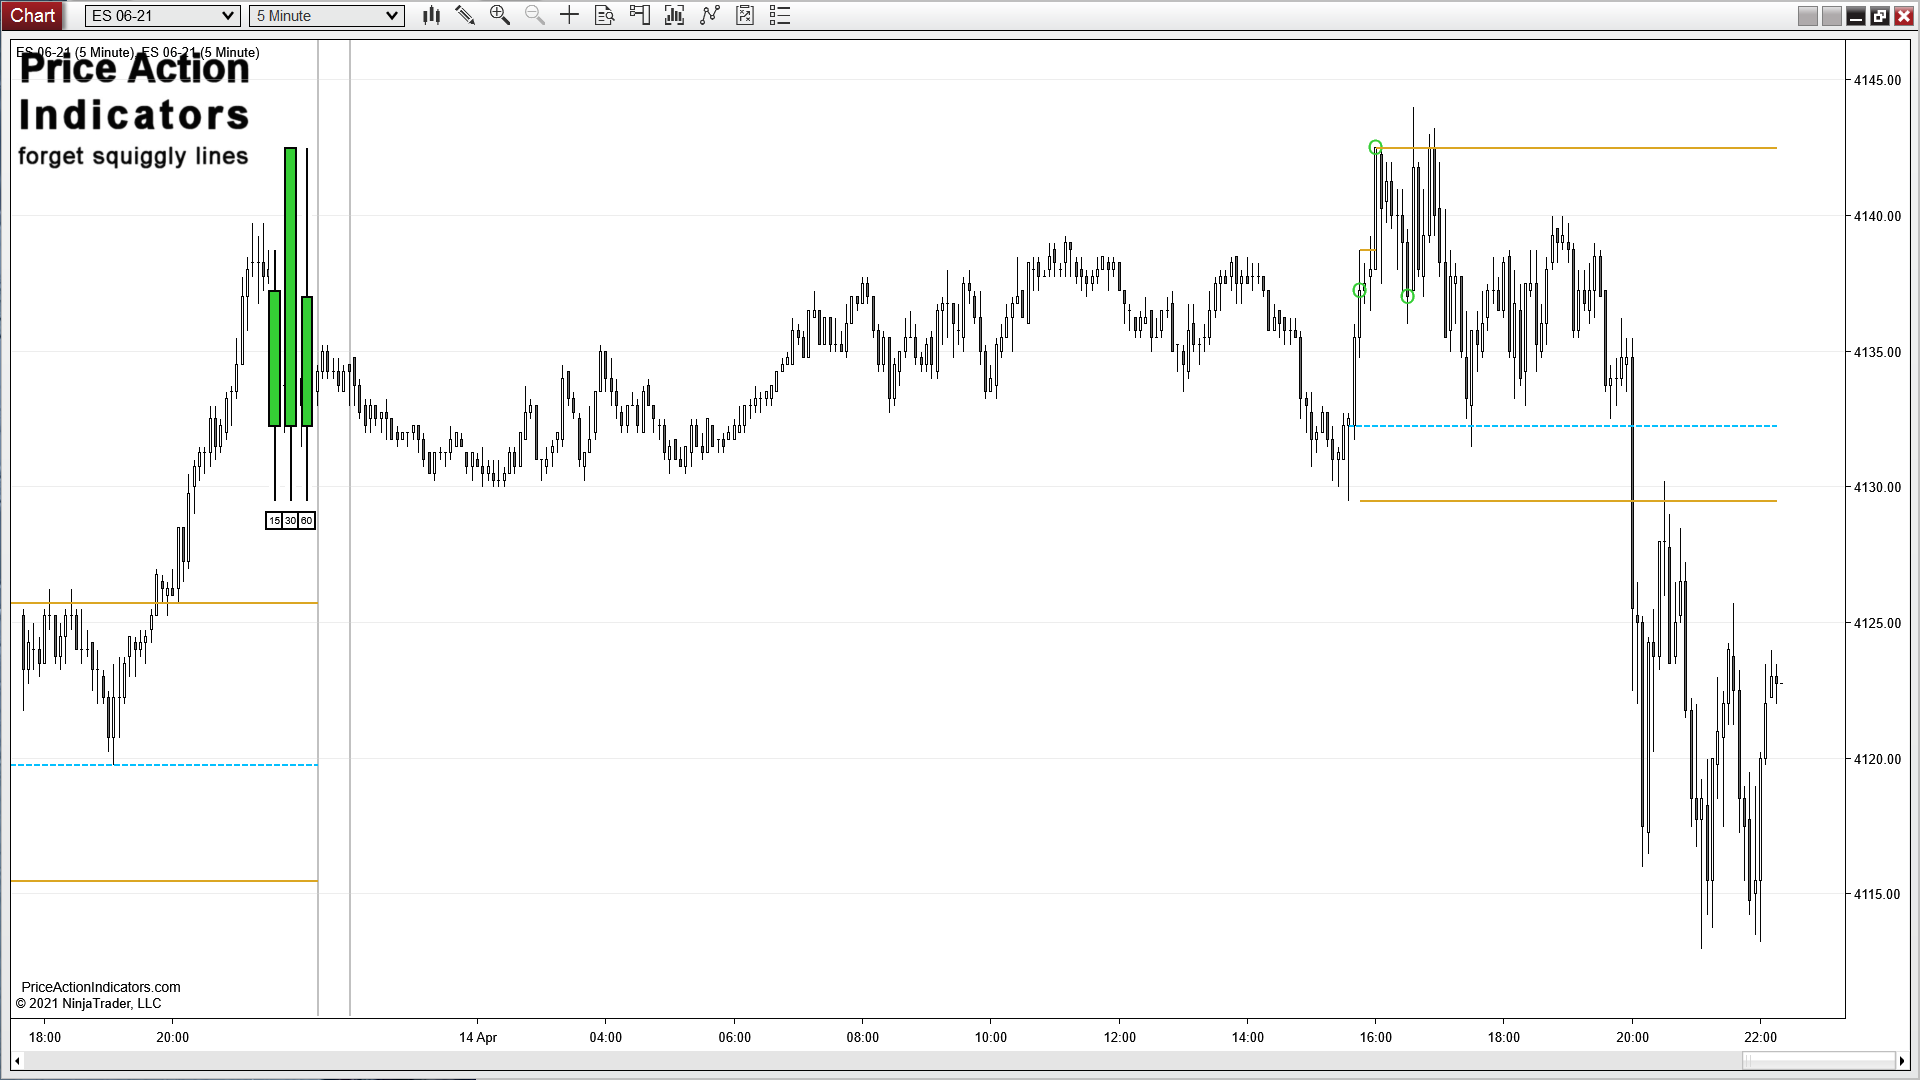
The Opening Range
Opening Ranges are important to a lot of traders because they often provide an indication of sentiment for the day’s price action. A number of trading systems rely on breakouts or failed breakouts of the extremes of the opening range.
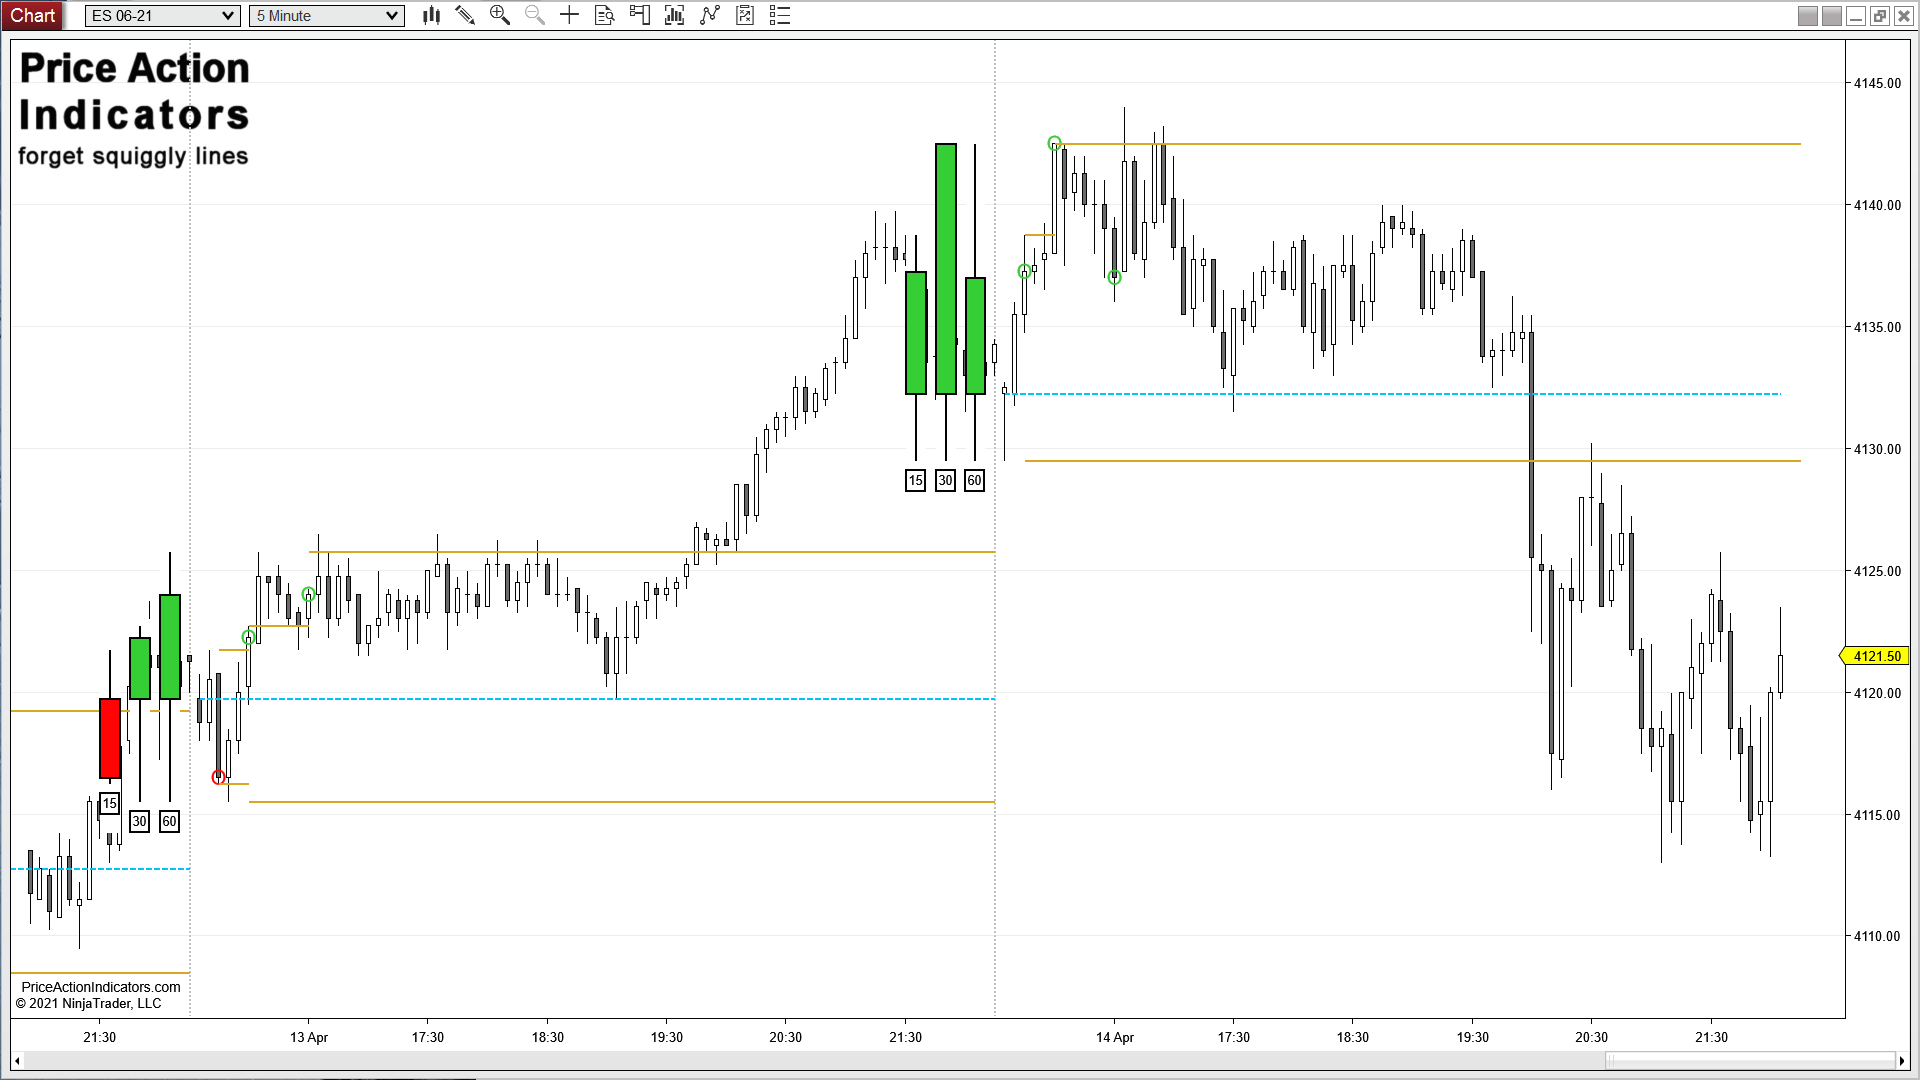
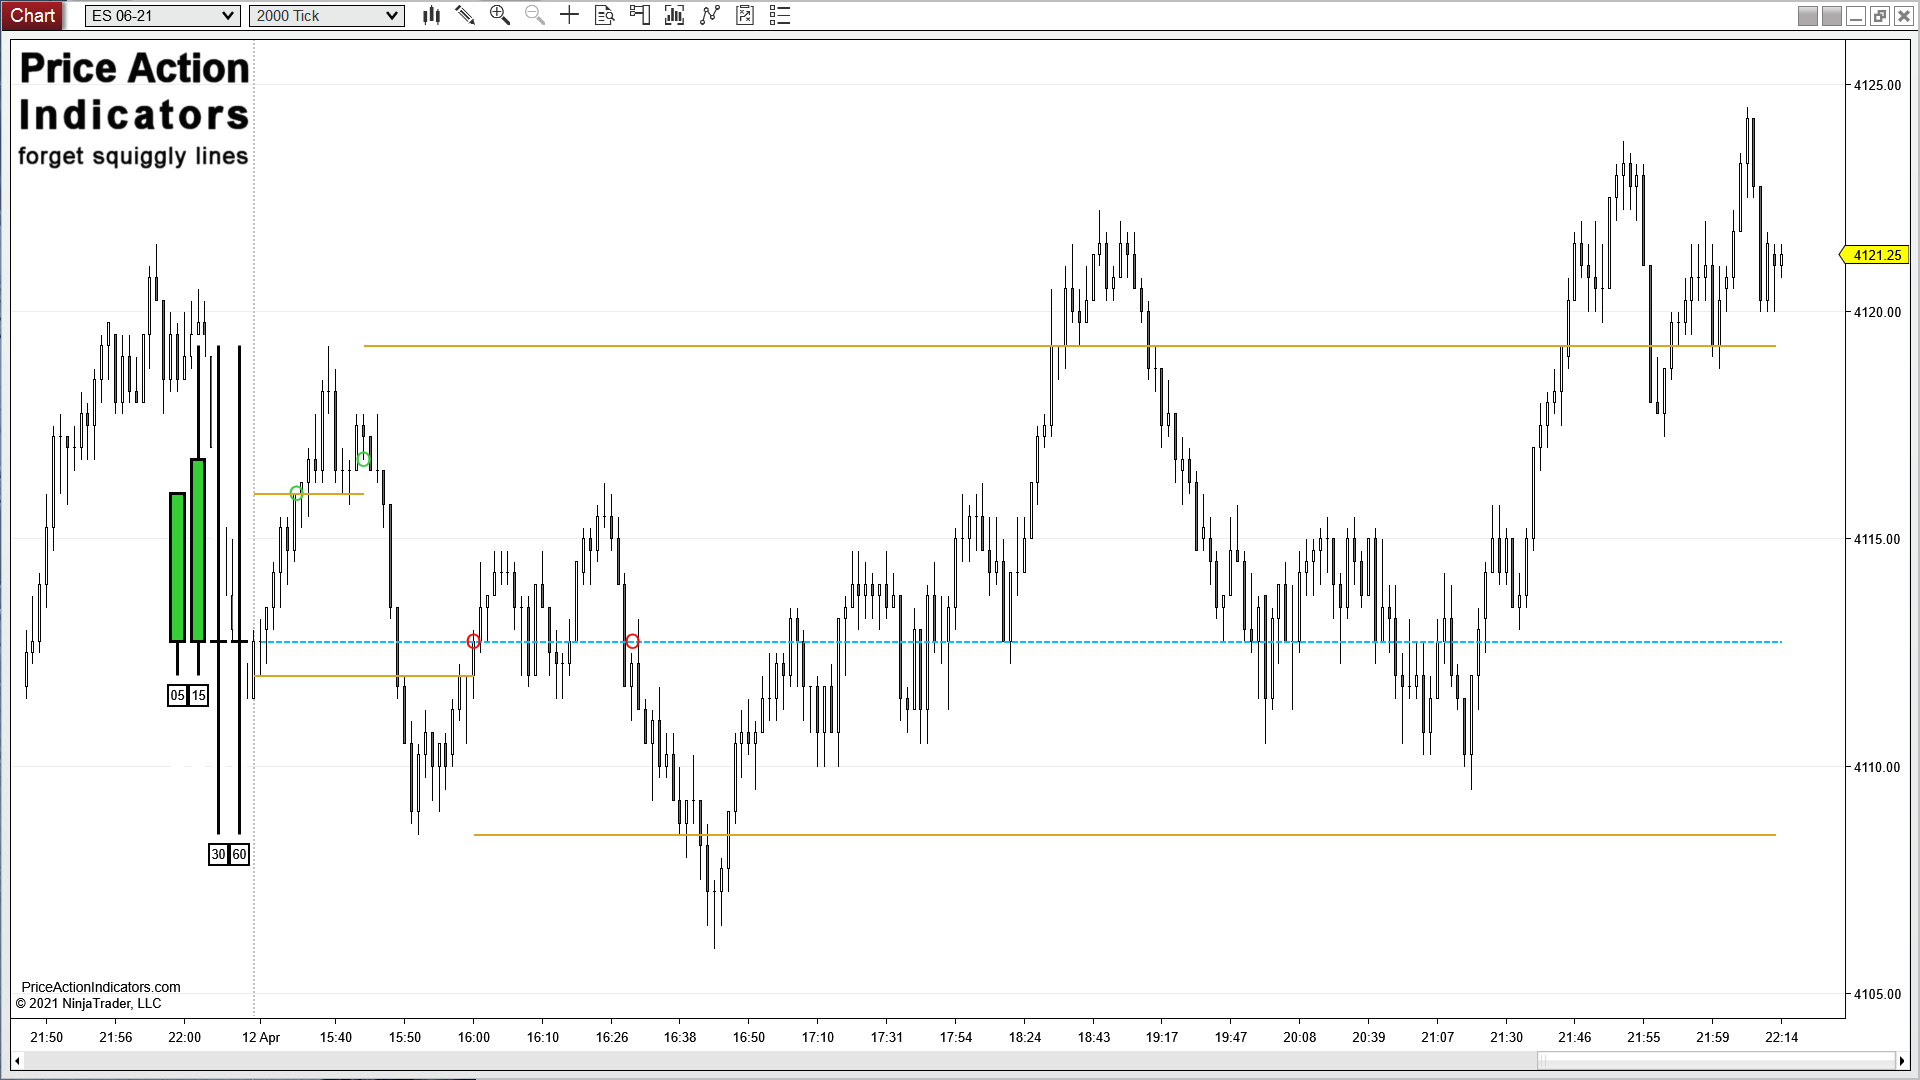
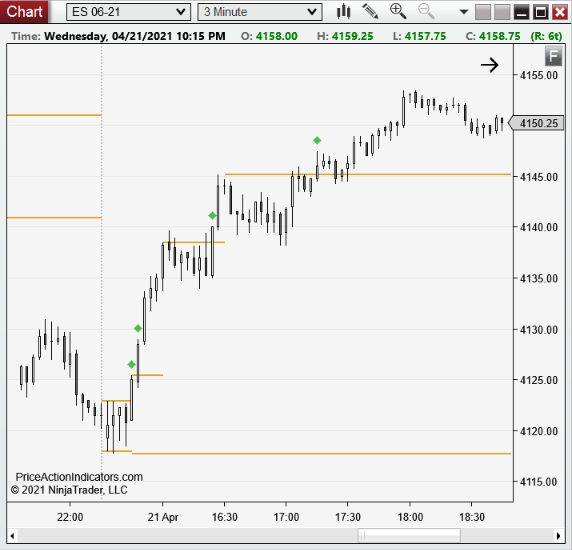
The PAOpeningRange indicator is able to calculate the Opening Range High/Low for the first 5, 15, 30 or 60 minutes of the trading session.
It also shows the candle sticks for all of the higher time frames selected to point to a possible change of sentiment during the forming of the opening range. Closes from the higher time frame bars can be plotted on the trading chart to spot aggressive trading at these important prices.
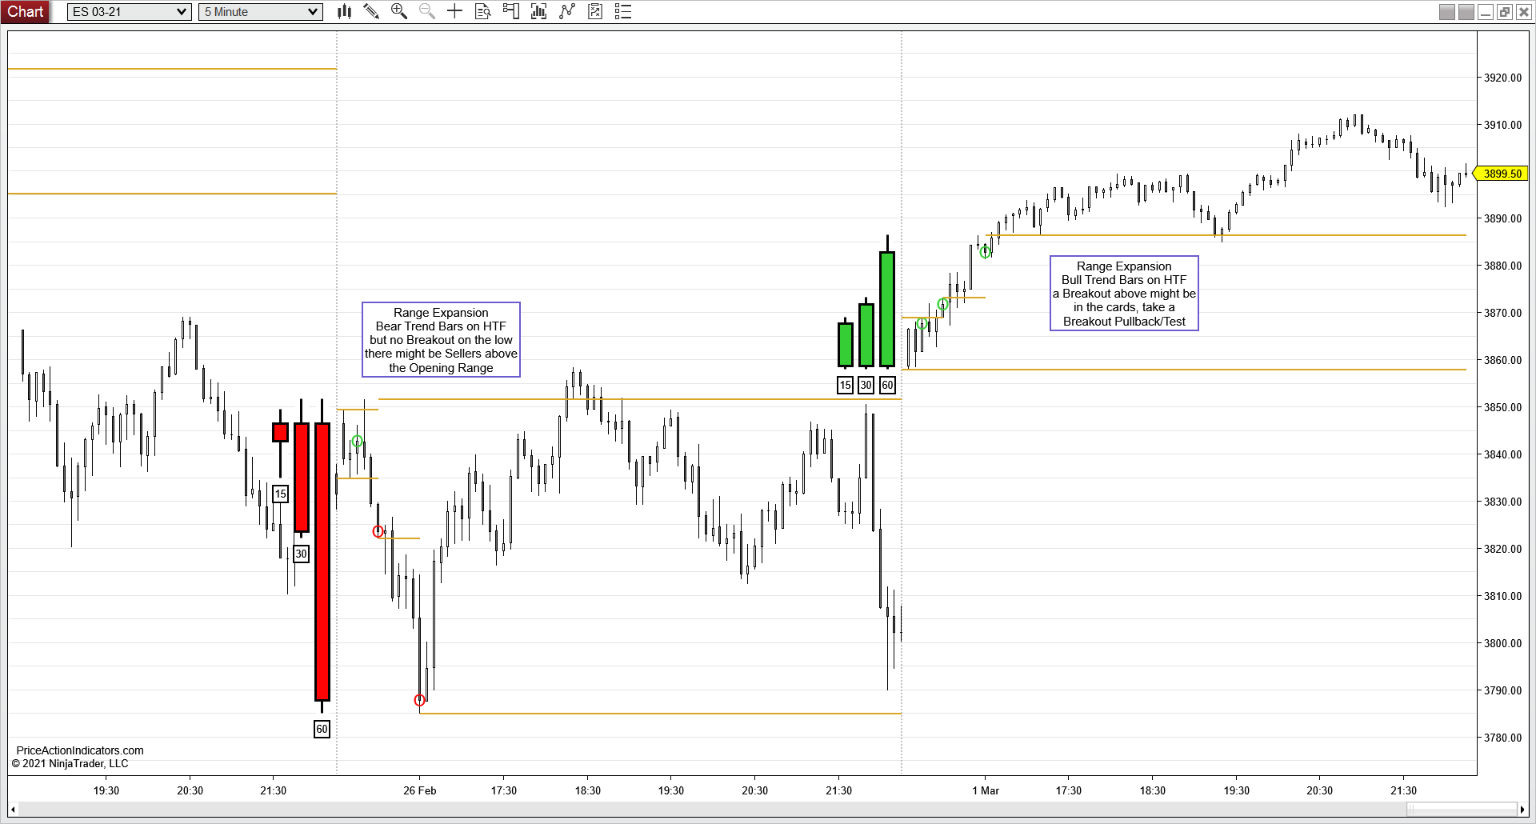
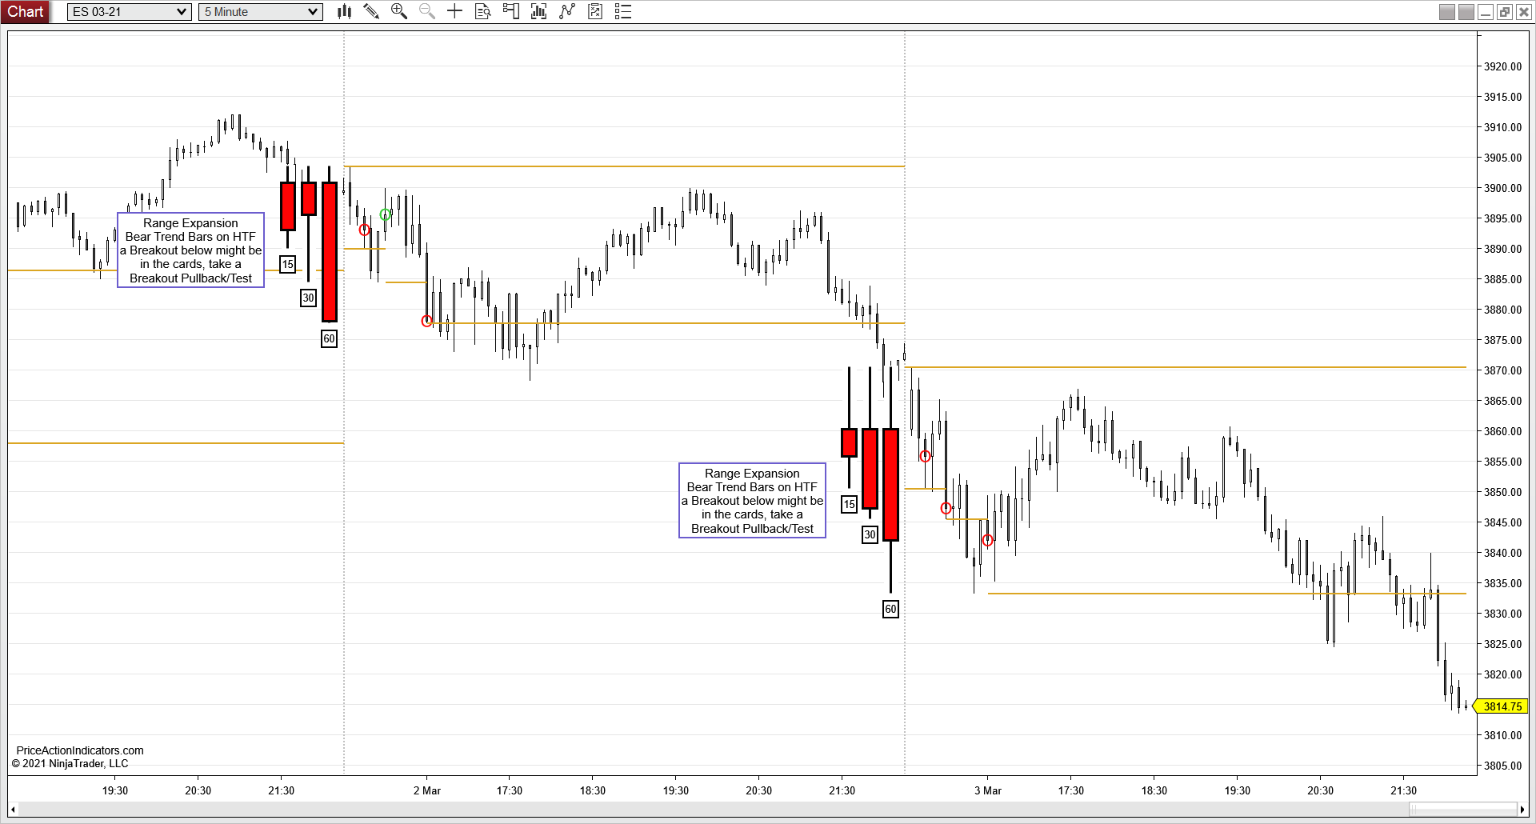
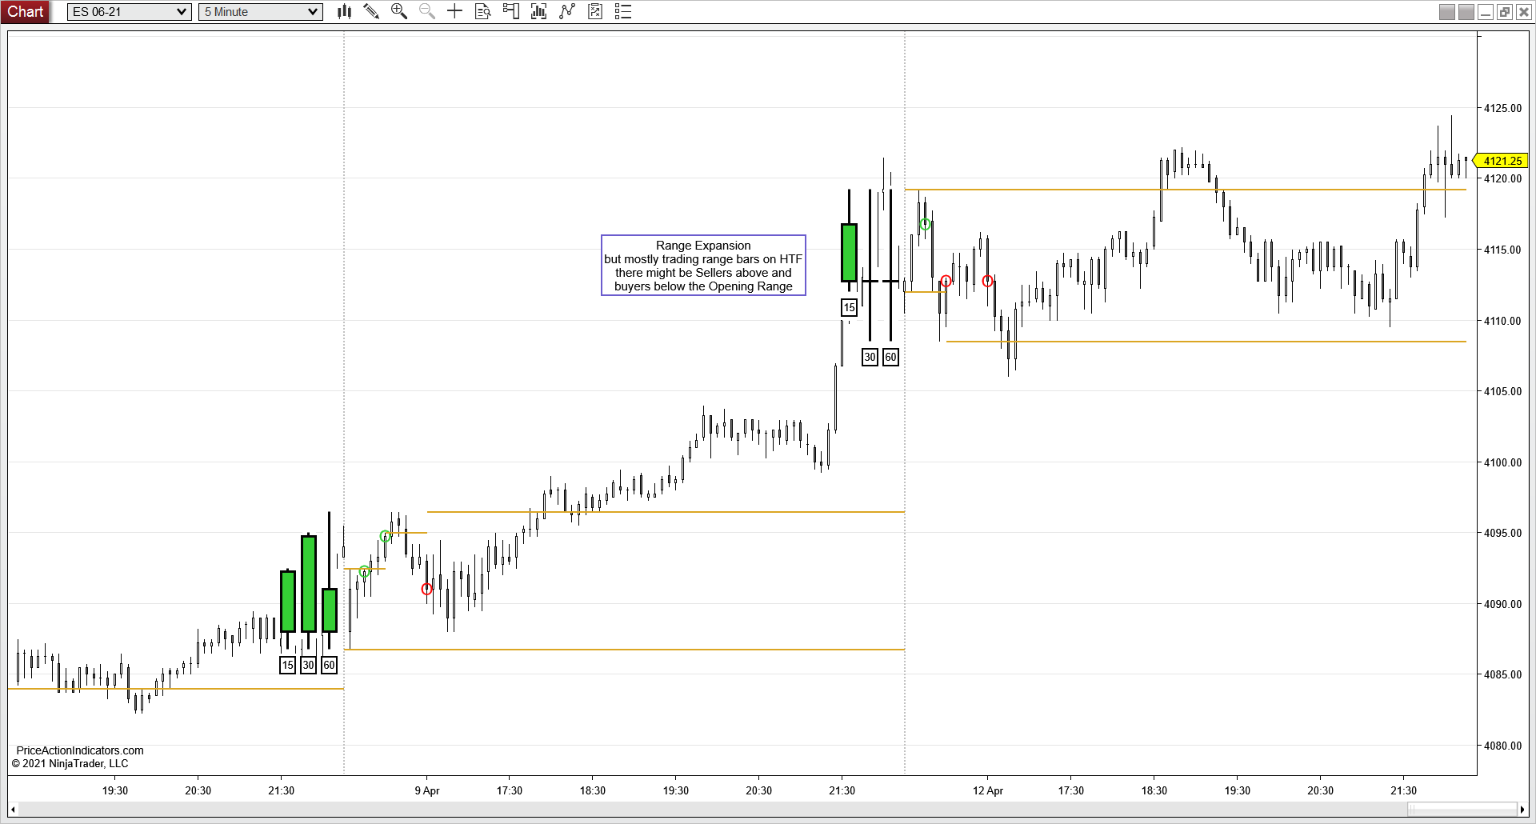
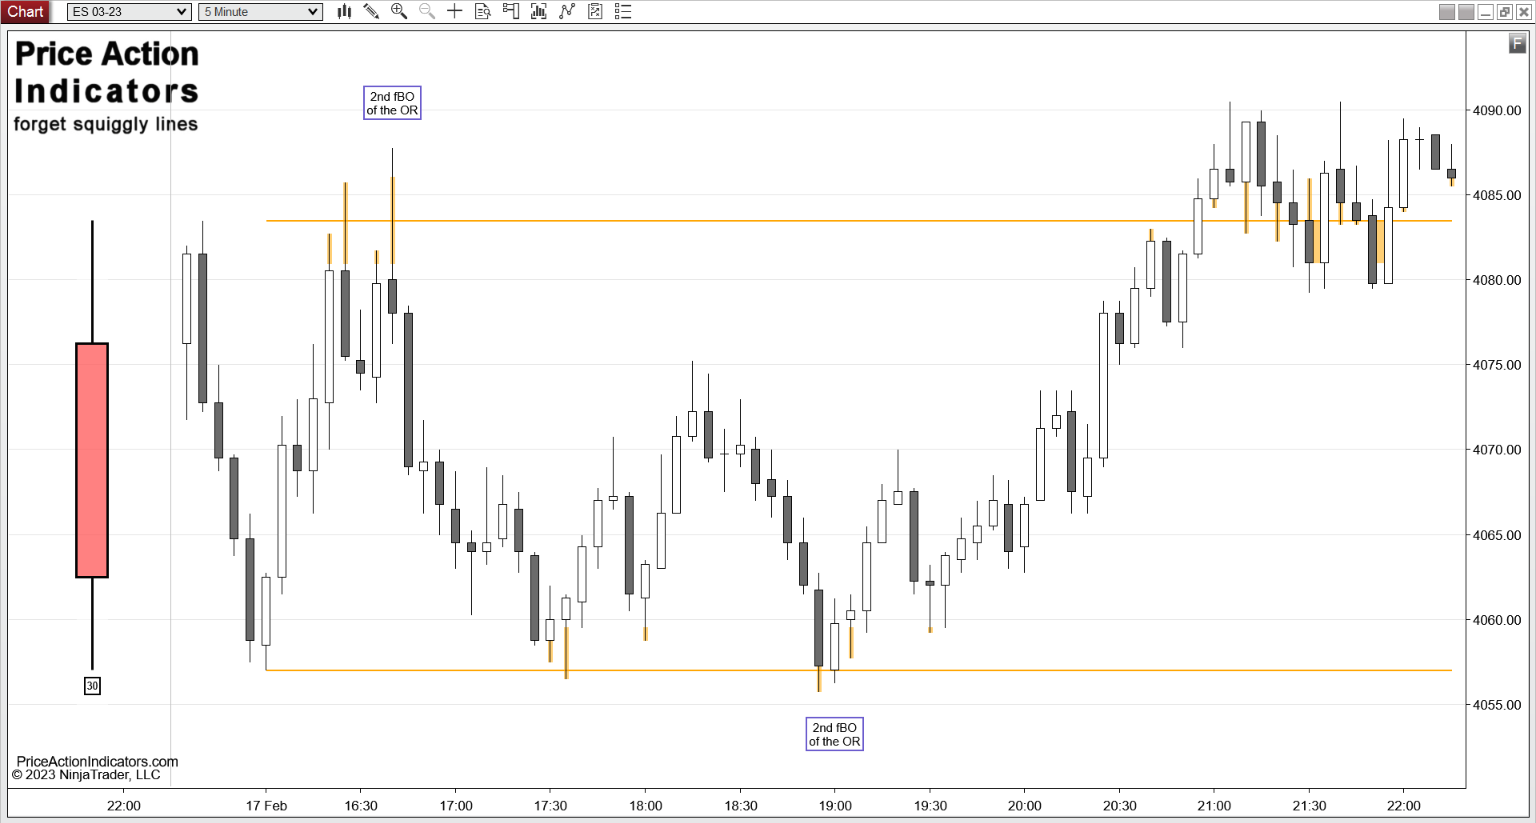
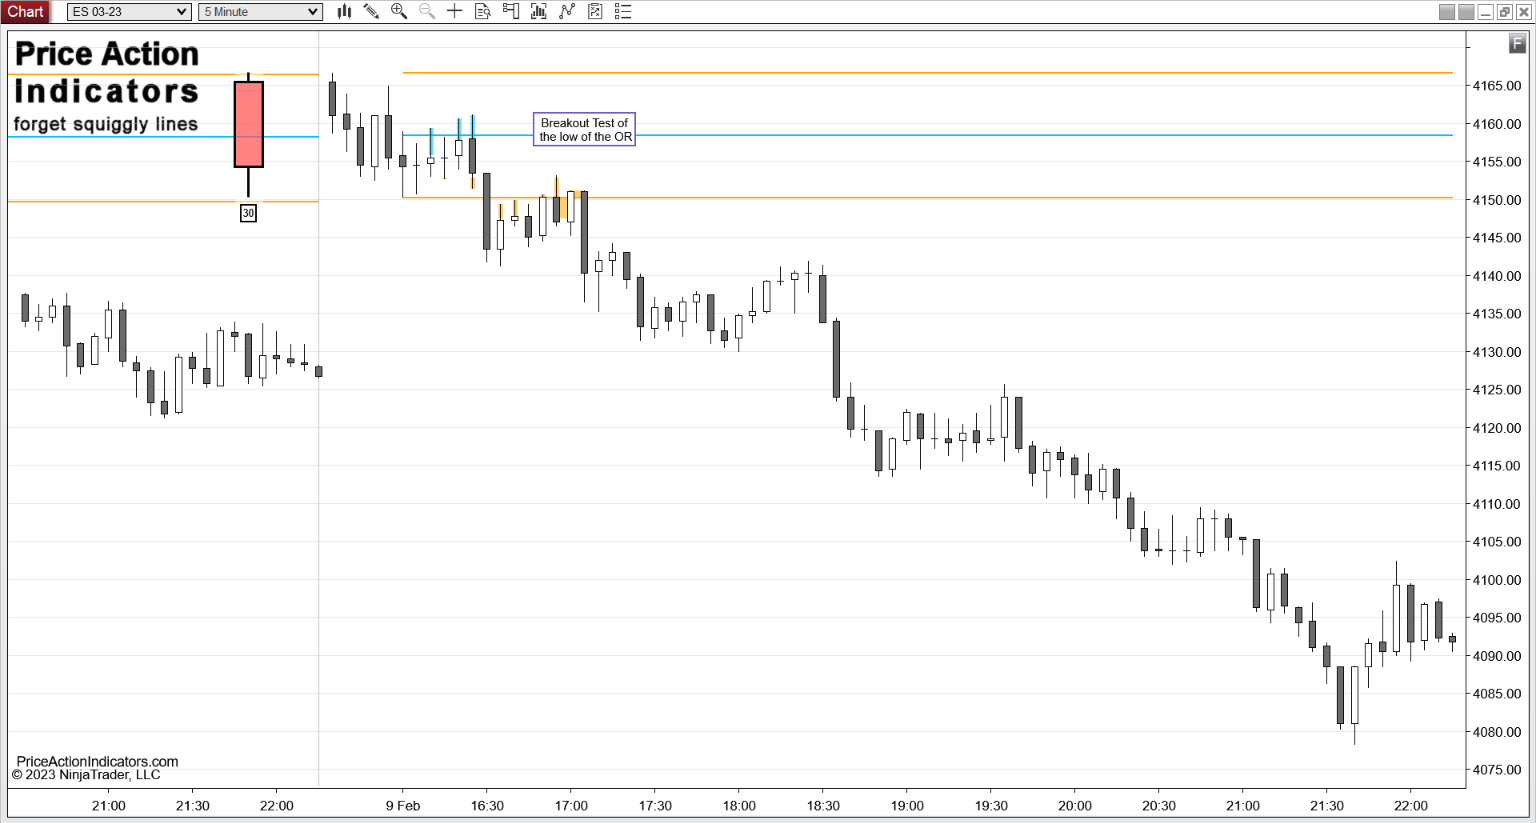
Well know strategies used to trade the opening range are High Volume Breakout, Breakout Pullback / Breakout Test and Failed Breakouts.
Increase the probability on these strategies by considering the following:
- do not trade into support & resistance of the prior day
- trade in the direction of VWAP
- on large gaps breakouts often lack conviction
Because of the increase in volume around the “old RTH open” it might even make sense to trade markets like Crude Oil (CL) or Gold (GC) using the RTH Opening Range, despite that there are no “real” RTH on these instruments anymore.
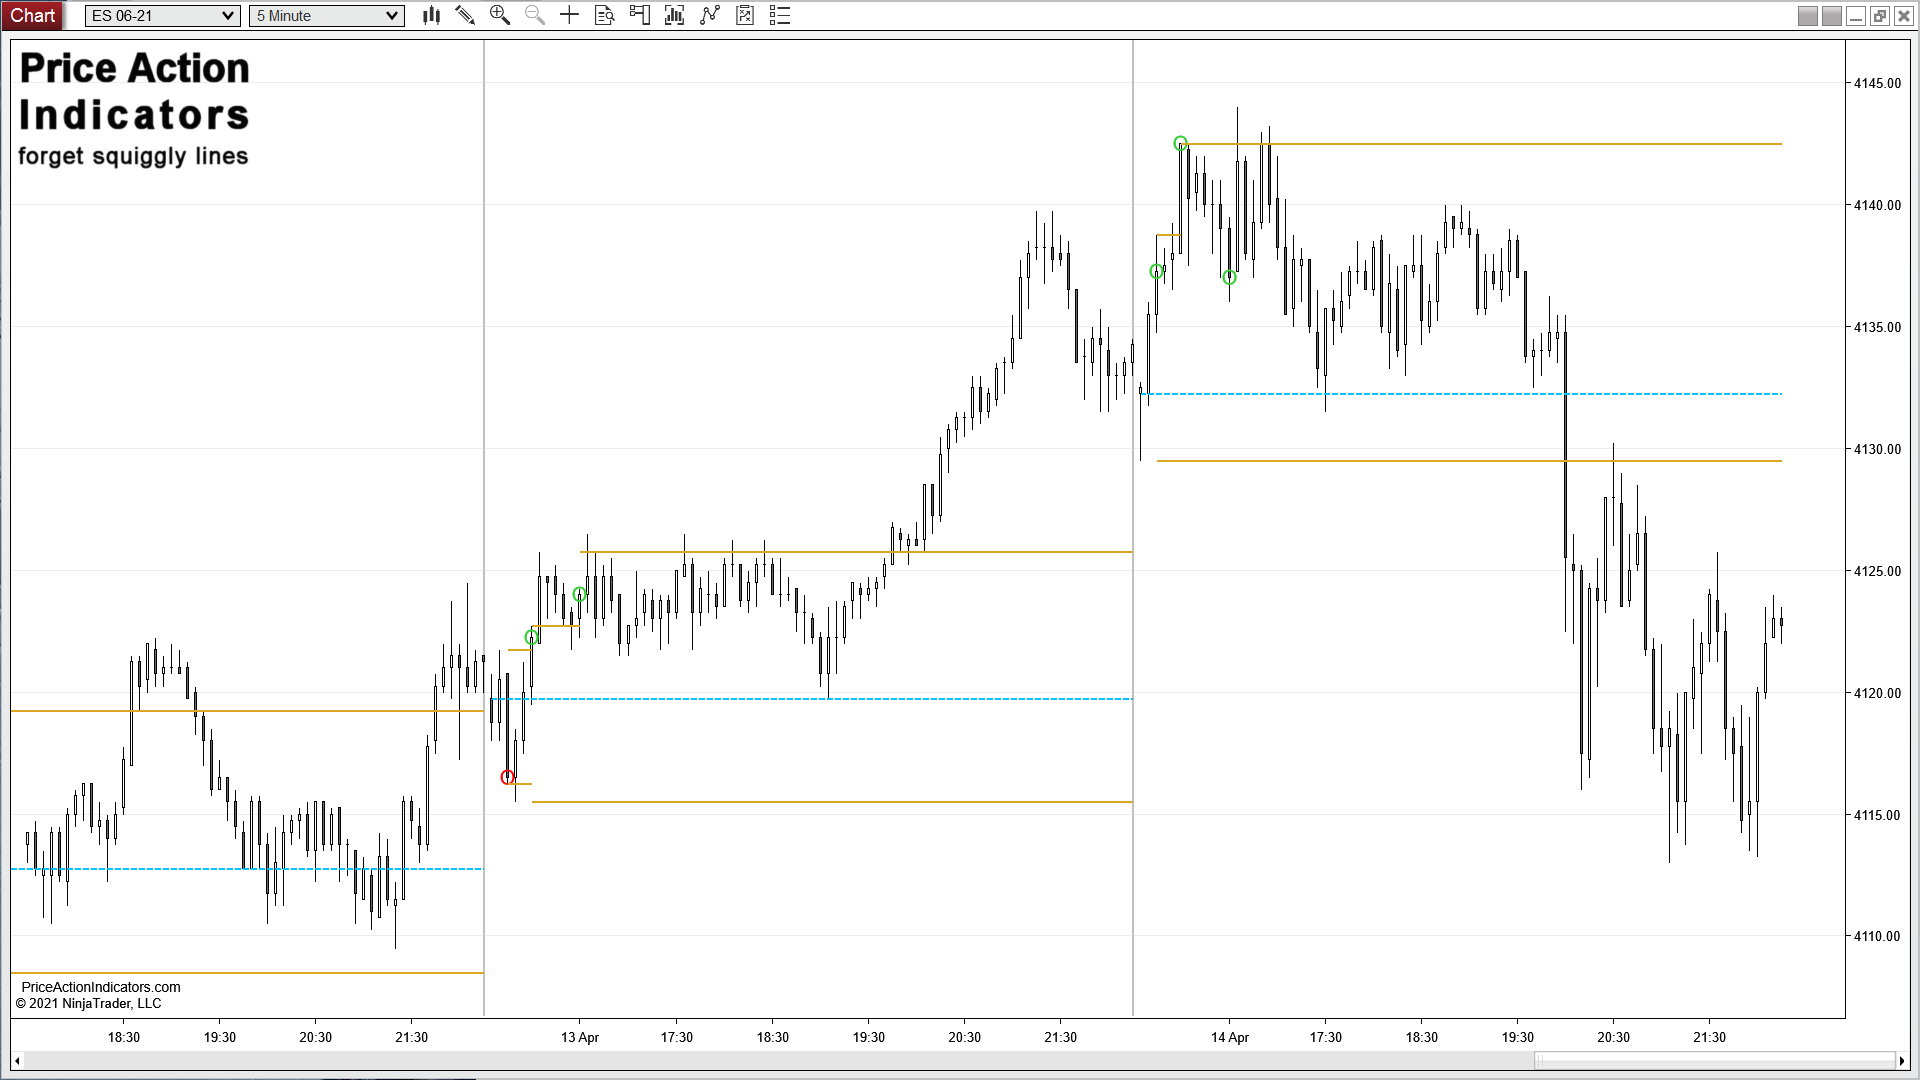
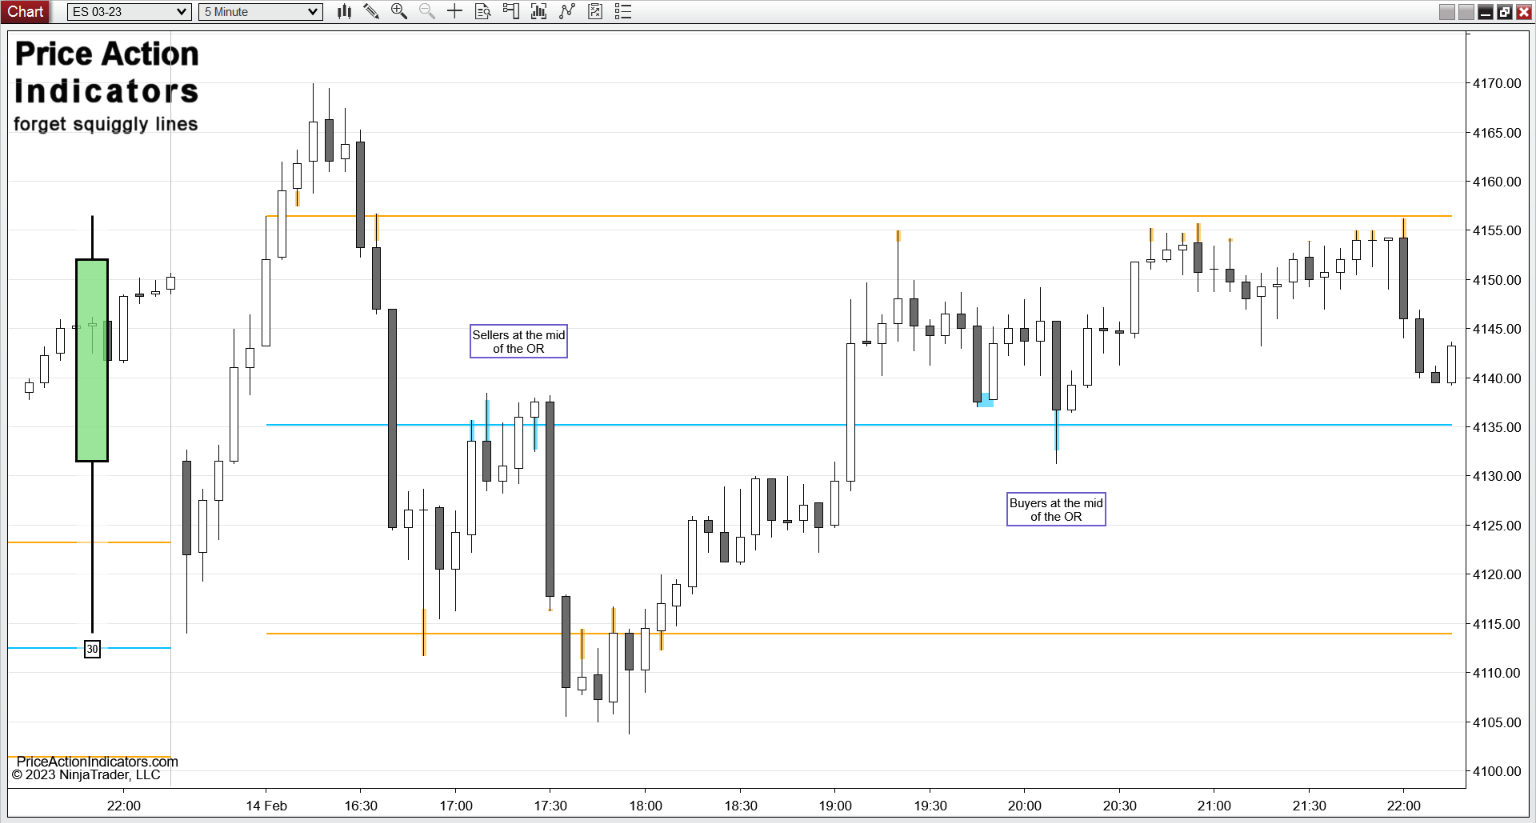
Price Action around important levels of the Opening Range
If price is close to the High/Low or middle of the Opening Range Price Action at the corresponding support/resistance level can be highlighted. Pullbacks or Tails at these levels can be highlighted also.

What are the settings?
Indicator name: PAOpeningRange
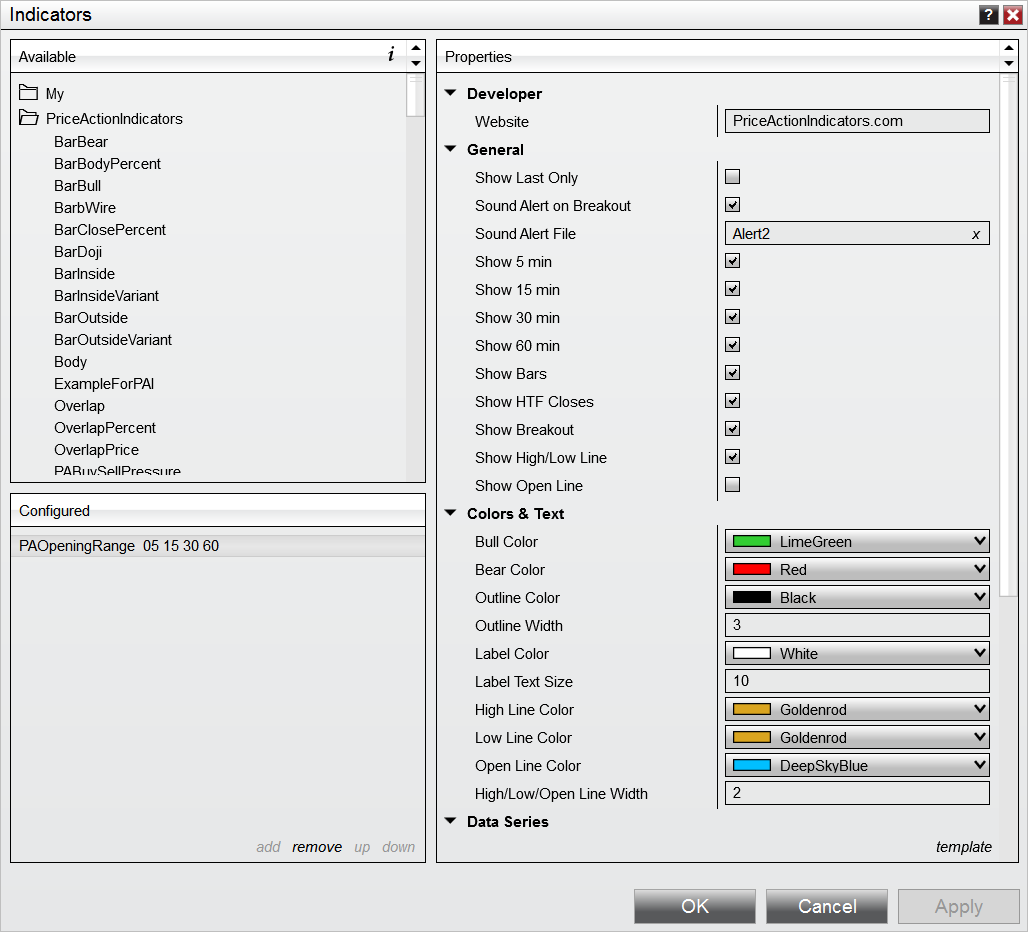
Show Last Only
Show the indicator signals only for the last couple of days which will speed up a reload of the chart and indicator
Sound Alert
Play a sound and show an alert in the alert window when there is a close above/below the opening range
Sound Alert File
Pick a .WAV file from the NinjaTrader sound folder (how to install sounds, see here )
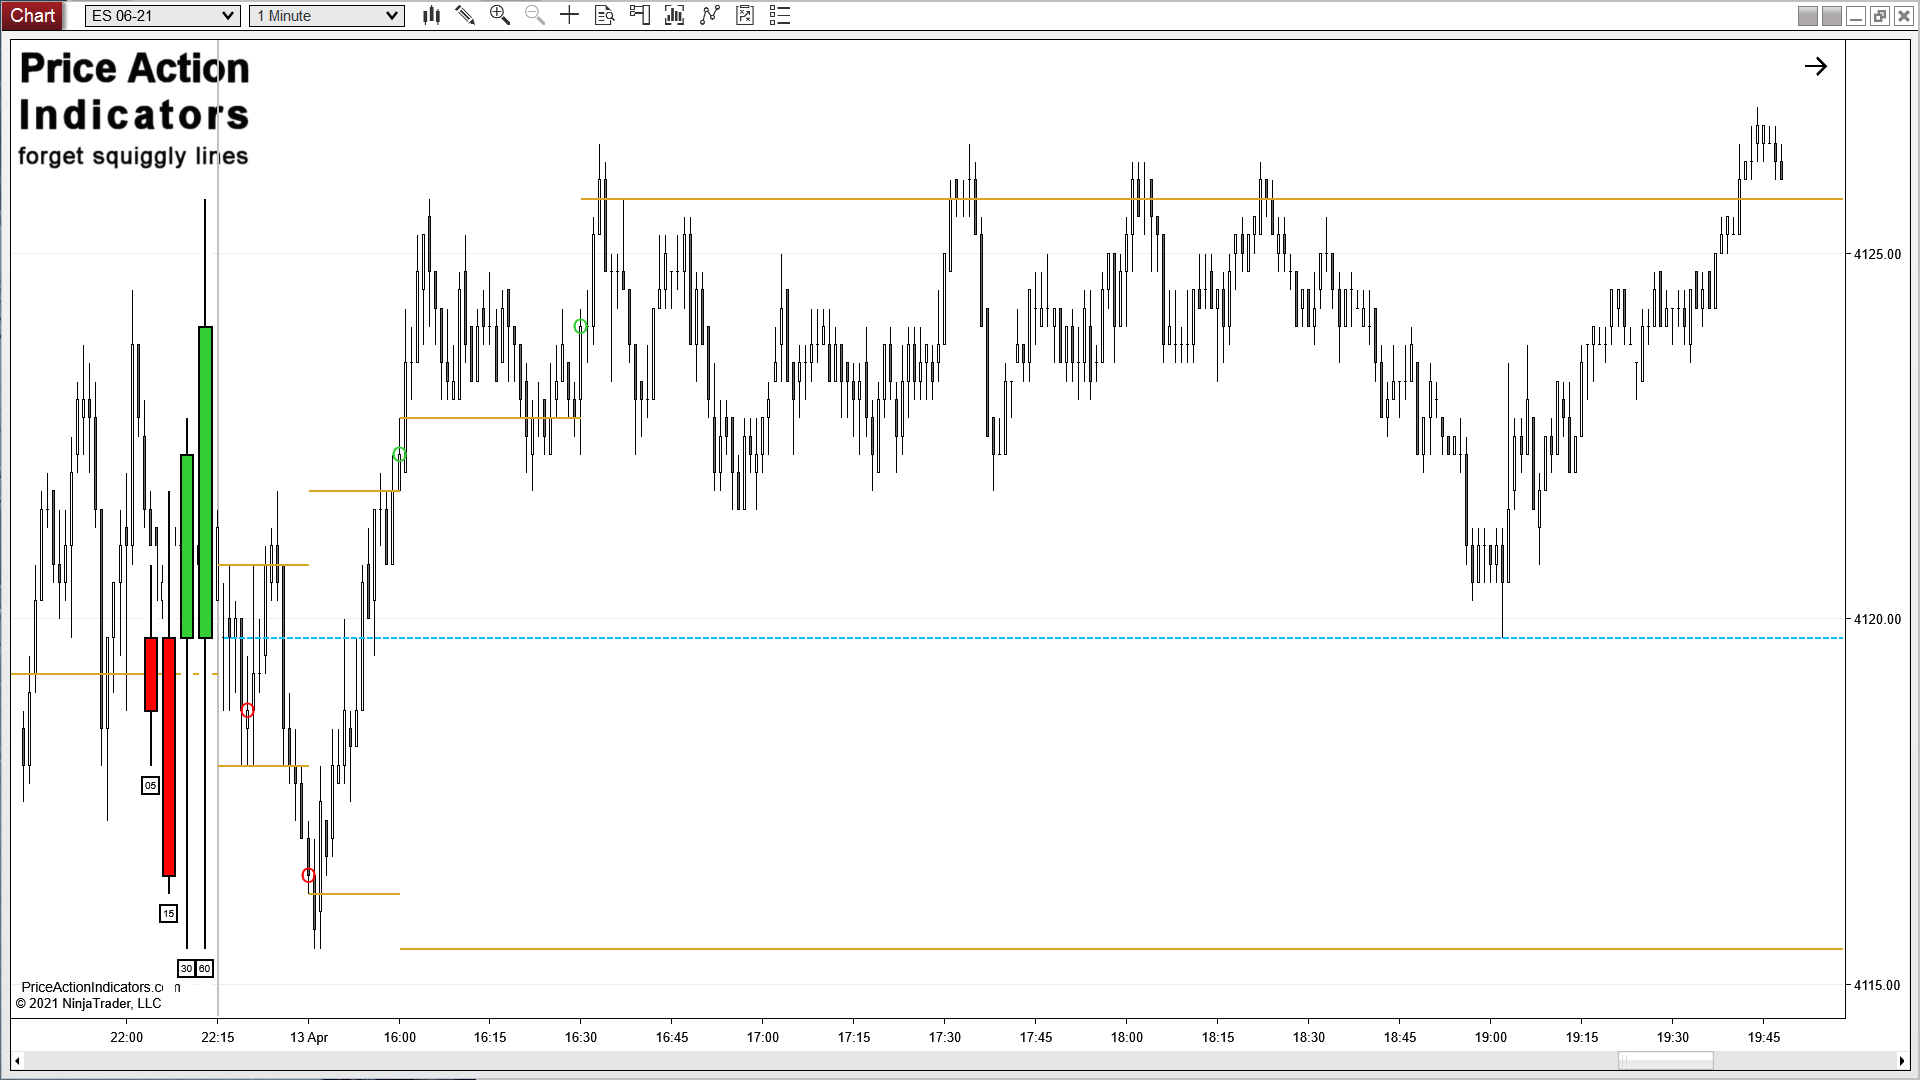
Show 5 / 15 / 30 / 60 min
Opening range high/low for the first 5, 15, 30 or 60 minutes of the trading session
Show Bars
Show bars from higher time frames (5, 15, 30 and 60 minutes) on the trading chart
Show HTF Closes
Show Closes from higher time frame bars on the trading chart
Show Breakout
Mark bars, that close above/below the opening range
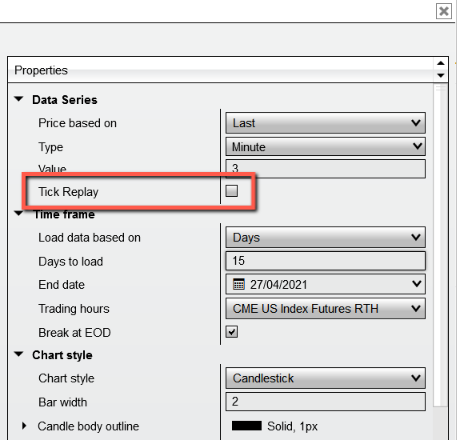
IMPORTANT:
Because this indicator is using a “Multi-Time Frame” approach and because of Ninja Trader’s Data processing sequence for historical data one needs to set the Data Series of the chart to “Tick Replay“ to get reliable signals for a breakout of the Opening Range (on historical data only). Please read more here: How to enable “Tick Replay”.

Show High/Low Line
Show the opening range high/low as a horizontal line
Show Open Line
Show the open of the day as a horizontal line
Bull Color
Fill color for higher time frame bull bars
Bear Color
Fill color for higher time frame bear bars
Outline Color
For higher time frame bars
Outline Width
For higher time frame bars
Label Color
Color for the higher time frame bar label
Label Text Size
Text size for the higher time frame bar label
High Line Color
Color for the high line of the opening range
Low Line Color
Color for the low line of the opening range
Open Line Color
Color for the line at the open of the day
High/Low/Open Line Width
back to Indicators