
Support and Resistance – Day Trading S/R Pro
Indicator for NinjaTrader® 8
Support / Resistance (S/R) levels and features (new features)
- Open/High/Low of Today
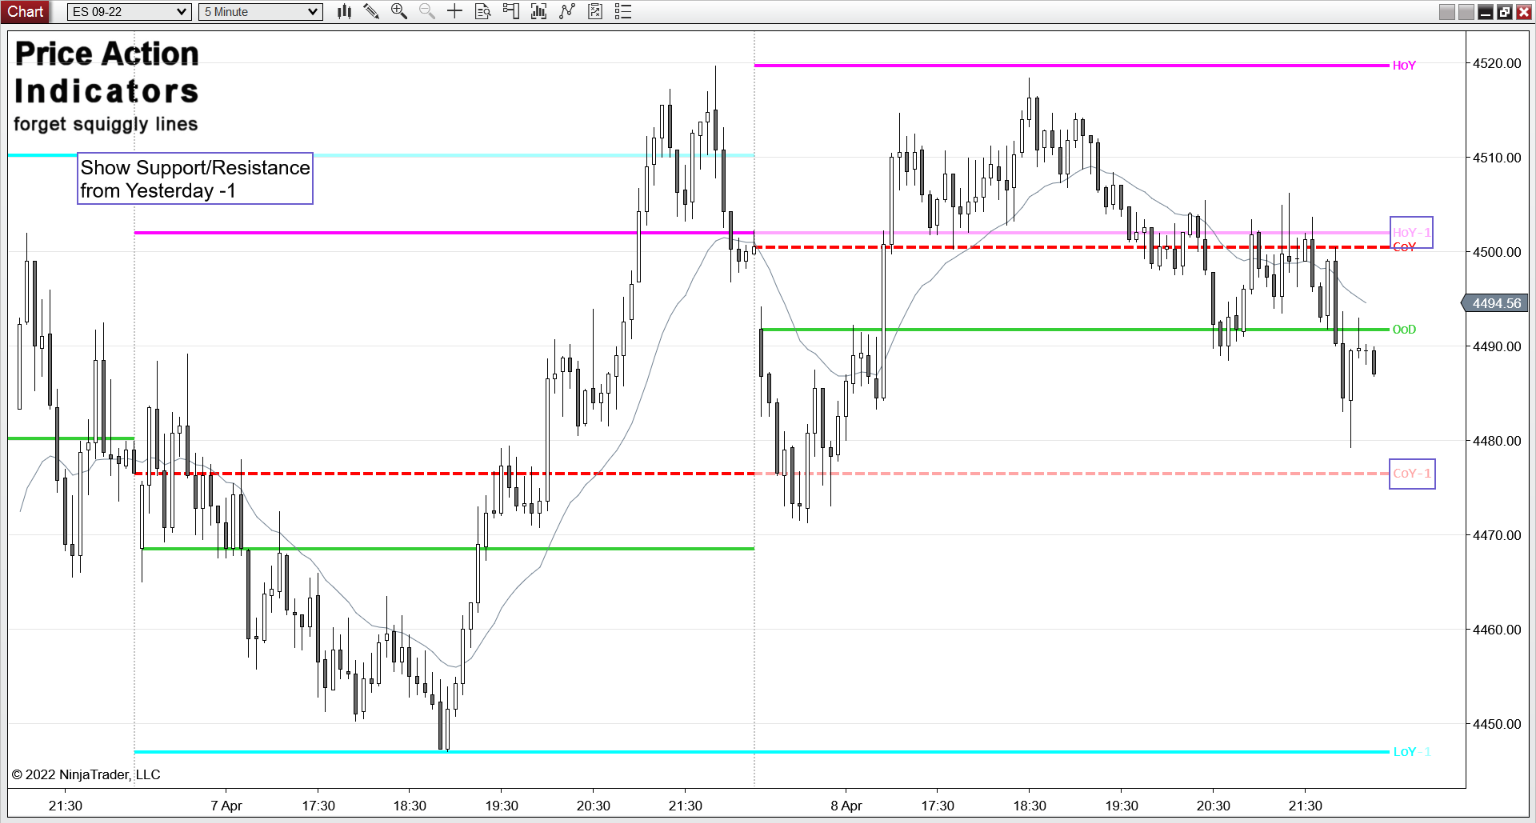
- High/Low/Close of Yesterday, Yesterday – 1 and Yesterday – 2
- 4pm Close of Yesterday
- Filter overlapping S/R levels
- Open of Yesterday, Open of the Week, Open of the Month, Open of the Quarter, Open of the Year
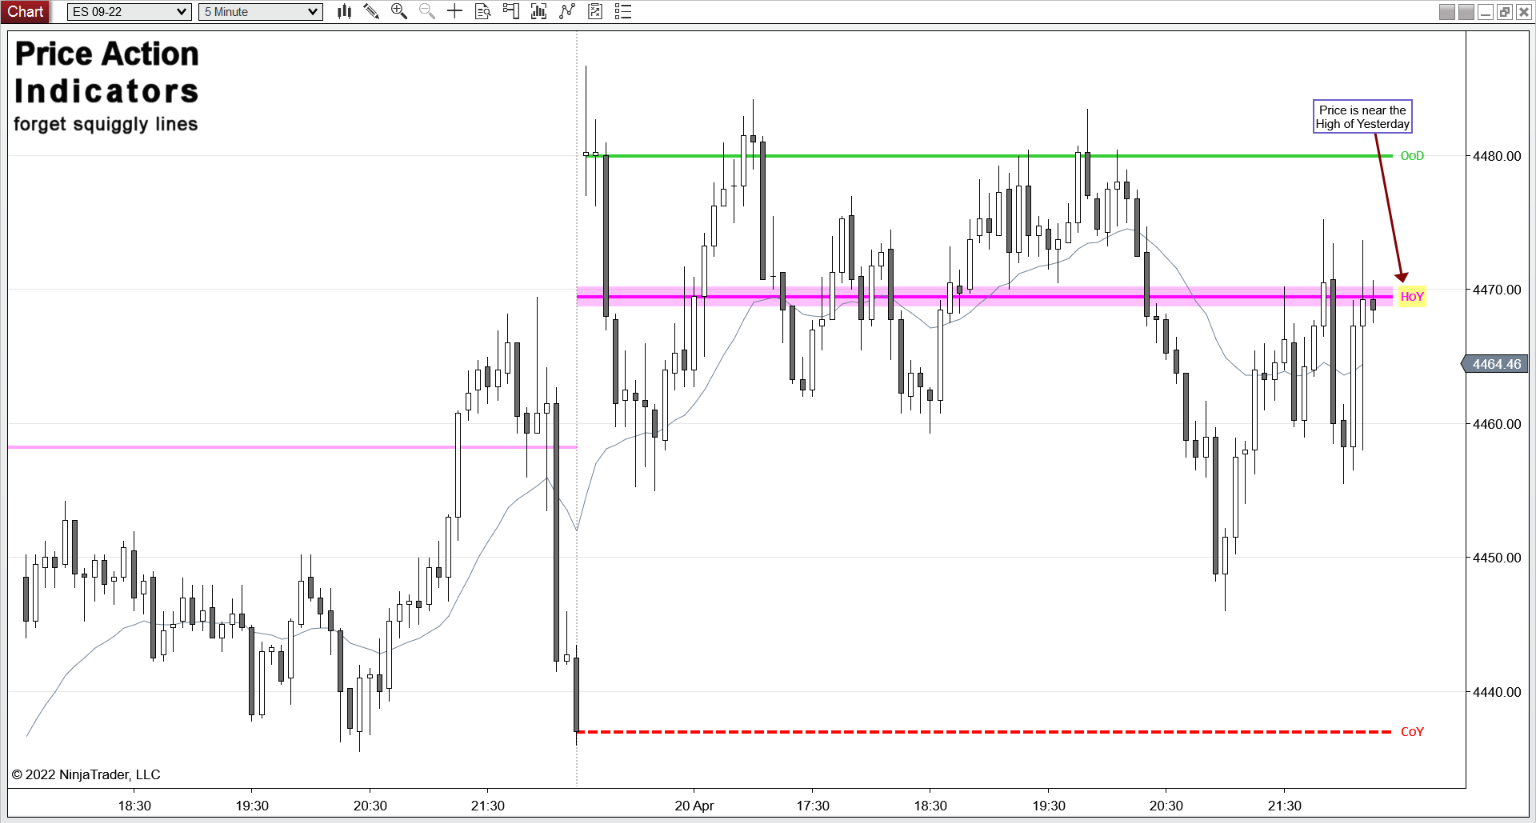
- Highlight S/R levels and alert when price is close to a level (only for OoD and HLC of Yesterday)
- Price Action around the Open of the Day and High/Low/Close of Yesterday
- Breakout and failed Breakout of the High/Low of Yesterday
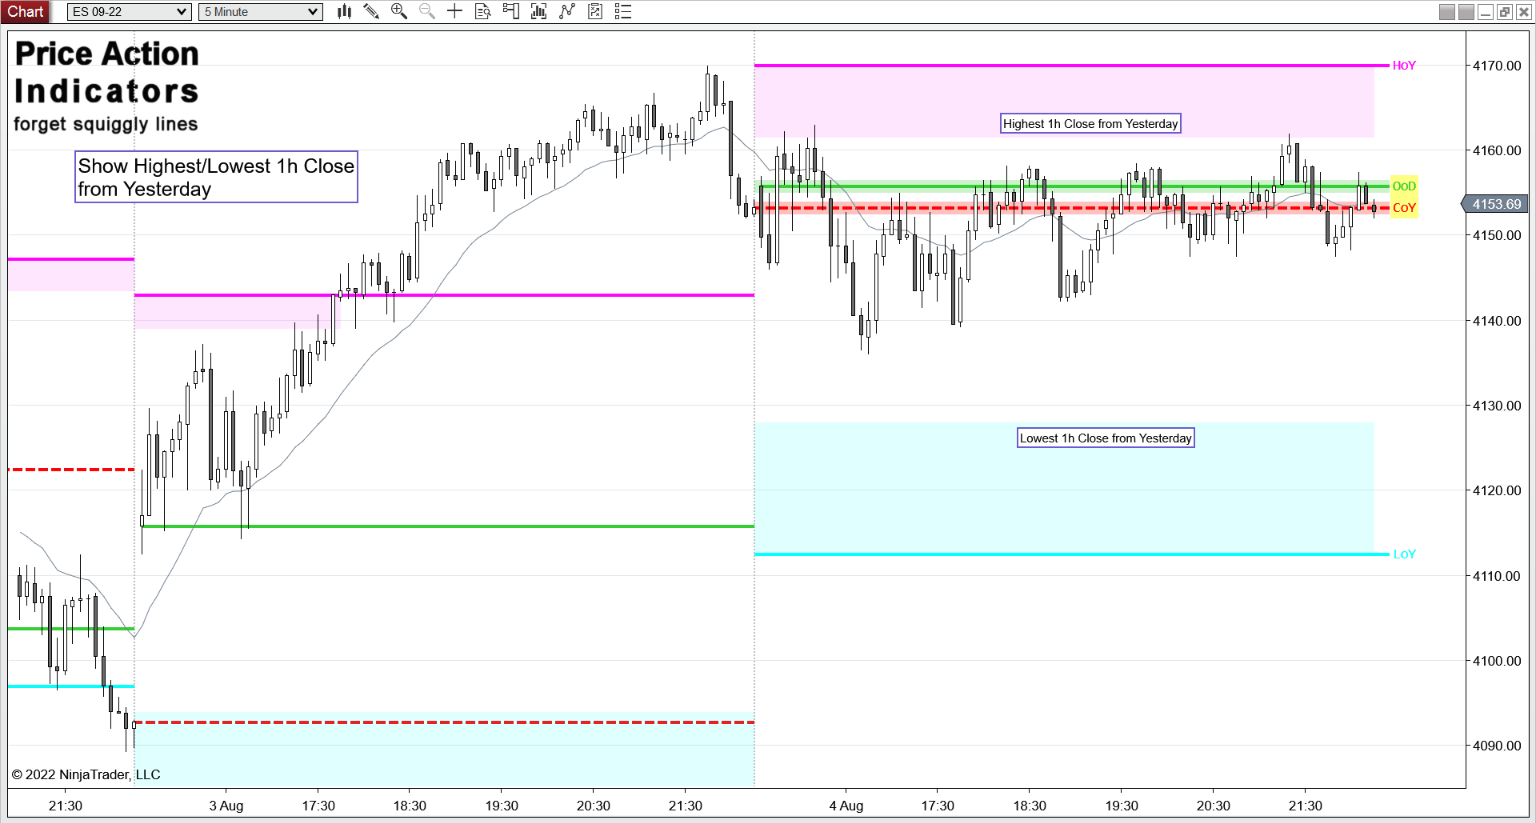
- Highest and Lowest One Hour Close from Yesterday (minute chart only)
- Hourly RTH or ETH Opens (on a 5 minute chart only)
- Reversals, Pullbacks, Breakouts and Tails around the Hourly Open Price (on a 5 minute chart only)
- Touch of EMA 20 (Al Brooks – Moving Average 20 Gap Bar)
- Gap Bar with EMA 20 (Al Brooks – Moving Average Gap Bar)
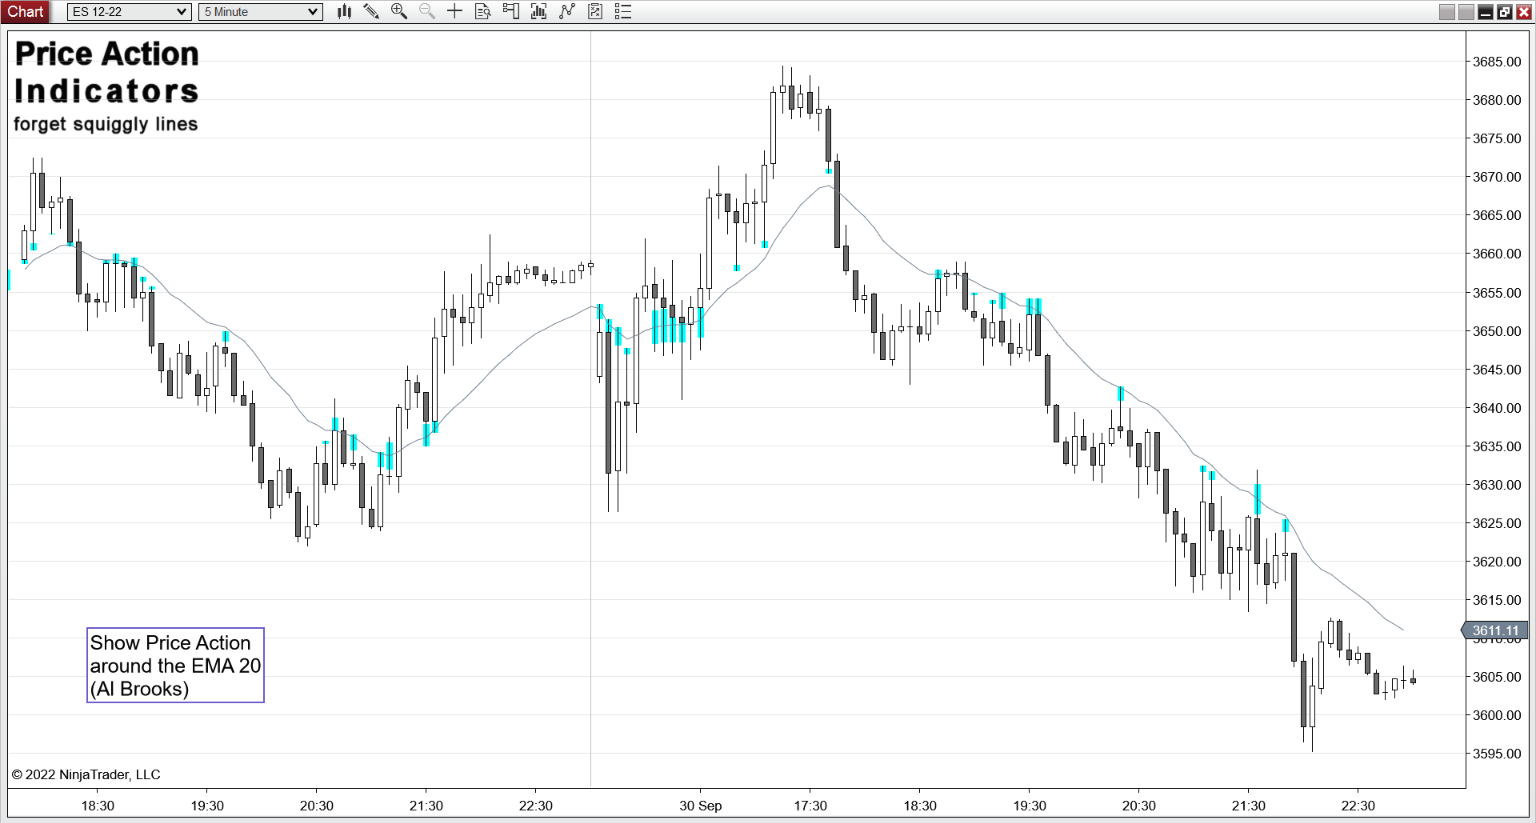
- Price Action around the EMA 20
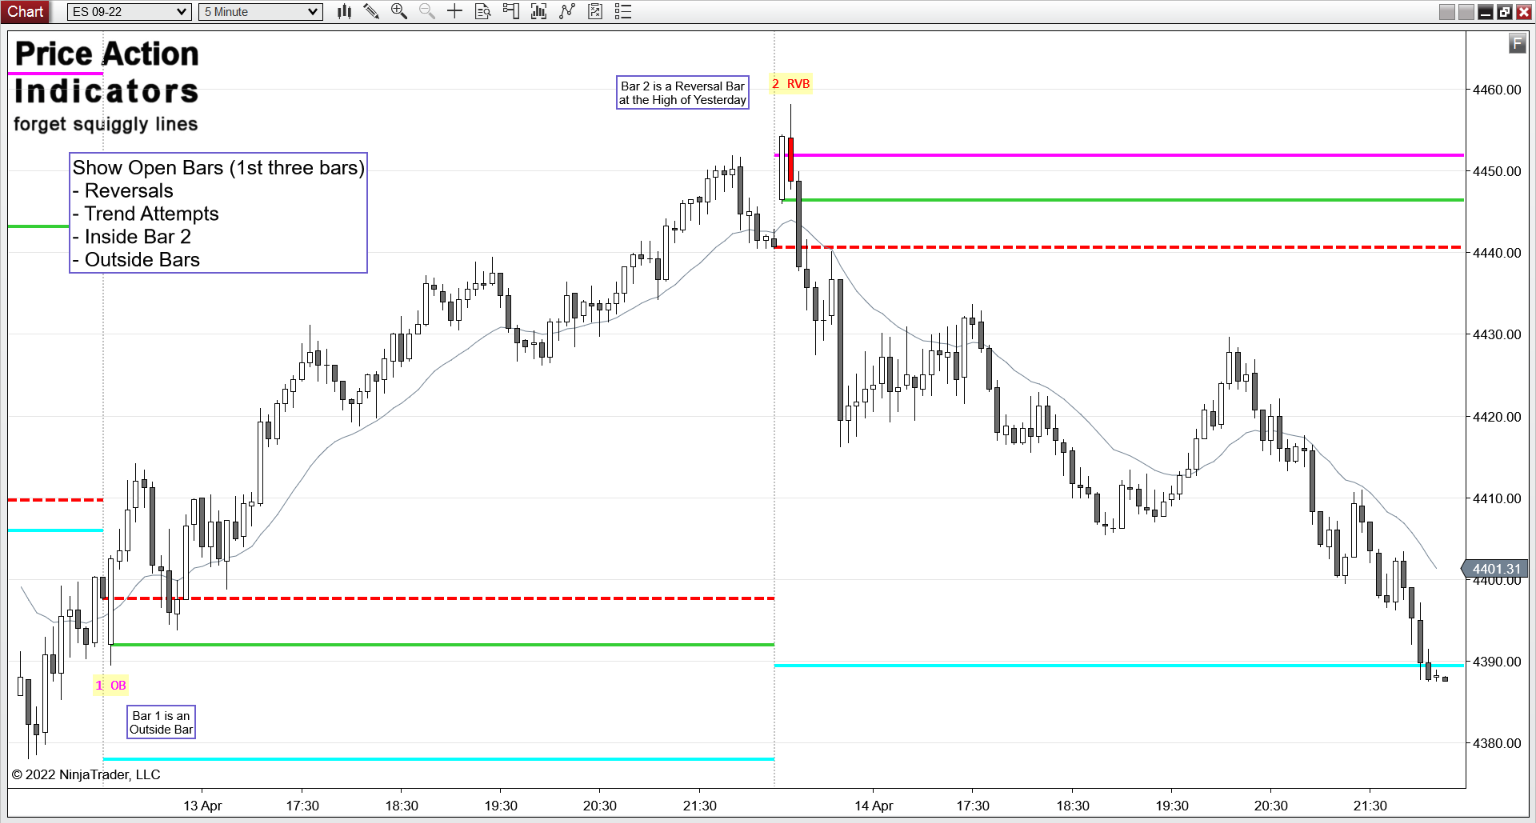
- Possible Opening Setups on the 1st three bars of the day (up to 15 minute RTH chart only)
- Possible Reversal Times for the E-mini (on a 5 minute RTH chart only)
- Highlight Outside & Inside Bars (also Inside Bar variant)
- Time Frame Continuity for higher time frames (on minute chart only)
- Real-time signals (Calculate: On price change)
- certain features do not work on:
Volumetric, Range, Tick, Volume, Second, HeikenAshi, Kagi, Renko, PointAndFigure and LineBreak charts
Please try before you buy!
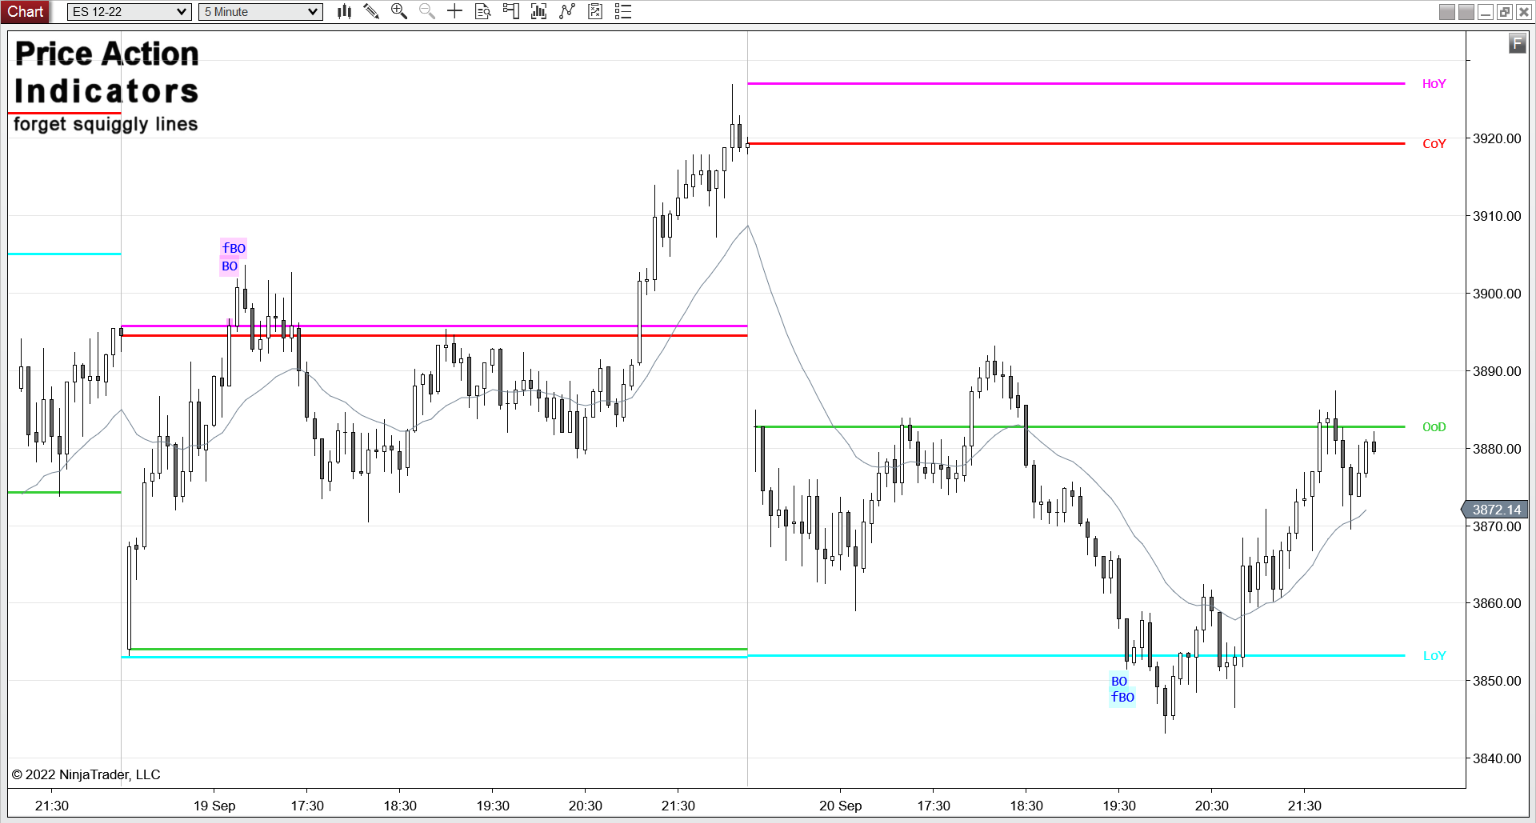
Example Charts


Download a 30 day trial version
Buy now for US $ 280
you get redirected to our reseller MyCommerce/Digital River/Share-it to place your order
to order you need your NinjaTrader® Machine ID (please see FAQ)
for license activation (please see FAQ)
Please contact us for a discount if you’re going to buy more than one indicator.
Support / Resistance
Support and resistance are important levels where lots of buyers and sellers are willing to trade a security. A support level is a level price tends to bounce off, find support as it falls. A resistance level is a level price tends to find resistance as it rises.
Although single lines look nice on a chart, levels need to be seen as zones.
Like Al Brooks is saying here “One of the most useful rules in trading is that if something resembles a reliable pattern, it will likely behave like the reliable pattern. In any case, nothing is ever perfect or certain, so close is usually close enough.”
Every swing point can be considered a potential support or resistance level, although major swing highs and lows hold more significance, as they are visible to higher time frame traders too.
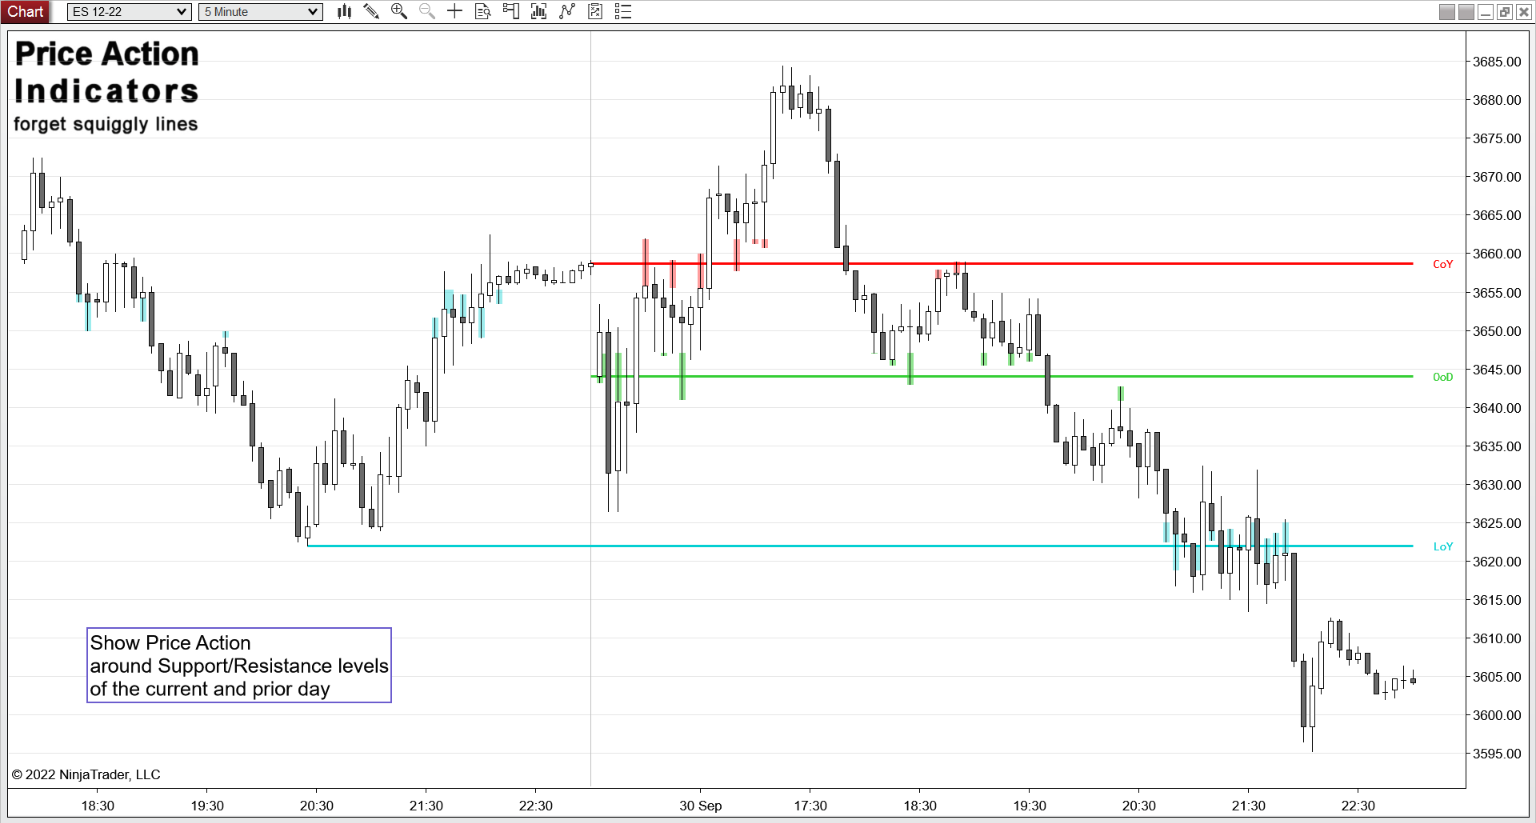
As a Day Trader horizontal Support and Resistance from the current and prior days are your main concern.
> Open/High/Low of today
> High/Low/Close of yesterday
> High/Low/Close of the day before yesterday
> Open of the week, the month, the quarter and the year
> Highest and Lowest One Hour Close from Yesterday
If price is close to the High/Low/Close of Yesterday, the Open of the Day and the Open of the Week Price Action at the corresponding support/resistance level can be highlighted.
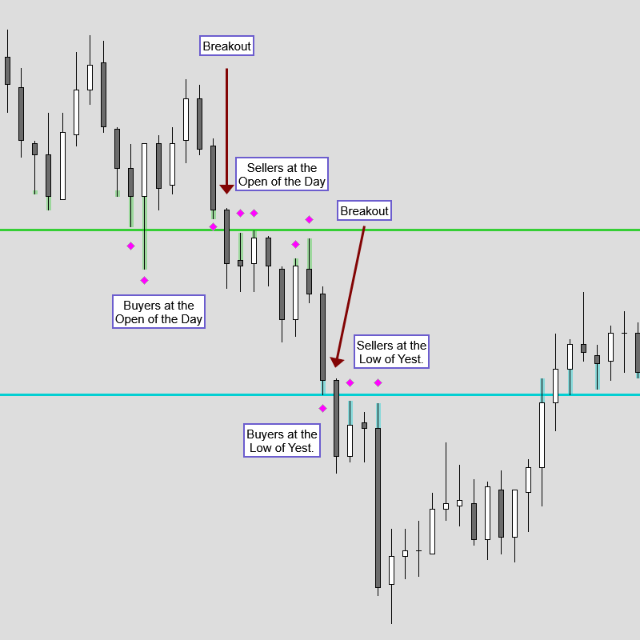
Failed Breakout
At support/resistance levels one can often observe failed breakouts, where price penetrates the level, but then fails to continue in that direction and instead reverses.
Breakout Test or Pullback
If price continues through a support level, that level often becomes a new resistance level. The opposite is true; a broken resistance level often becomes a new support level.
Whipsaw
A whipsaw is highly volatile price action, that mostly forms around important support/resistance levels. Price is making sharp movements (multiple reversals) often in a tight trading range.
Dynamic Support/Resistance
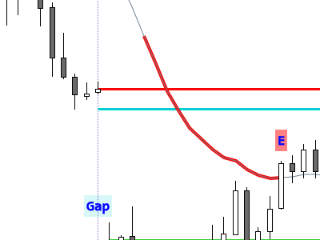
If there are no daily support/resistance levels around the current price range (e.g. on a large gap) one can use the Hourly Open levels and/or the EMA 20 as dynamic support/resistance levels.
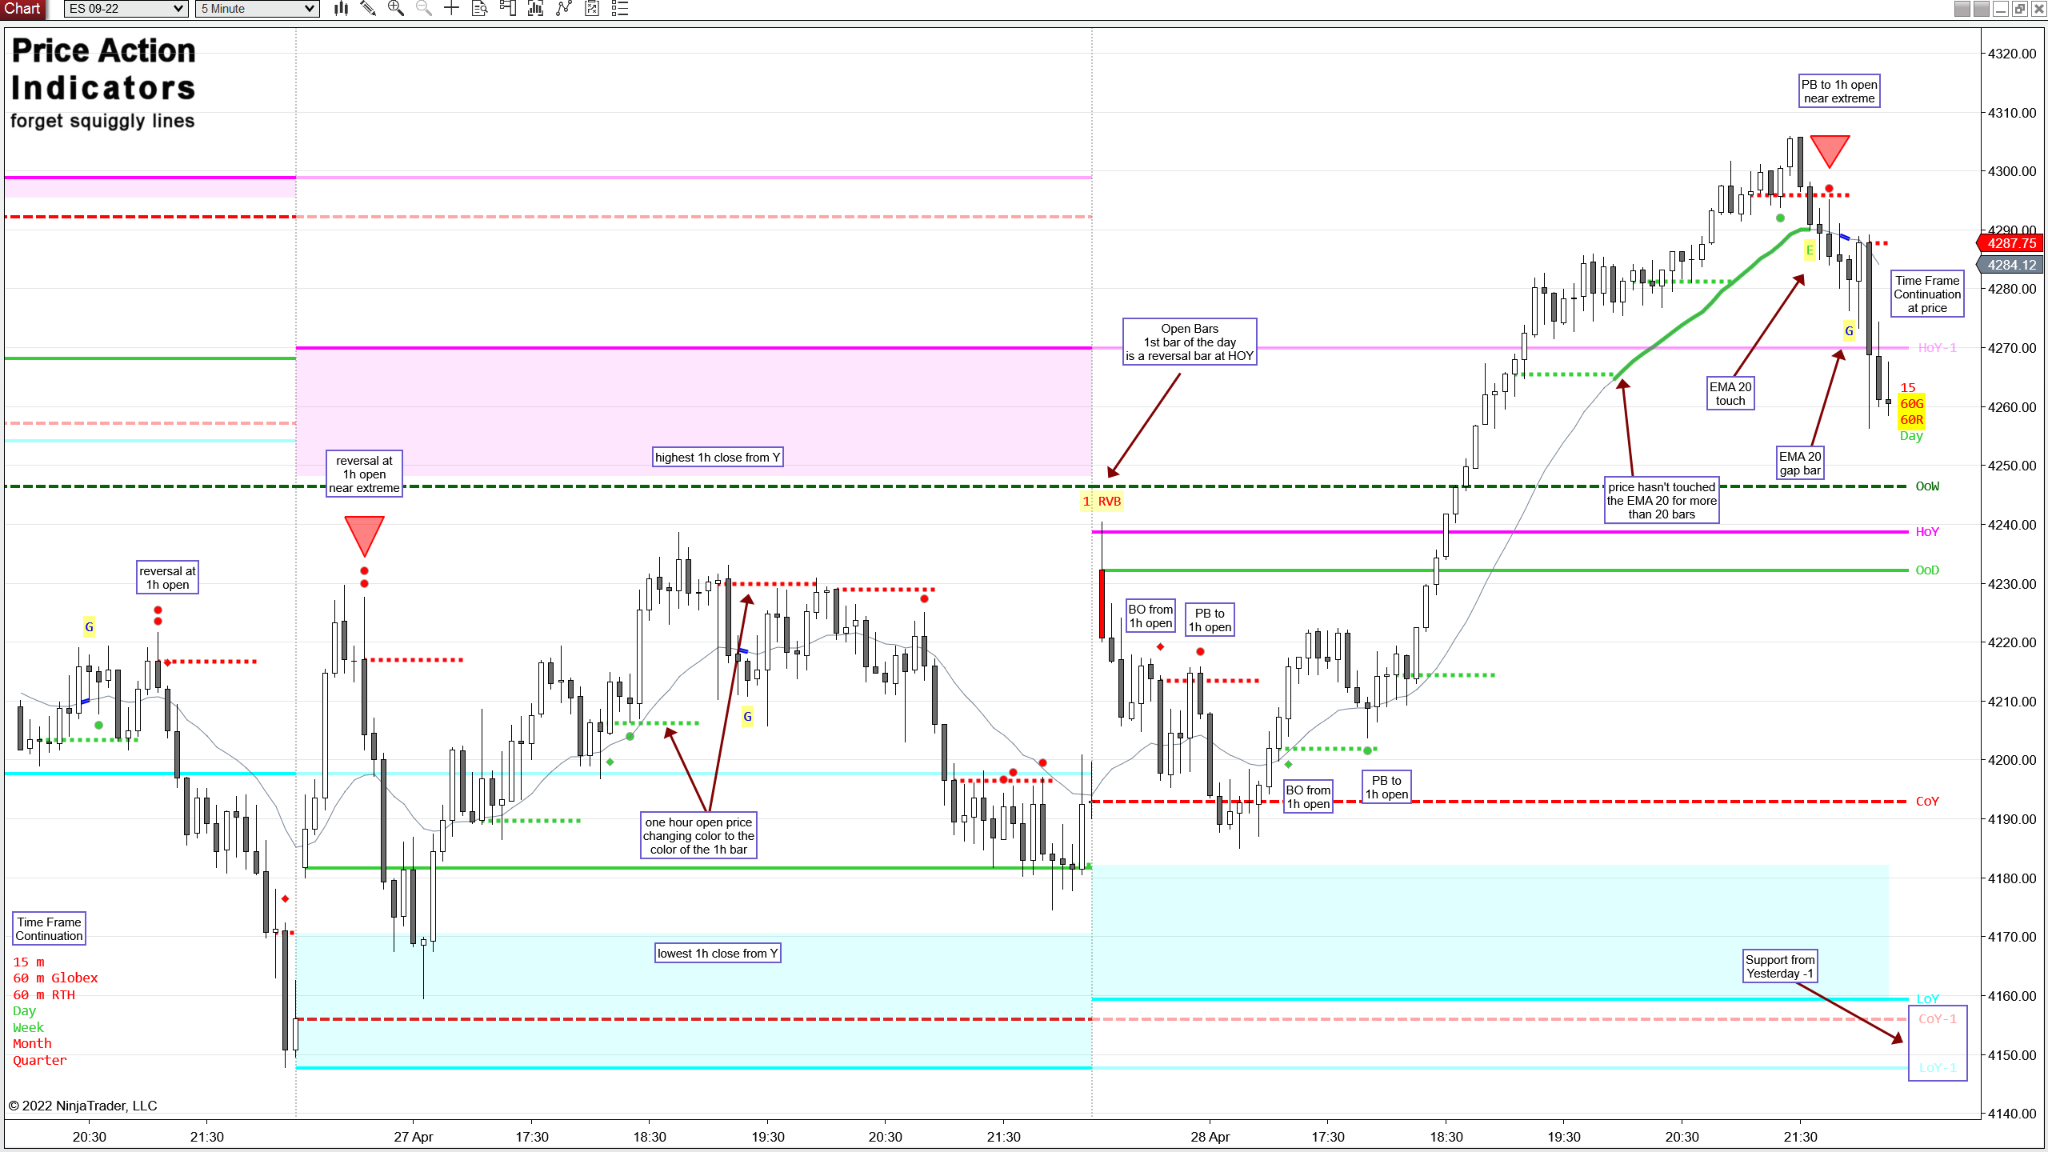
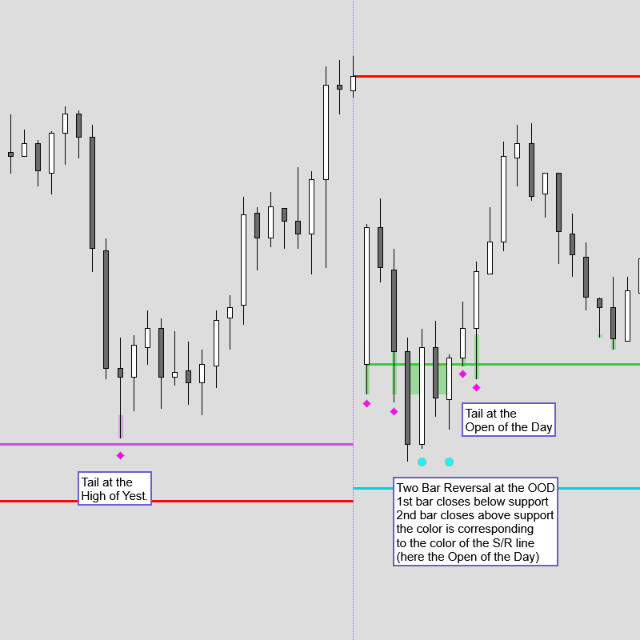
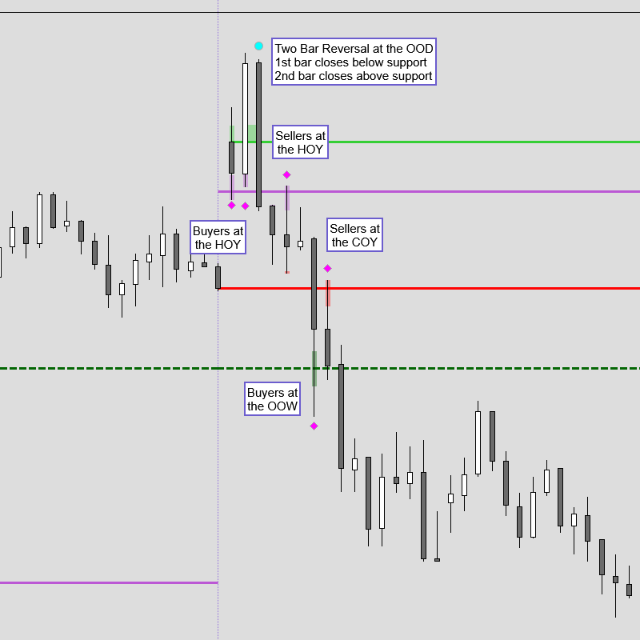
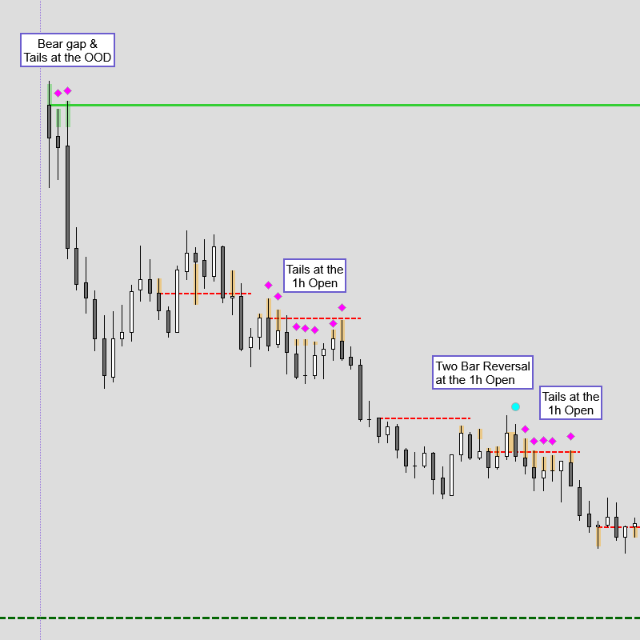
Below are a couple of examples of price action at support/resistance. I used these colors for Open of the Day, High of Yesterday, Low of Yesterday, Close of Yesterday.
I’ve added the dots and diamonds to highlight the tails and 2BR the indicator is marking up. Tails and 2BR are marked up / highlighted with the same color as the Support/Resistance line.
 |
Failed Breakout of the OOD there are no two consecutive Closes below the level, two higher lows |
 |
Failed Breakout of the OOD and LOY, Tails at the OOW, three tails and two with a higher low Breakout of the COY and Breakout Pullback/Test about an hour later |
 |
Failed Breakout of the OOD and Close back below HOY Breakout Test HOY Breakout Test COY |
 |
Two nice Breakouts with following Breakout Test OOD and LOY |
 |
Large gap down, below the LOY use the Hourly Open as Breakout Pullback/Test levels |
 |
Wedge reversal below LOY Breakout Test of the Hourly Open |
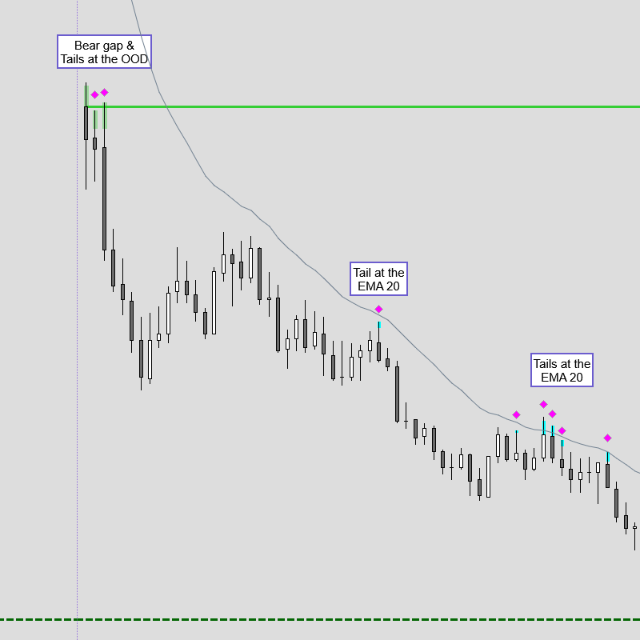 |
Large gap down, below the LOY use the EMA 20 as a variable resistance level |
 |
Whipsaw around the LOY micro Wedge just before the breakout lower |
Video-Link: https://www.youtube.com/watch?v=Mfbn9EZkiqg
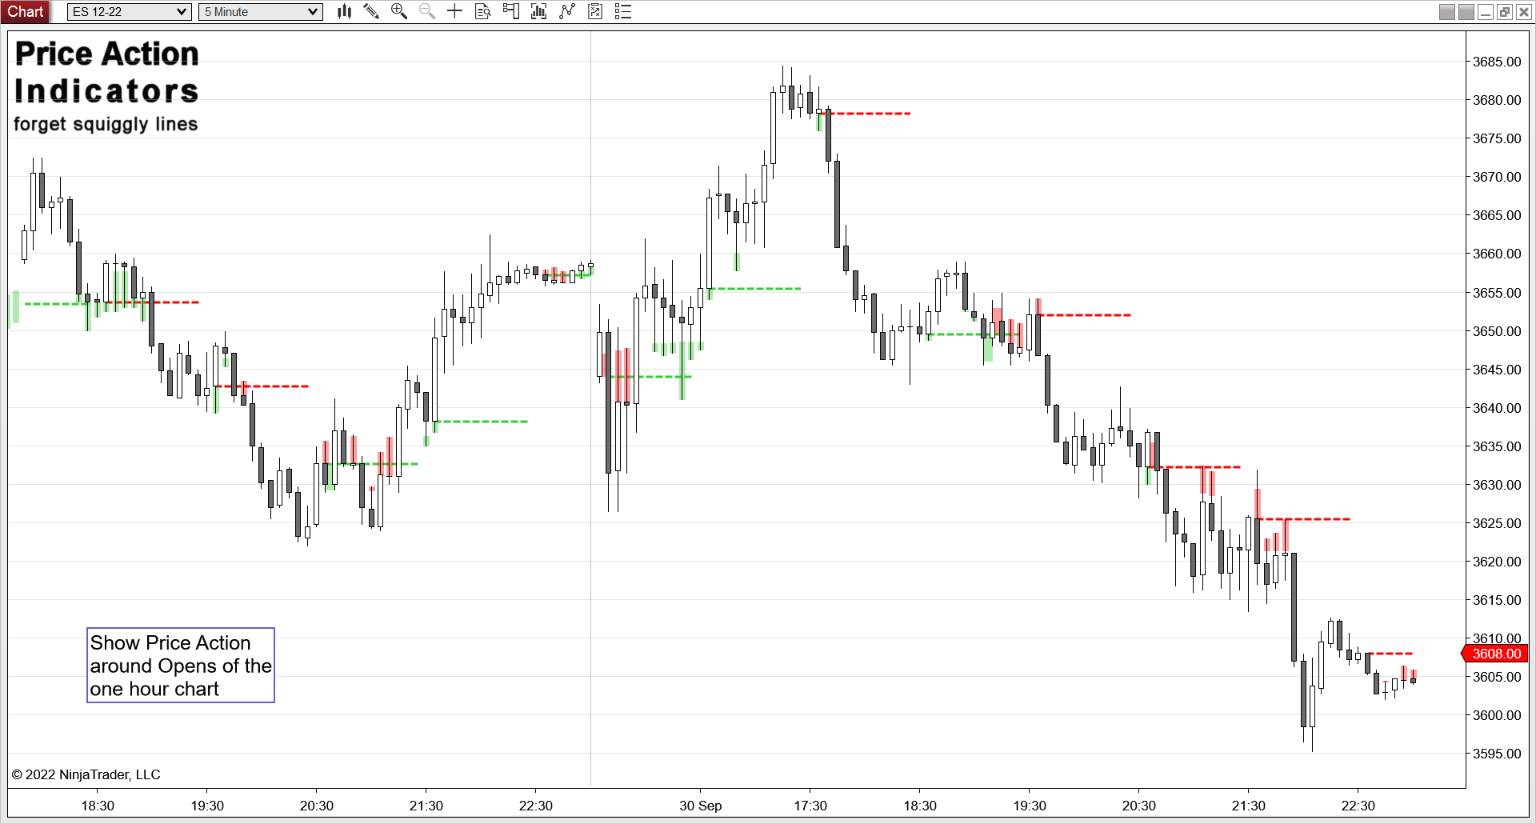
Hourly Open
Every Open is support and resistance. The Open of today as well as the Opens from the lower time frames like the 60/120/240 minute charts. Traders from these time frames are often active just before/at or after a new bar opens.
The horizontal lines for the closed one hour bars have the colors of the corresponding one hour bars. The line for the current one hour bar changes color according to the color of the current one hour bar until that closes.
Either use the Globex (XX:00) or the RTH Open (XX:30) for the Open of the one hour bars.
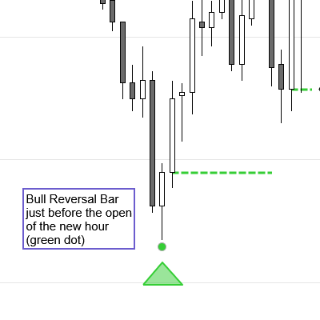
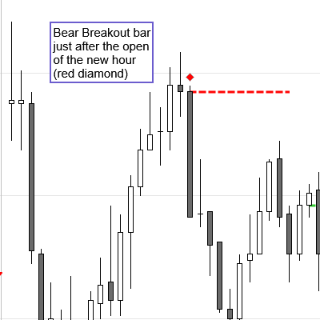
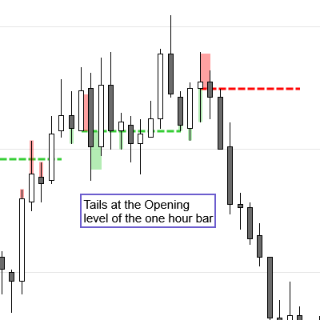
The indicator tries to find Reversals or Breakouts that happen around the Open of one hour bars. Pullbacks or Tails at these levels can be highlighted also.
 |
Reversal Bar or 2BR (Dots) just before, at and just after the Hourly Open |  |
Pullback (small triangle up/down) to the Hourly Open |
 |
Breakout Bar (Square) at and just after the Hourly Open |  |
“Head Fake” a strong breakout bar followed by a counter trend bar of similar size |
If such a signal occurs at a local extreme a larger red or green triangle is added to the signal (1st and 3rd chart below).
the RVB is at a local extreme |
(diamond changed to square) |
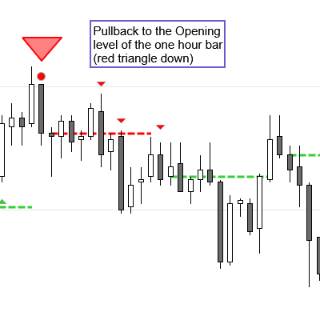
the 2BR is at a local extreme (large red triangle) |
 |
Video-Link: https://www.youtube.com/watch?v=cD2u4ZiLirY
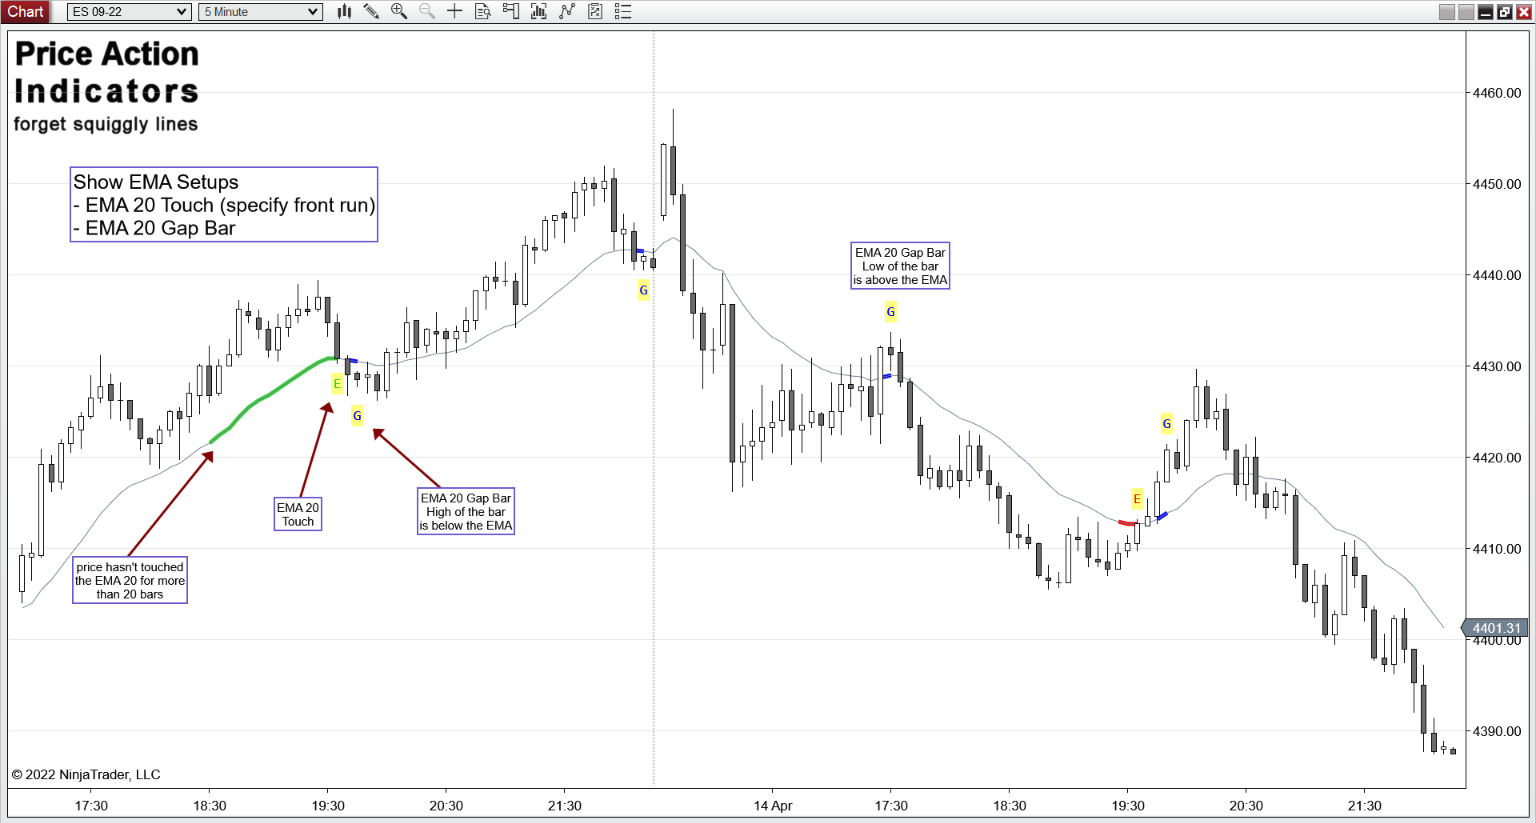
EMA 20 (20 bar Exponential Moving Average)
Al Brooks uses the EMA 20 on his 5-minute charts as support and resistance to find pullbacks in a trend.
In strong trends a Pullback to the EMA 20 is often a high probability trade for a test of the extreme of the trend. Sometimes a 2nd or 3rd attempt of a Moving Average Gap Bar is necessary to continue the trend.
If price is close to the EMA 20, Price Action at that support/resistance level can be highlighted also.

The indicator tries to find the following setups:
- Touch of EMA 20 after 20 or more bars (Al Brooks – Moving Average 20 Gap Bar)
Adjust the minimum number of bars away from EMA 20 as well as an envelope to front run and set an alert.
After the set condition is met (e.g. price isn’t touching the EMA for more than 20 bars) the EMA changes color. A bar that touches the EMA or the set envelope after that is marked with “E”.
“E” was changed to “ET”.
 |
 |
Video-Link: https://www.youtube.com/watch?v=xFhqr7_iwQ8
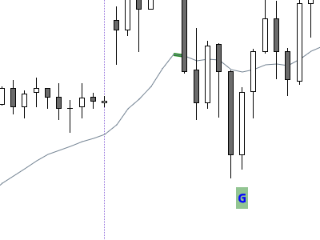
- Gap Bar with EMA 20 (Al Brooks – Moving Average Gap Bar)
 |
 |
Video-Link: https://www.youtube.com/watch?v=HJLyE7hV9Fo
Read more here:
2 HM: If Away from EMA for Two or More Hours, Then Fade EMA and First EMA Gap Bar
https://www.brookstradingcourse.com
https://www.brookspriceaction.com/
https://www.brookspriceaction.com/portal.php?page=4
Bars / Opening Setups
The indicator tries to find Reversals (RVB, 2BR), Trend Attempts and Breakout setups (IB2, IOI, II) on the 1st three bars of the day.
 |
Bull gap and trend attempt look to get long (signal on bar 2 and 2nd signal on bar 3) |
 |
Bear gap and trend attempt look to sell (signal on bar 3) |
 |
Bear gap and trend attempt look to sell (signal on bar 2) |
 |
Bull Reversal Bar on the 2nd bar of the day (a long setup) |
 |
Bear Two Bar Reversal on the 2nd bar of the day (a short setup) |
 |
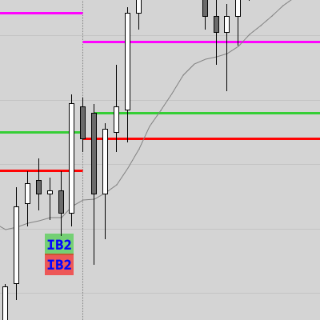
Inside Bar on the 2nd bar of the day (IB2) defines the 10 minute opening range and is a breakout mode setup. (here more likely long) |
 |
Inside Bar on the 2nd bar of the day (IB2) defines the 10 minute opening range and is a breakout mode setup. (here more likely short) |
 |
Inside Bar on the 2nd bar of the day (IB2) defines the 10 minute opening range and is a breakout mode setup. |
 |
an Outside Bar for the 1st bar of the day is often a trading range watch for a fade (here a micro double top) |
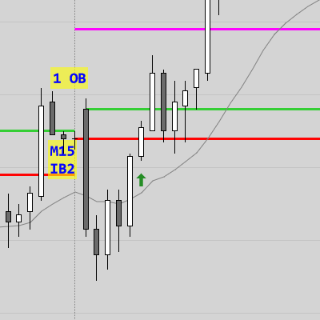  |
Inside Bar on the 2nd bar of the M15 chart (bar 6 on the M5 chart)
(corresponding M15 chart below) |
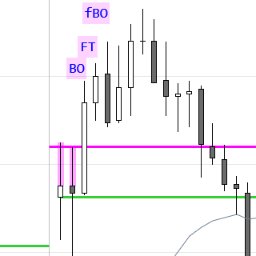
Bars / Breakout HoY/LoY
The High and Low of Yesterday (HoY and LoY) are important levels where lots of buyers and sellers are willing to trade a security. The indicator shows breakouts of these levels (close above HoY and close below LoY) .
The bar after the breakout bar is an important indication for a successful or a failed breakout. A Follow Through (FT) bar with the same color as the breakout bar can be an indication for a successful breakout. A Follow Through bar with an opposite color can be considered a failed breakout.
 |
Breakout of HoY and Follow Through bar |  |
Breakout of HoY and failed breakout |
 |
Bear gap, below LoY |  |
Bull gap, above HoY |
 |
Bear gap, below LoY and Follow Through bar |
 |
Breakout of HoY and Follow Through bar the next bar after the FT bar is a failed breakout signal |
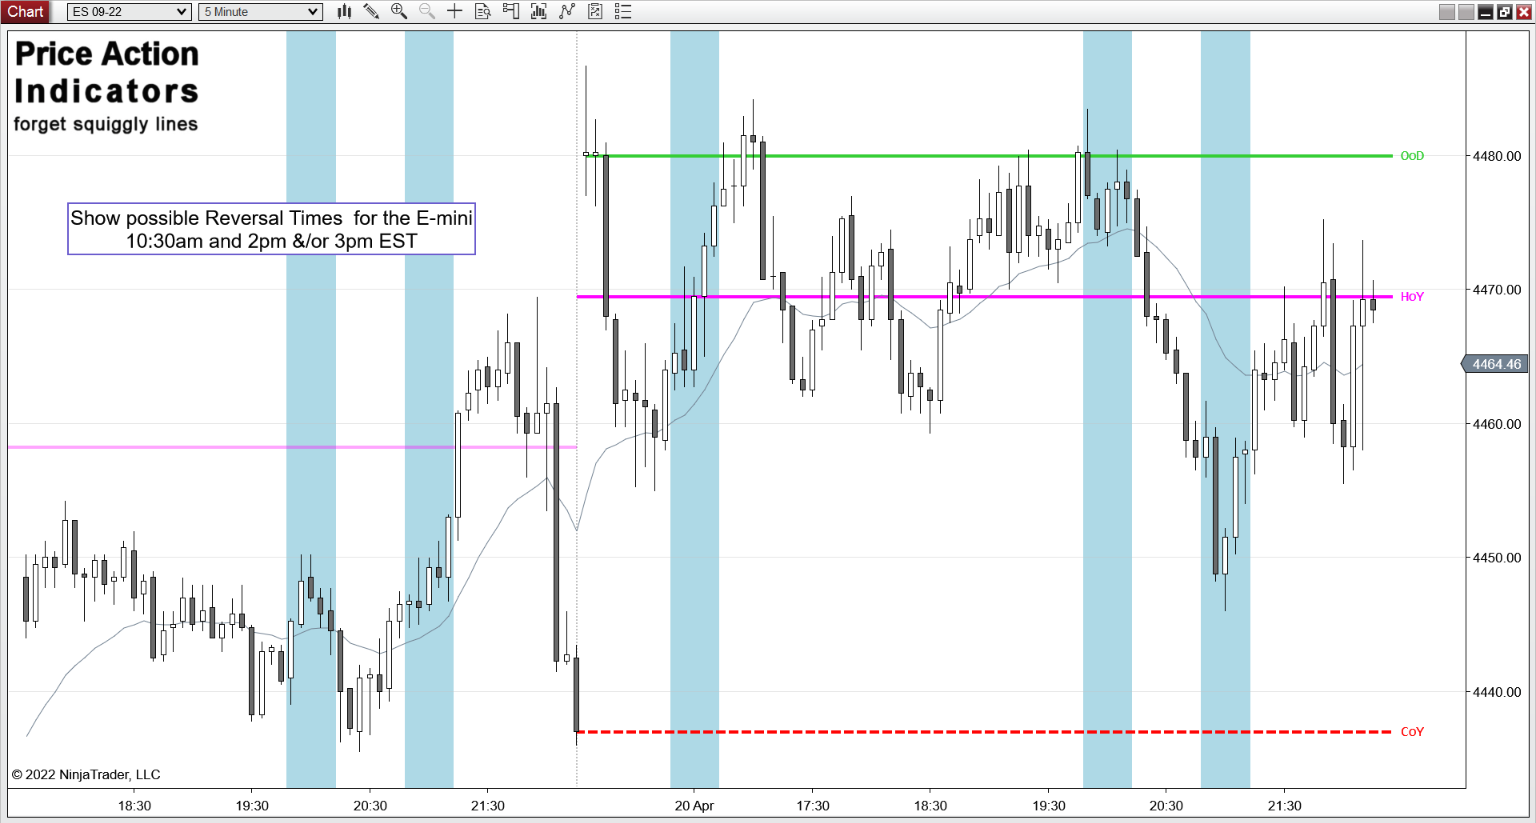
Bars/Reversal Times
The regular trading hours (RTH) of a trading day can be broken down into three sessions. Morning, lunch and afternoon. The most important difference between the three parts is volume. Lunch time usually has the lowest volume. Trading a reversal during the morning and afternoon session often has a higher probability than trading it during lunch time.
10:30 am (EST) – Morning reversal, one hour into the RTH session
02:00 pm (EST) – Trend Day 11:30 Stop Run Pullback to Trap You Out (Al Brooks)
03:00 pm (EST) – Reversal into the close (occasionally)
Read more about Seasonality here:
Inside the Trading Day: Intraday Seasonality
What Is Seasonality In Trading? – The Robust Trader
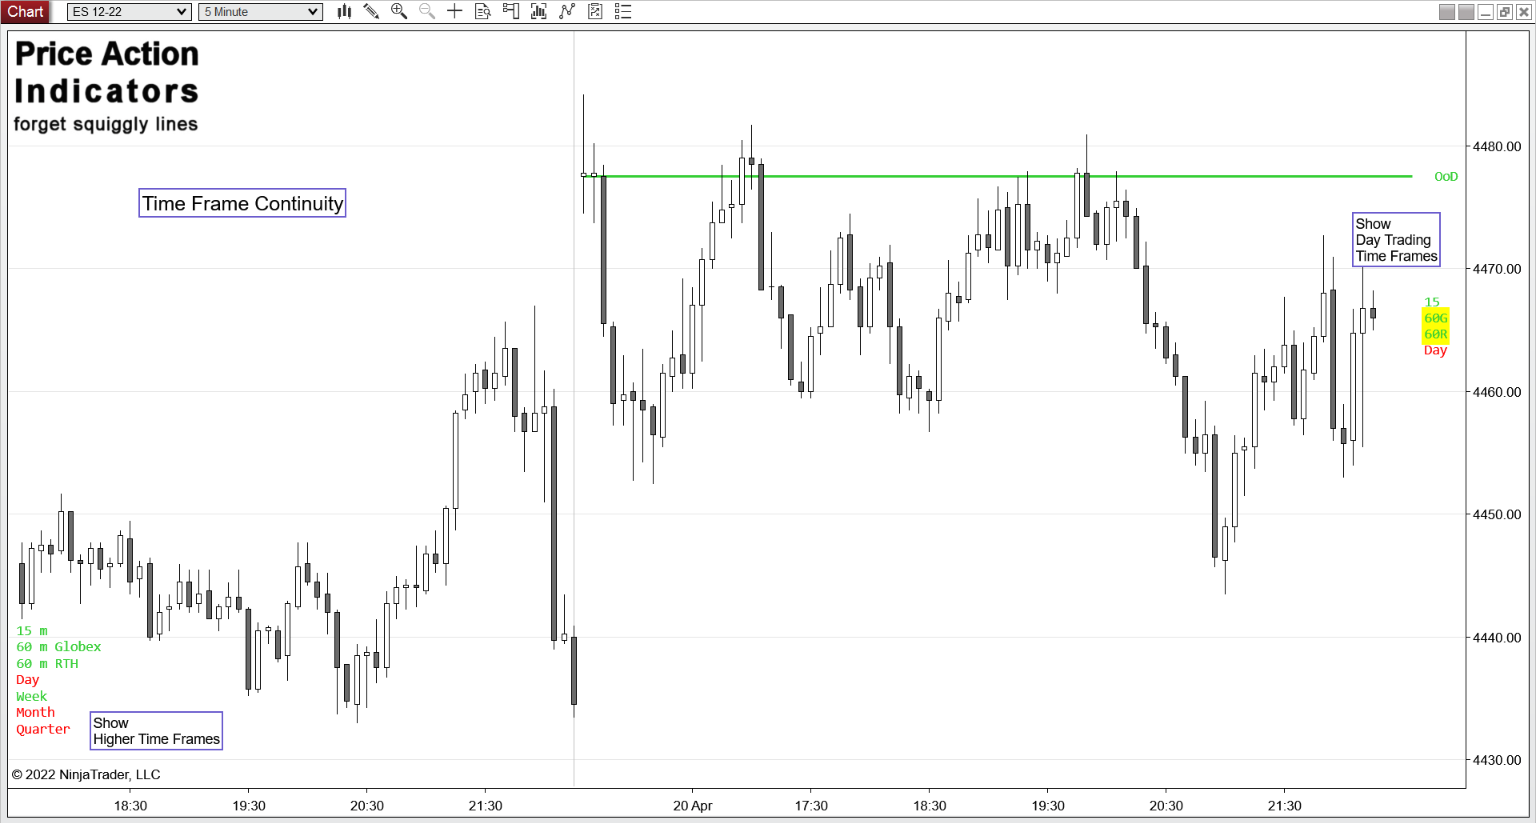
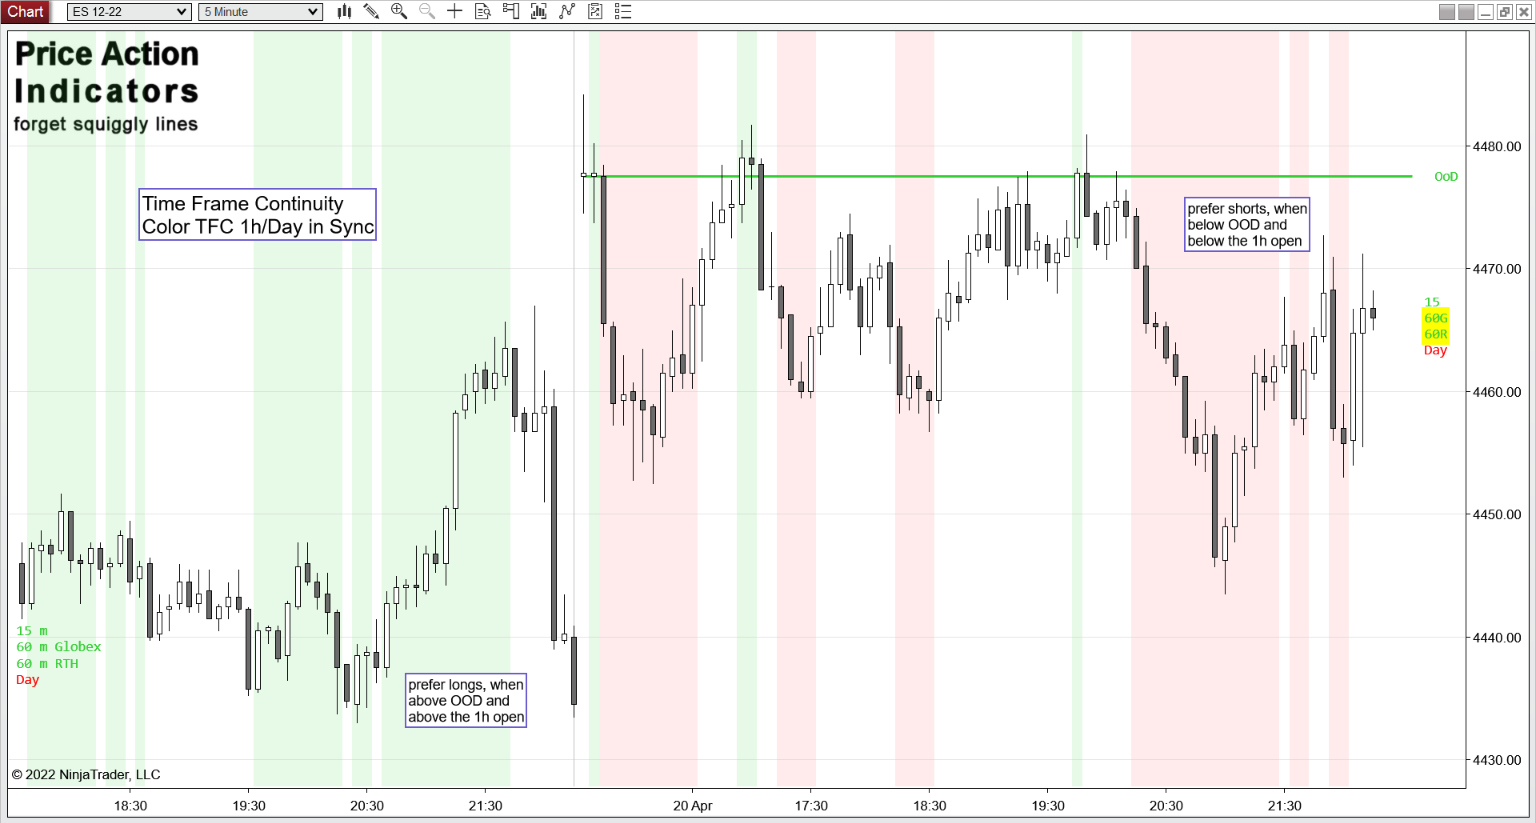
Time Frame Continuity
Time Frame Continuity (TFC) tries to evaluate a trading instrument in terms of multiple higher time frames. E.g. as a day trader who is trading the 5 minute chart, identifying whether buyers or sellers are active on the 60 minute and on the daily time frame is pretty important.
Ideally, one wants to trade in the same direction as the higher time frames are indicating. If our trading instrument is trading above the opening prices of the daily and 60 minute bars one should look for setups to enter long. Vice versa for shorts.
The indicator can color the background of the chart if the 60minute and the daily time frame are in sync (bars have the same color).
- prefer shorts, when below the Open Of the Day (OOD) and below the 60 minute open
- prefer longs, when above the OOD and above the 60 minute open
What are the settings?
Indicator name: PADayTradingSRPro
Support/Resistance
|
|
Hourly Open
|
|
EMA 20
|
|
Bars & Time Frame Continuity
|
|
Colors and Text
|
|


“Show Last Only”
PADayTradingSRPro calculates “on price change” and uses a lot of processing power. That’s why it has a limit for the number of bars on a real-time chart.
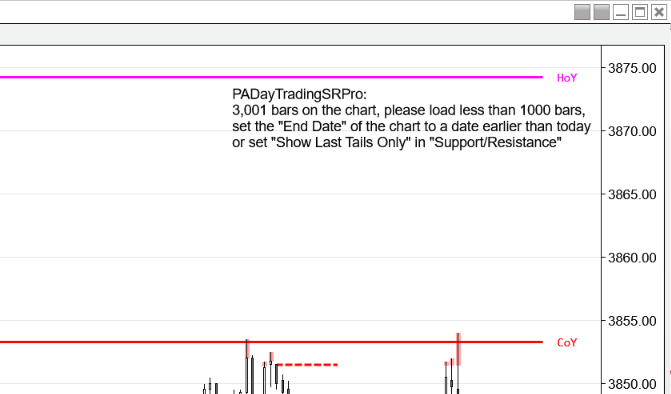
If you see a message like that on your chart “please load less than 1000 bars, set the “End Date” of the chart to a date earlier than today or set “Show Last Only” please do the following:
For back testing set the chart End Date to e.g. yesterday. For trading (real-time chart) check the “Show Last Only” property in the indicator settings, which will speed up a reload of the chart and indicator also.
NinjaTrader 8 has problems on charts with many chart object, especially if it’s a real-time chart where ticks coming in fast, NT7 didn’t.
https://ninjatrader.com/support/forum/forum/ninjatrader-8/indicator-development/1053732-indicator-takes-a-lot-more-time-to-calculate-loaded-on-the-current-day
back to Indicators