
E-mini ES 5 min RTH charts
Here are a couple of the latest blog posts, that highlight the signals of the BuySellPressure indicator in context.
red box = selling pressure
green box = buying pressure.
To find out more about the abbreviations or setups on the charts visit the corresponding blog pages or check out this post.

https://www.priceactionindicators.com/2020/04/30/e-mini-es-2020-04-30/
A prime Price Action trade to take today.
Two small pushes up in that tight MC from the LOD, as well as three exhaustion signals, showing decent Selling Pressure and a stall in the bull move. Shrinking bull bodies, sellers on the close of the prior bar and increasing overlap.
You’re now looking for a good bear Signal Bar or a lower high to take a short. Then you get the 1st Pullback in that tight bull MC, which is expected to be bought. After a new extreme of the bull move (the 2nd or 3rd push up) you get that decent bear Inside bar, which is also a Breakout Pullback/Test of the LOY. It’s only overlapped by the prior bar and has a good size body and close.
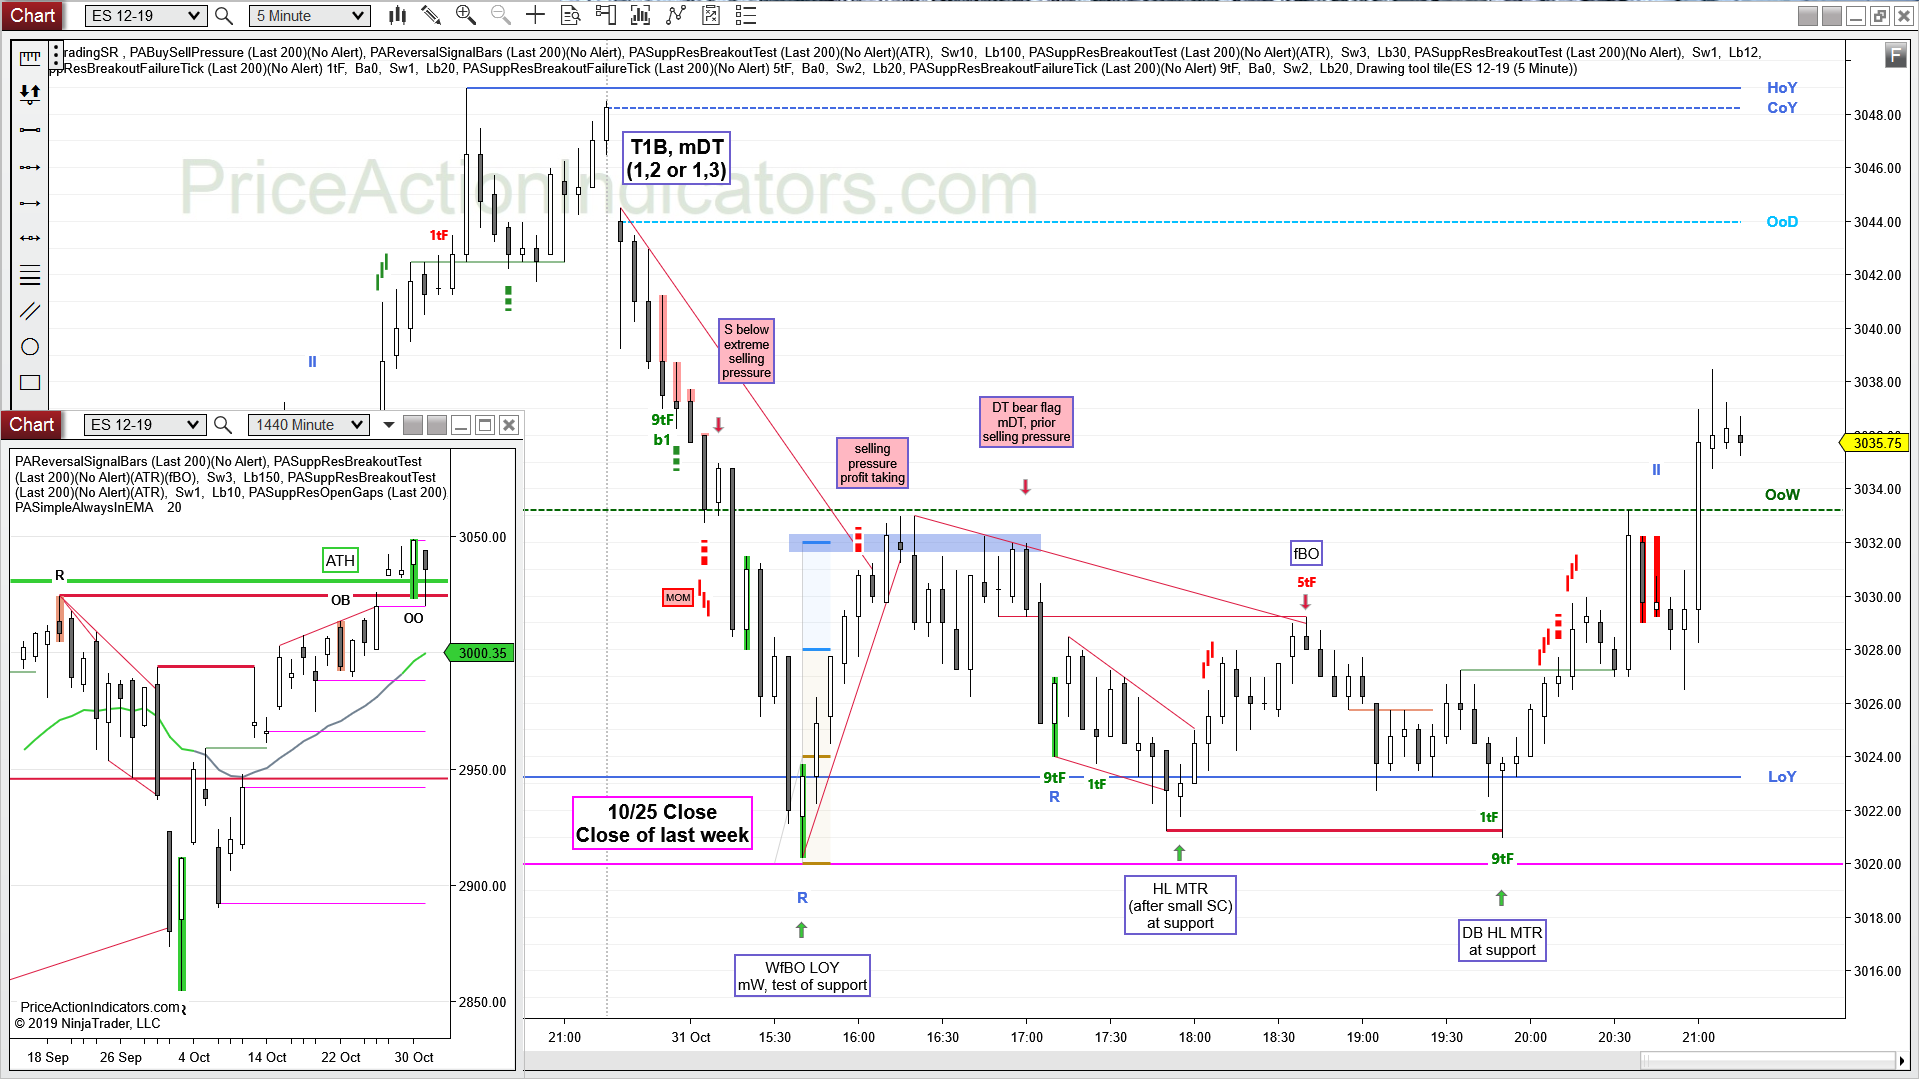
https://www.priceactionindicators.com/2019/10/31/e-mini-es-2019-10-31/
Decent Selling Pressure during the spike/micro channel from the Open of the day (decreasing upper tails, decreasing overlap and increasing bear bodies). Also Selling Pressure during the 1st pullback (shrinking bull bodies – here also because of bulls profit taking).
Get short below a bear signal bar in the pullback. If you get stopped, take the next entry. With this much Selling Pressure a test of the extreme is very likely. The HL double bottom tested the lowest close of the micro channel twice before price moved up.
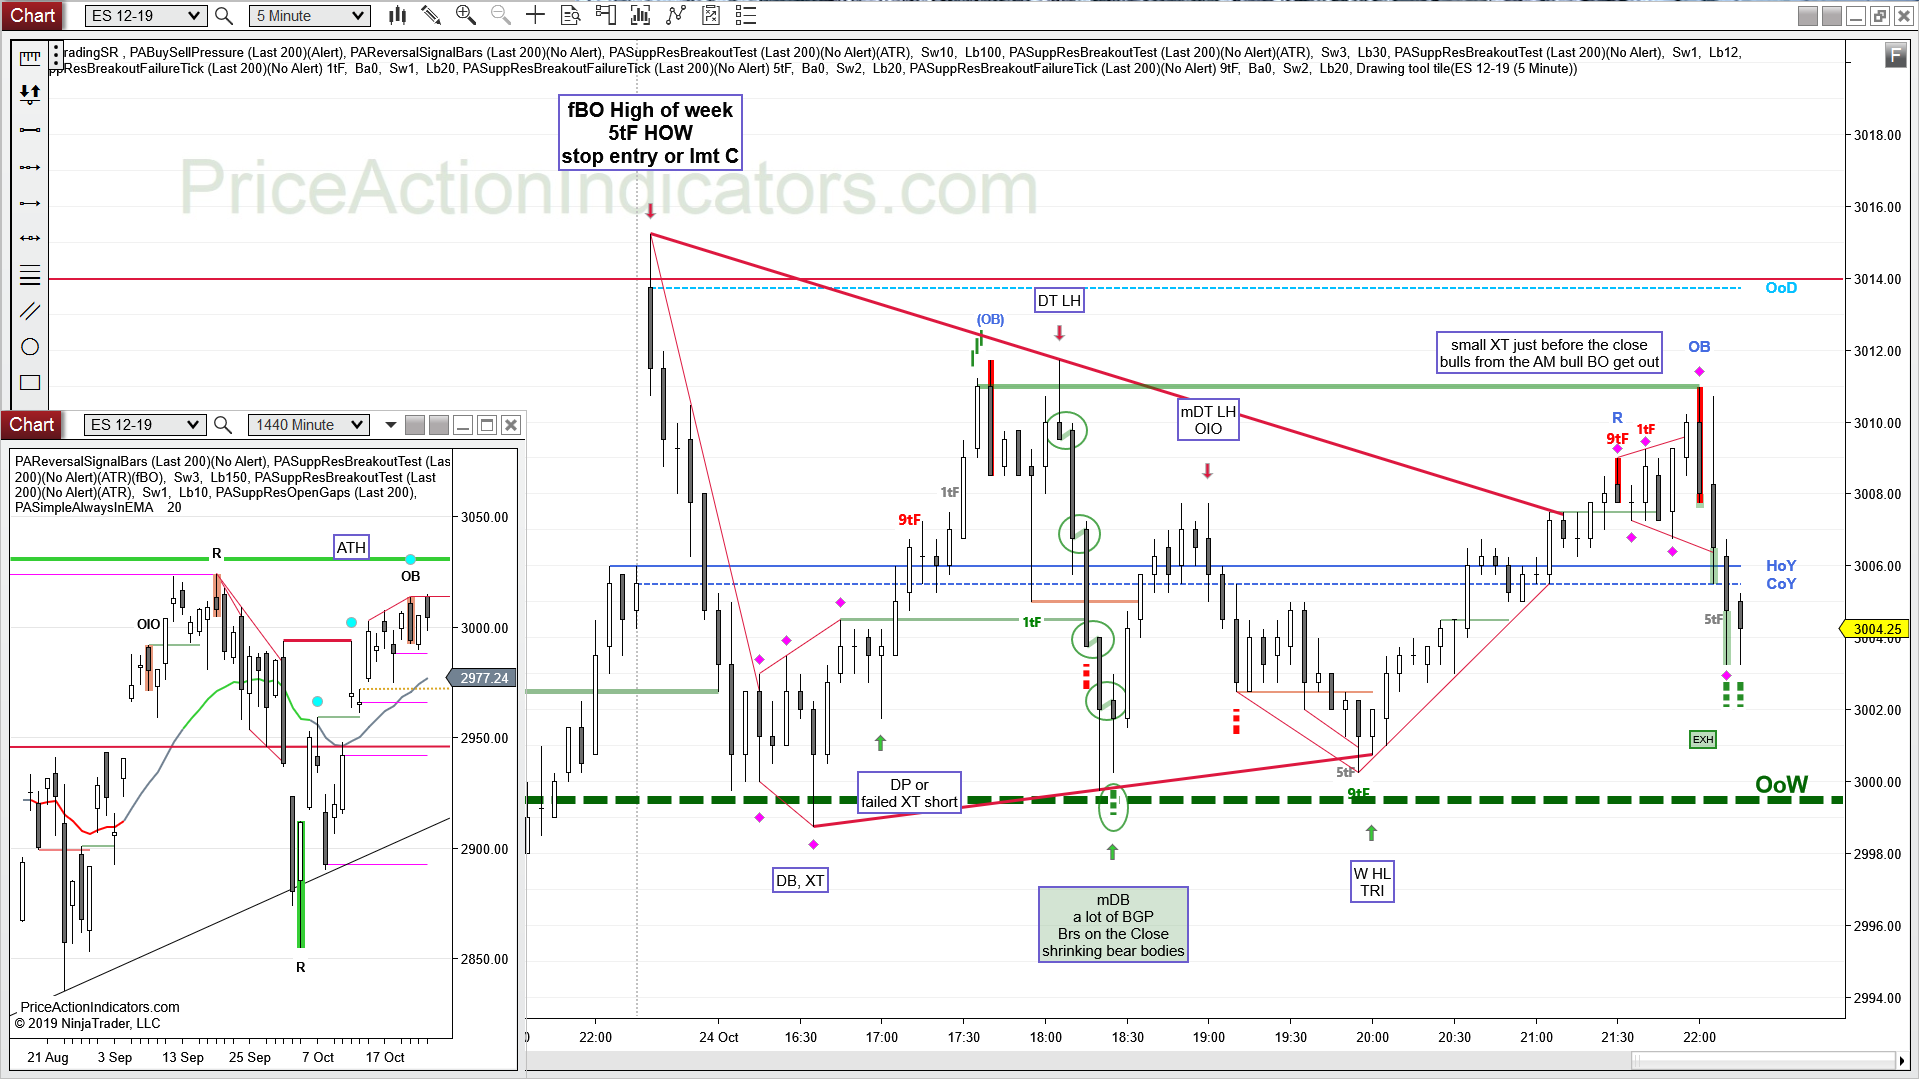
https://www.priceactionindicators.com/2019/10/24/e-mini-es-2019-10-24/
Nice Buying Pressure (Buyers on the close of the prior bar and shrinking bear bodies) in that bear spike from the Double Top Lower High when we got close to support (the Open of the week). Buy above the signal bar for the micro double bottom.
There was another set of Buying Pressure just before the close. Check out the nice Trend from the 1st bar on the next day. 2019/10/25

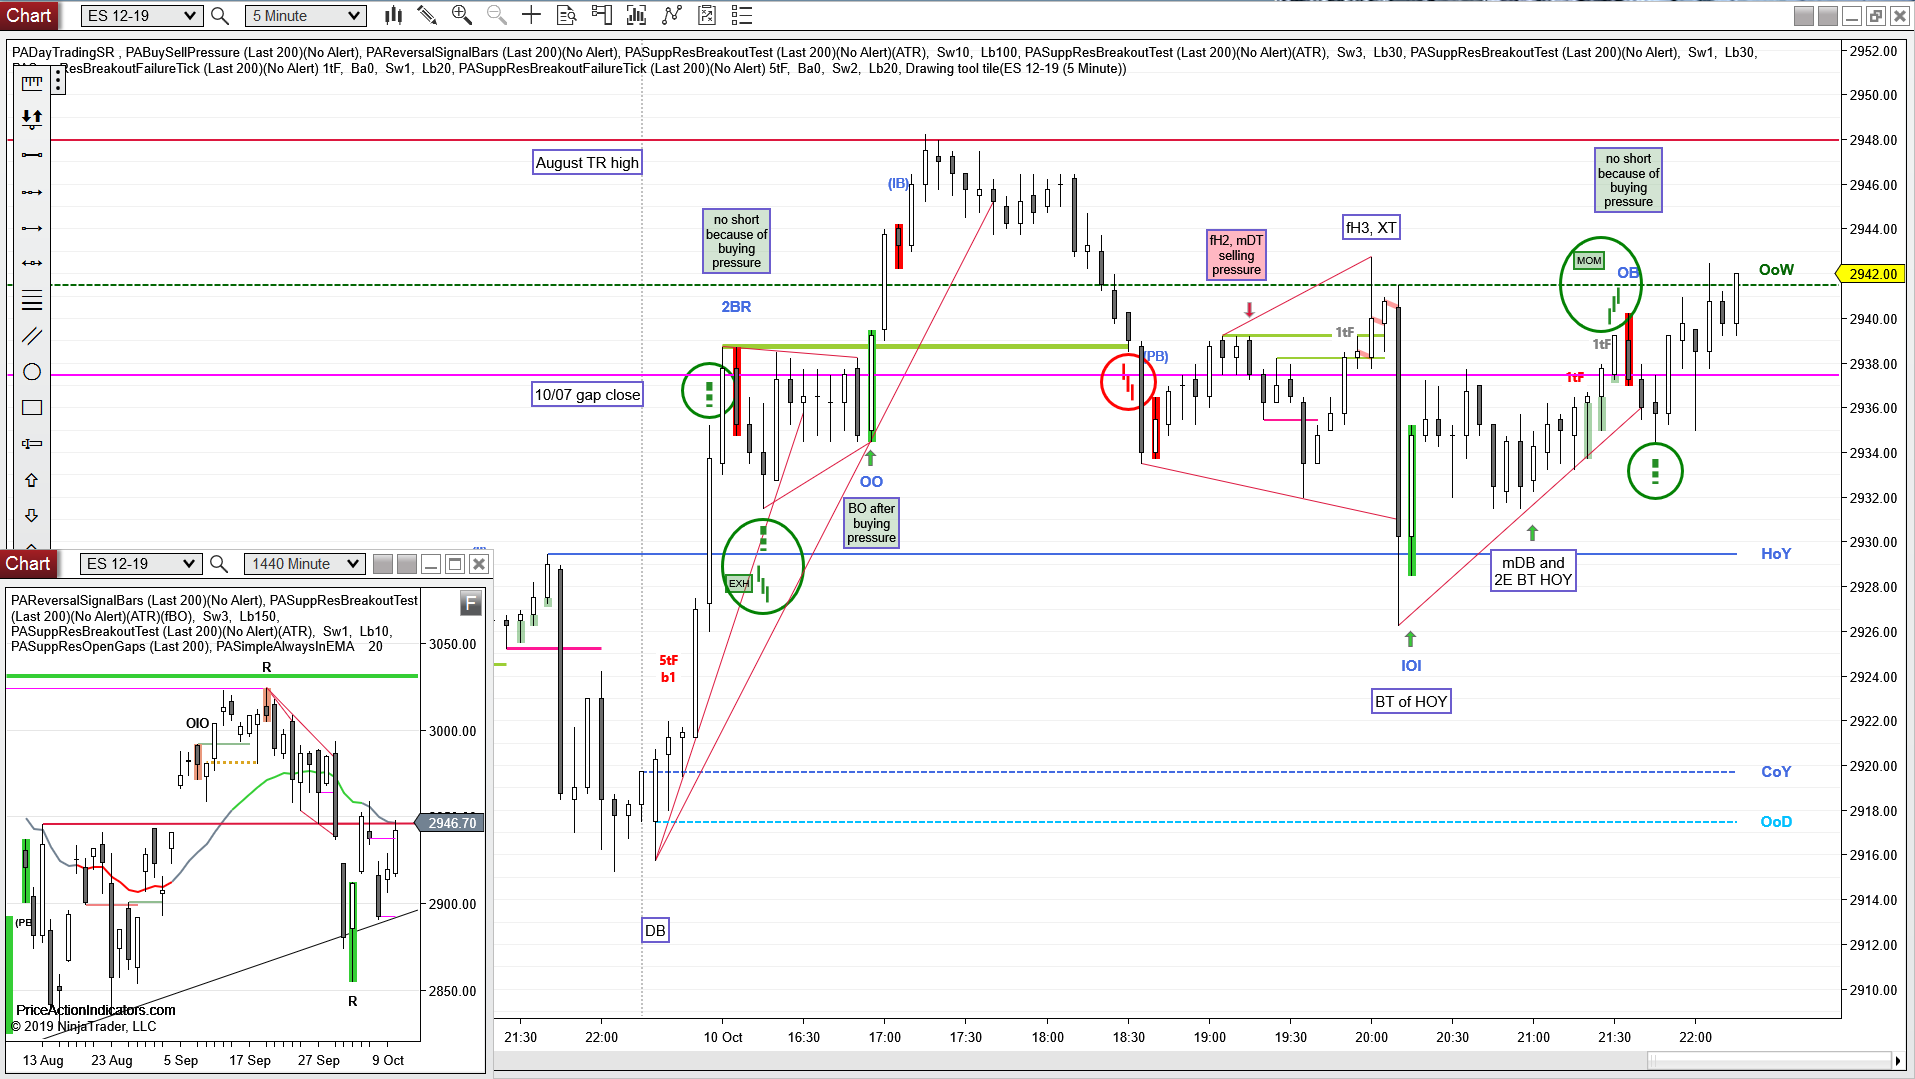
https://www.priceactionindicators.com/2019/10/16/e-mini-es-2019-10-16/
Today there were three nice signals. Two were showing Buying Pressure (increasing overlap in a bear move and decreasing overlap in a bull move) a couple of bars before a buy signal bar. The third showed Selling Pressure (shrinking bull bodies in a bull move) on the mDT, which was the HOD.
The LOD was also a 5 tick Failure Breakout of the 1st bar of the day.

https://www.priceactionindicators.com/2019/10/11/e-mini-es-2019-10-11/
The Buy Sell Pressure indicator had two nice signals, that were showing Buying Pressure just before a bull signal bar. The 1st was increasing overlap between bars and the 2nd buyers on the close of the prior bar.
https://www.priceactionindicators.com/2019/10/10/e-mini-es-2019-10-10/
The Buy Sell Pressure indicator had three Buying Pressure signals during the opening drive and on the following pullback. Also it would have kept you out of that short 10 bars before the close, showing Buying Pressure before and after a bear signal bar.
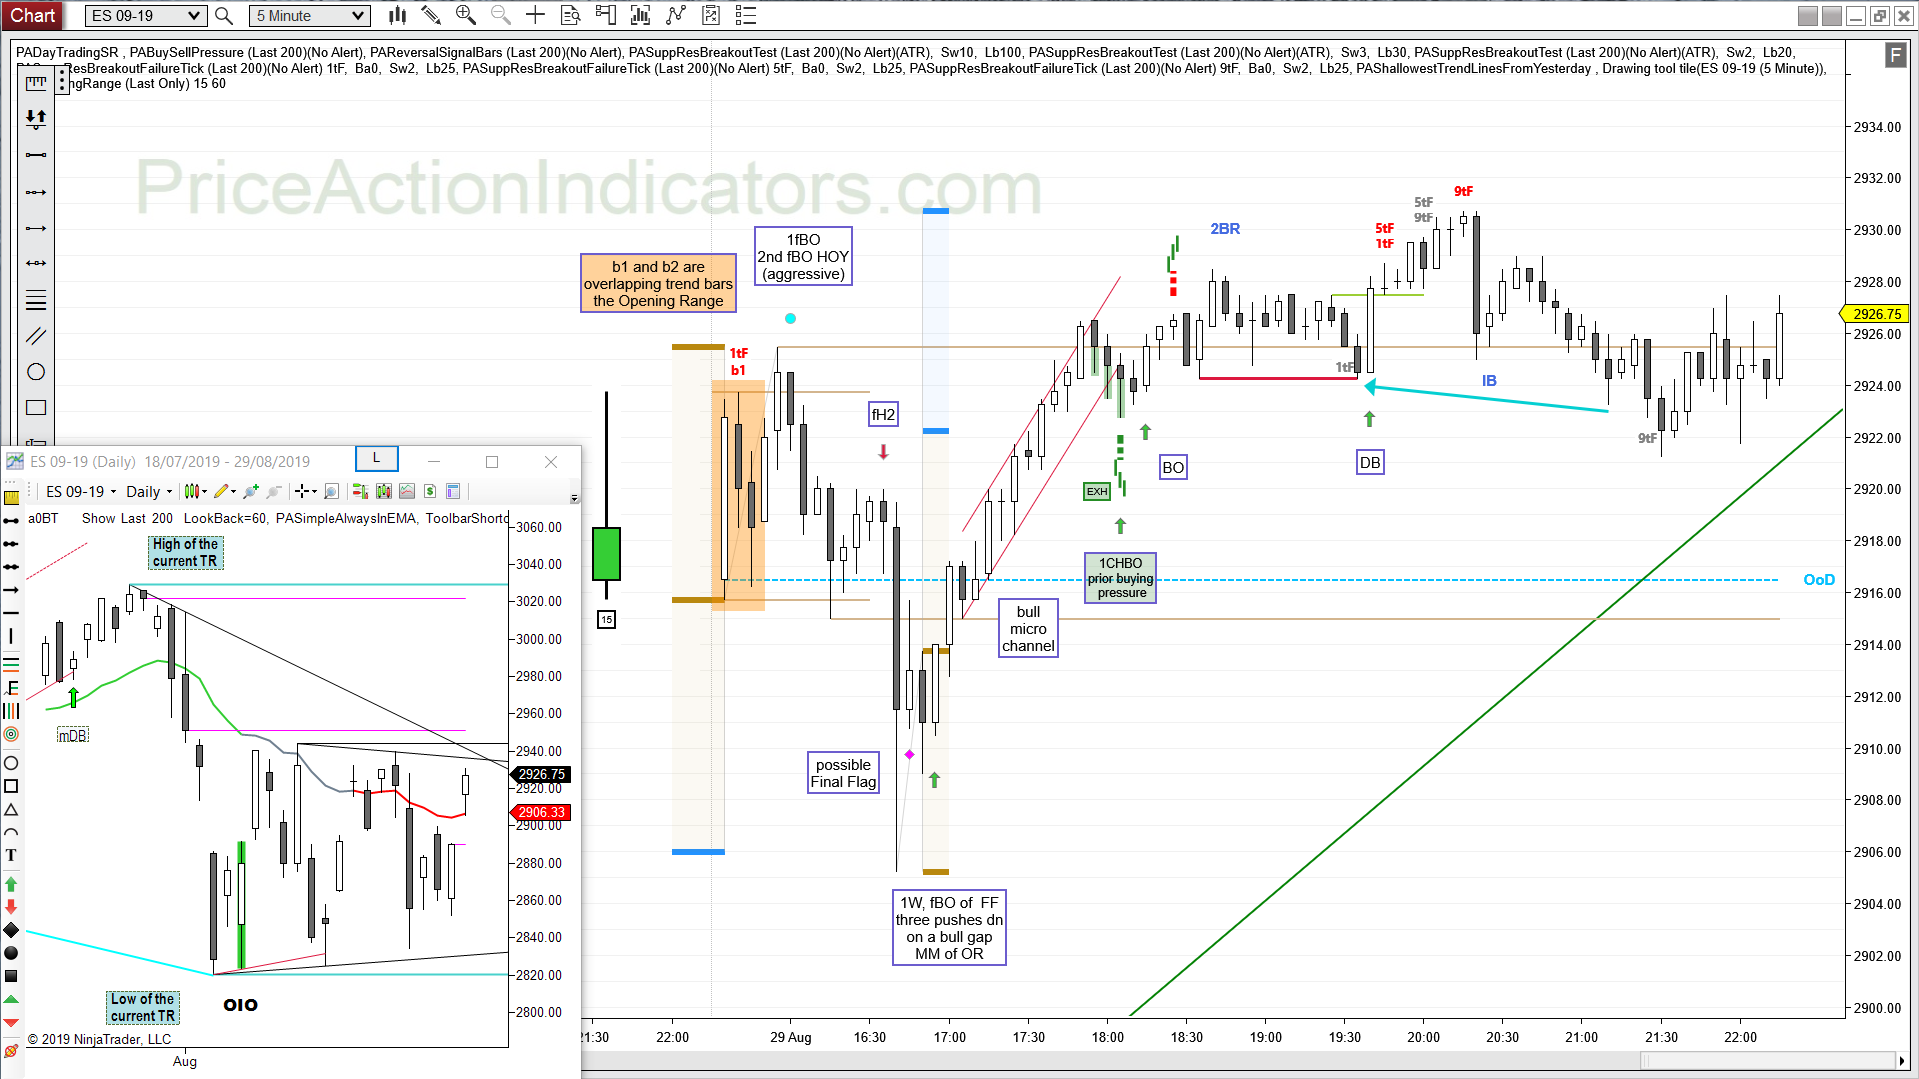
https://www.priceactionindicators.com/2019/08/29/e-mini-es-2019-08-29/
We had a lot of Buying Pressure (increasing bottom tails, shrinking bodies and increasing overlap) during the 1st PB in that strong bull Micro Channel (1CHBO – the 1st pullback in a channel).
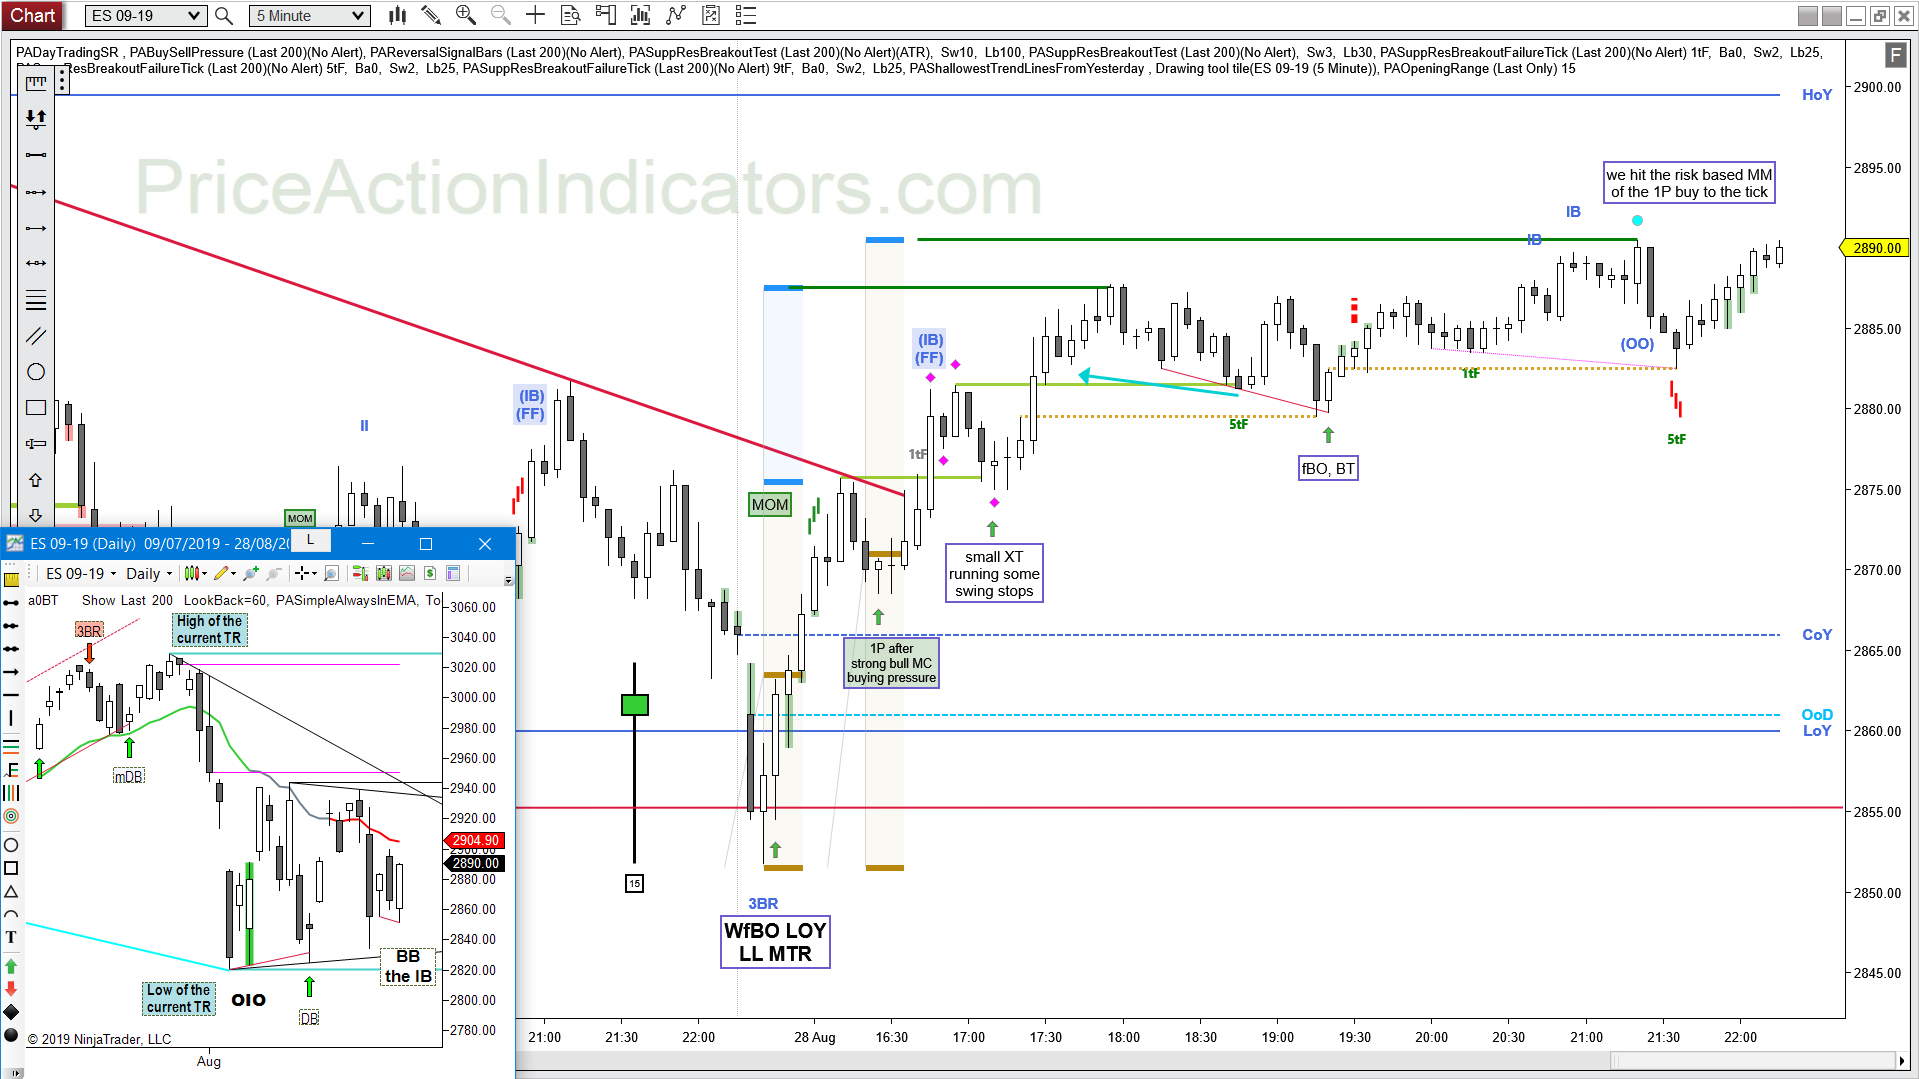
https://www.priceactionindicators.com/2019/08/28/e-mini-es-2019-08-28/
The Buy Sell Pressure indicator showed a lot of Buying Pressure (decreasing bottom tails and decreasing overlap) during the strong bull micro channel from the WfBO at the LOD. There was also some Buying Pressure late on the prior day and on the 1st bar of the day.
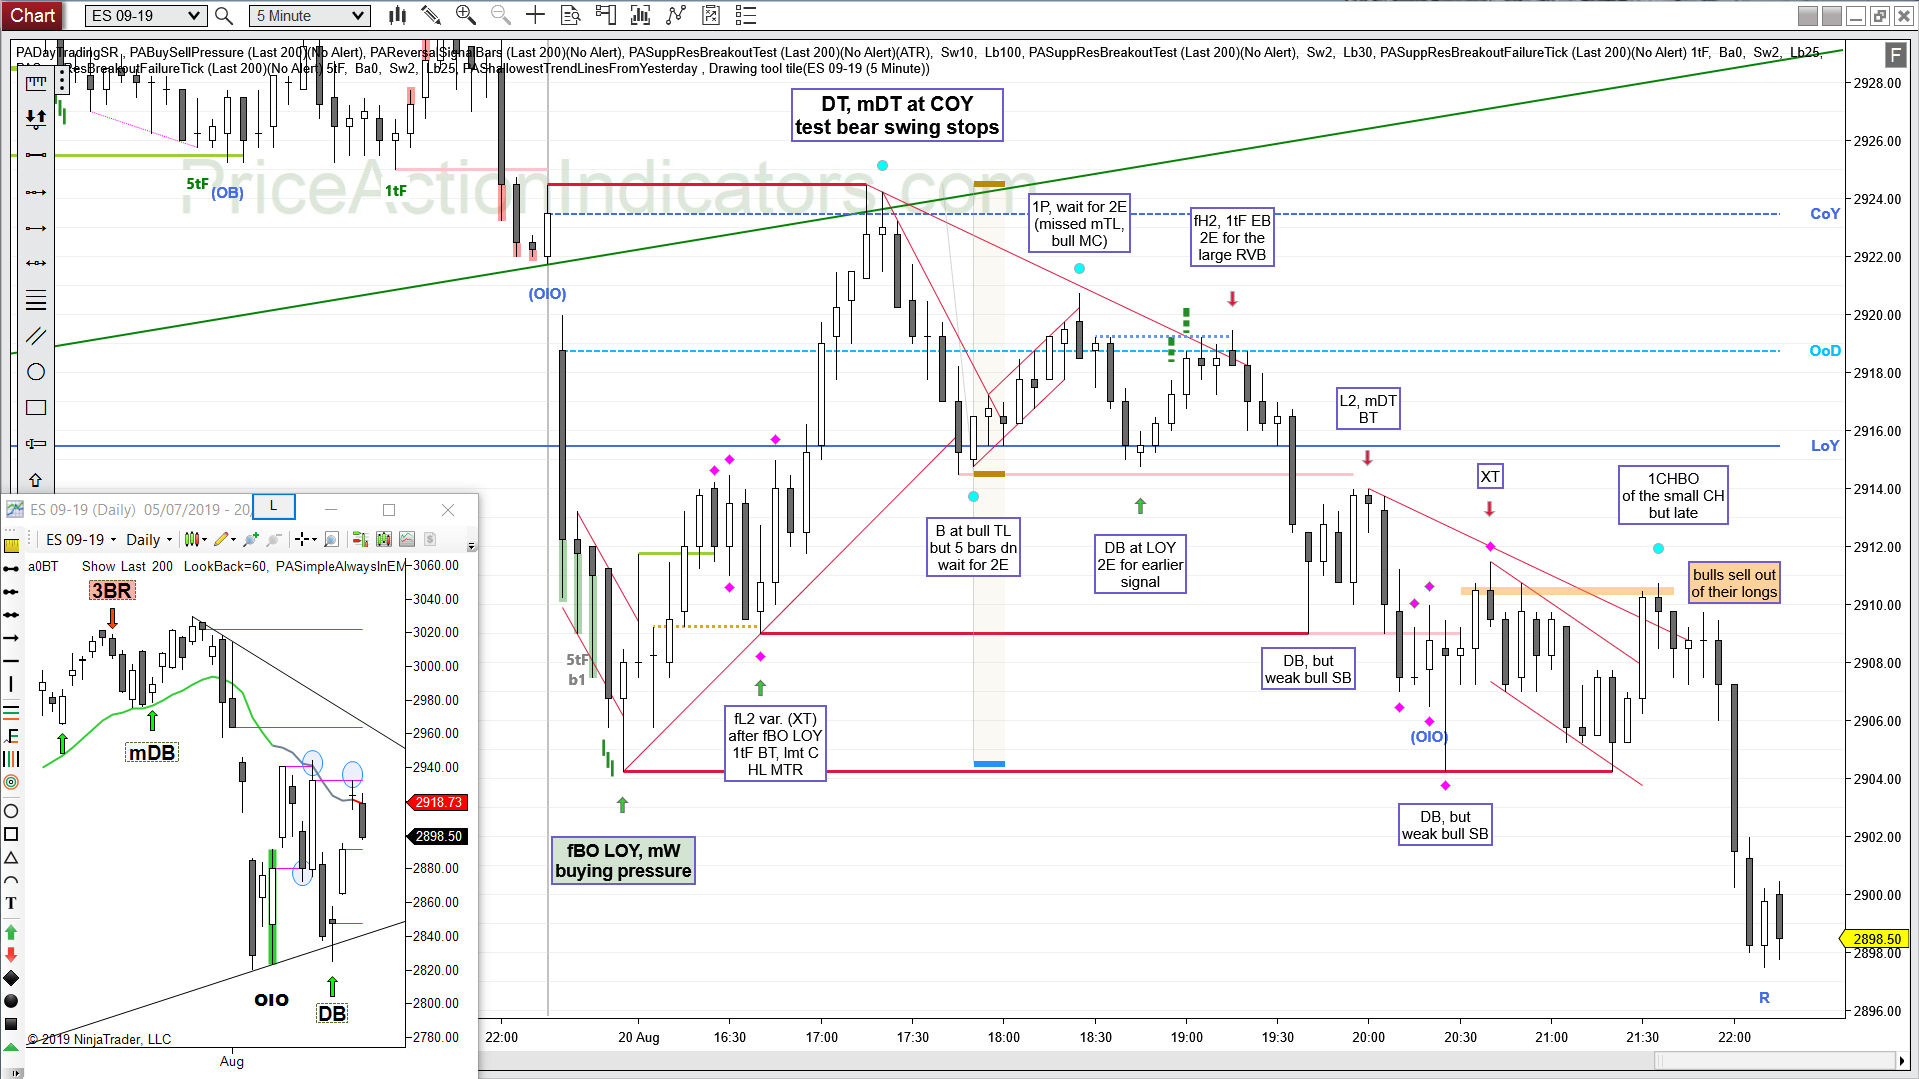
https://www.priceactionindicators.com/2019/08/20/e-mini-es-2019-08-20/
The bar 5 Reversal Bar tries to reverse a bear SC. I wouldn’t consider a buy without the Buying Pressure of increasing lower tails and increasing overlap in a bear move.
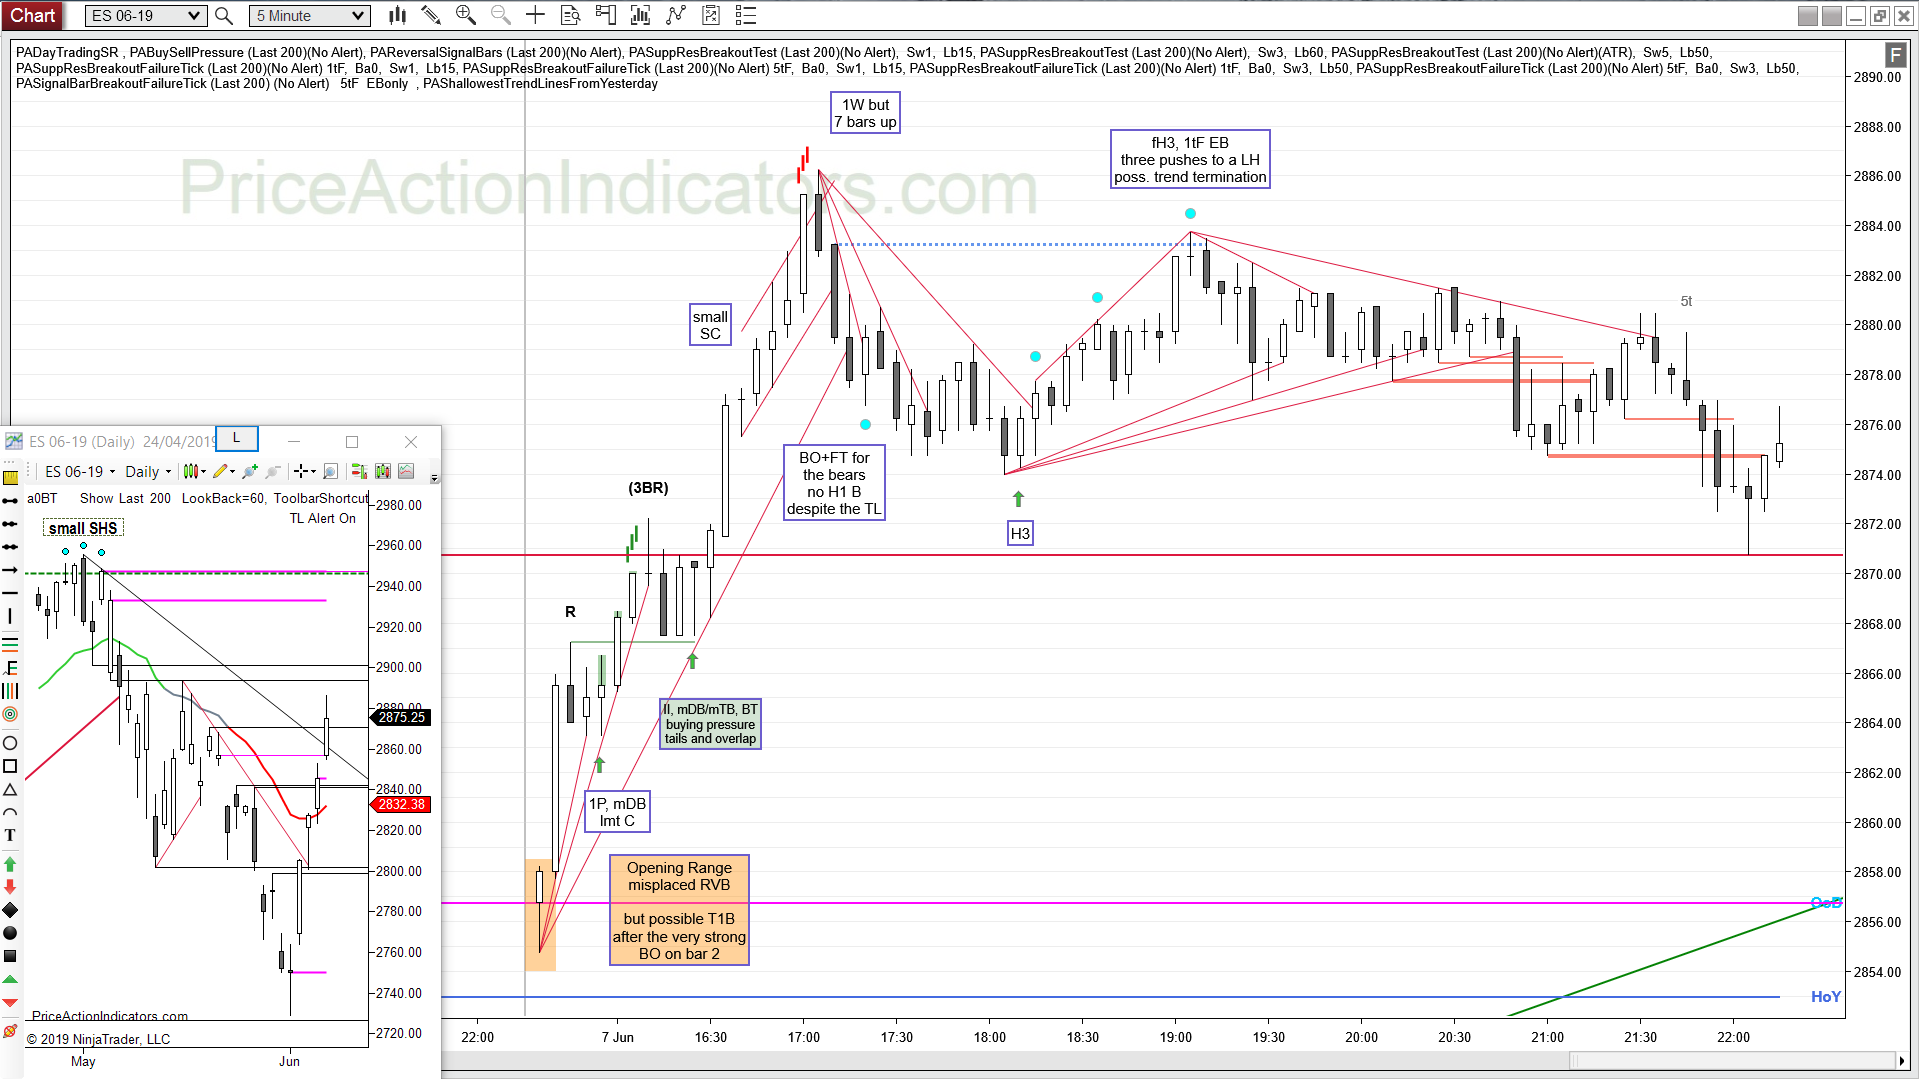
https://www.priceactionindicators.com/2019/06/07/e-mini-es-2019-06-07/
Good Buying Pressure signals on the 2nd push from the LOD, probably more up. The 3BR doesn’t trigger and becomes a bull flag (it gets faded). Also Selling Pressure just before the Reversal Bar, that became the HOD. It was also the third push up and a small SC.

https://www.priceactionindicators.com/2019/06/06/e-mini-es-2019-06-06/
Good Buying Pressure just before the Expanding Triangle Buy (XT), which is also a Breakout Test of the HOY.
Please tell us what you think is missing, any kind of feedback is highly appreciated – contact us
Back to Buy Sell Pressure