
Signal Bar – Breakout Failure
Indicator for NinjaTrader® 7/8
Features
- shows Tick Failure Breakouts above or below possible Signal Bars
- shows possible signals in real-time
- entry method suggestions
- alert feature
- does not work on HeikenAshi, Kagi, Renko, PointAndFigure and LineBreak charts
- achieves best results on futures and equities (on centralized markets) with time based charts (all participants seeing the same data)
- use as a discretionary indicator and for Automated Trading with BloodHound

The “Signal Bar – Breakout Failure” indicator is pretty special and a more complicated/sophisticated one, probably more suitable for advanced scalping and for traders/scalpers who like to watch every tick and scale-in.
If you’re new to Price Action trading, it might make sense, to start with one of the “more straightforward” indicators like the Reversal Signal Bars indicator.
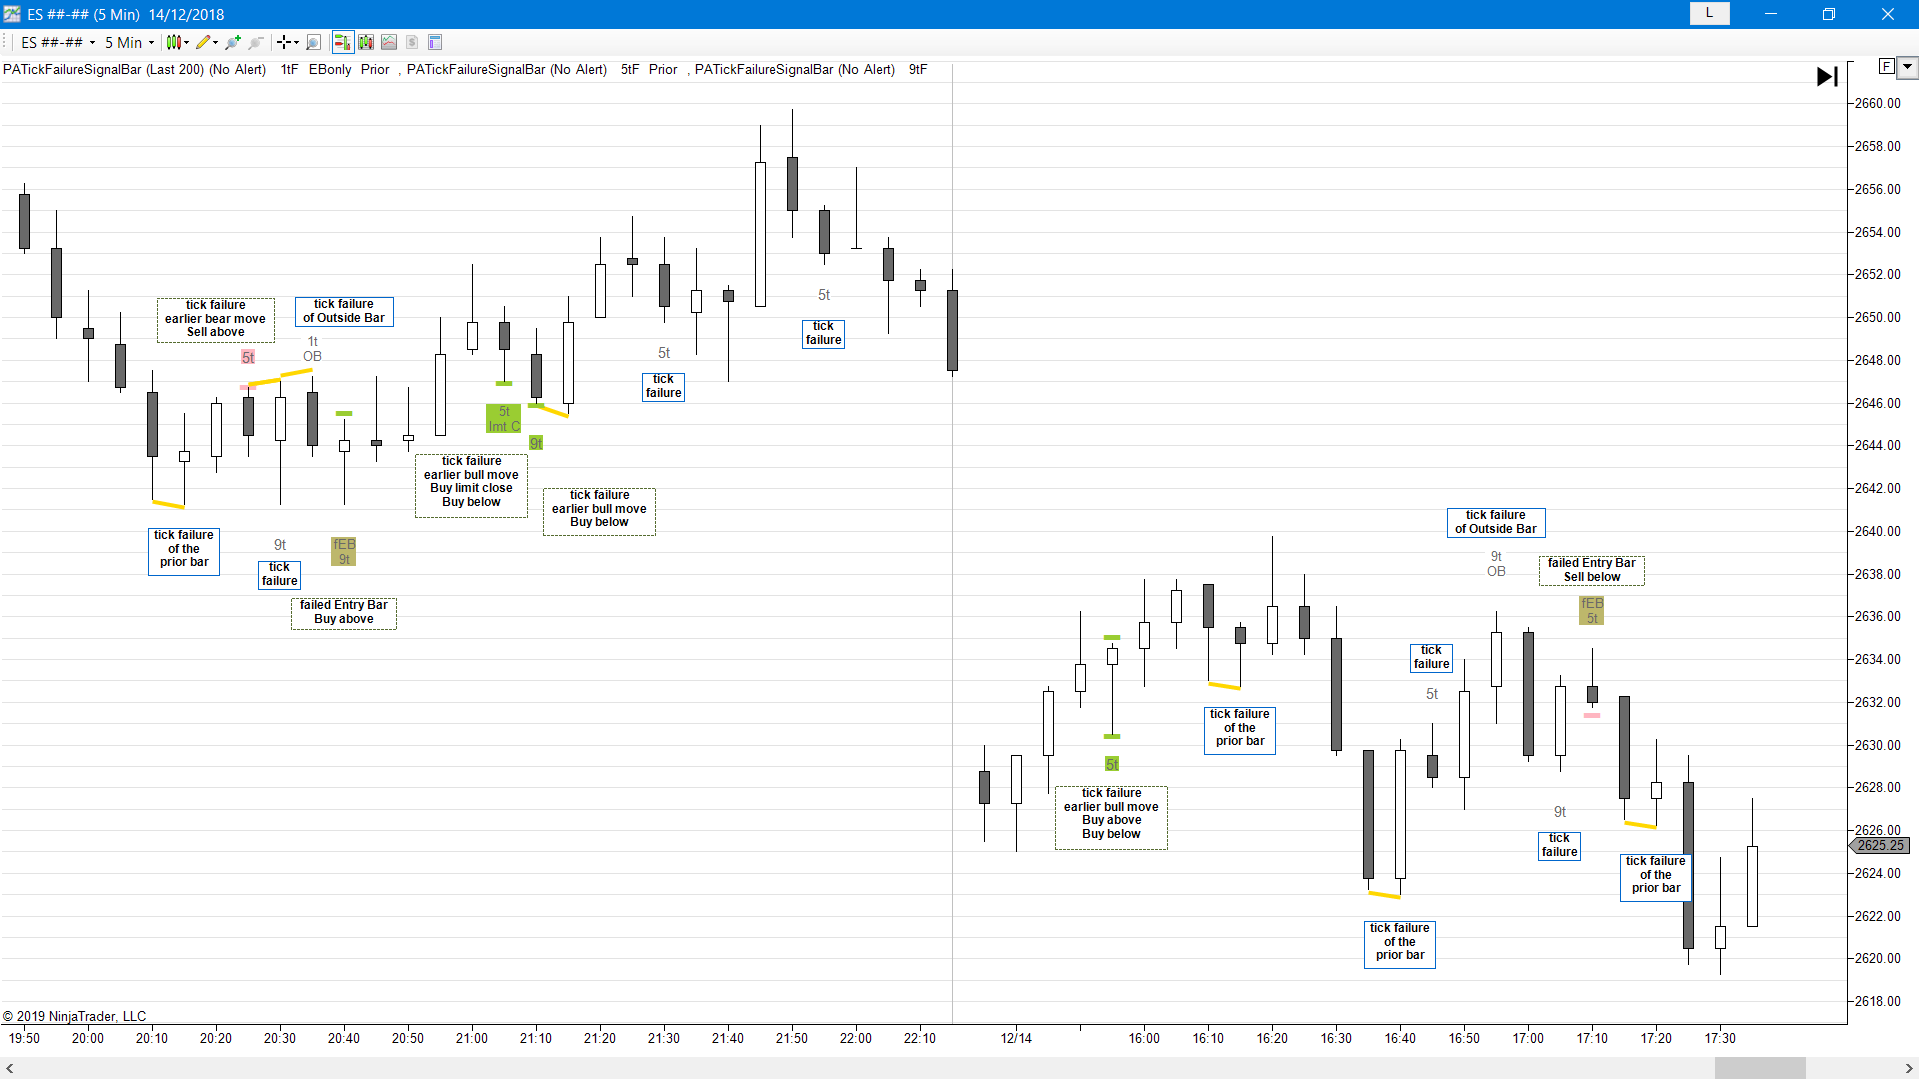
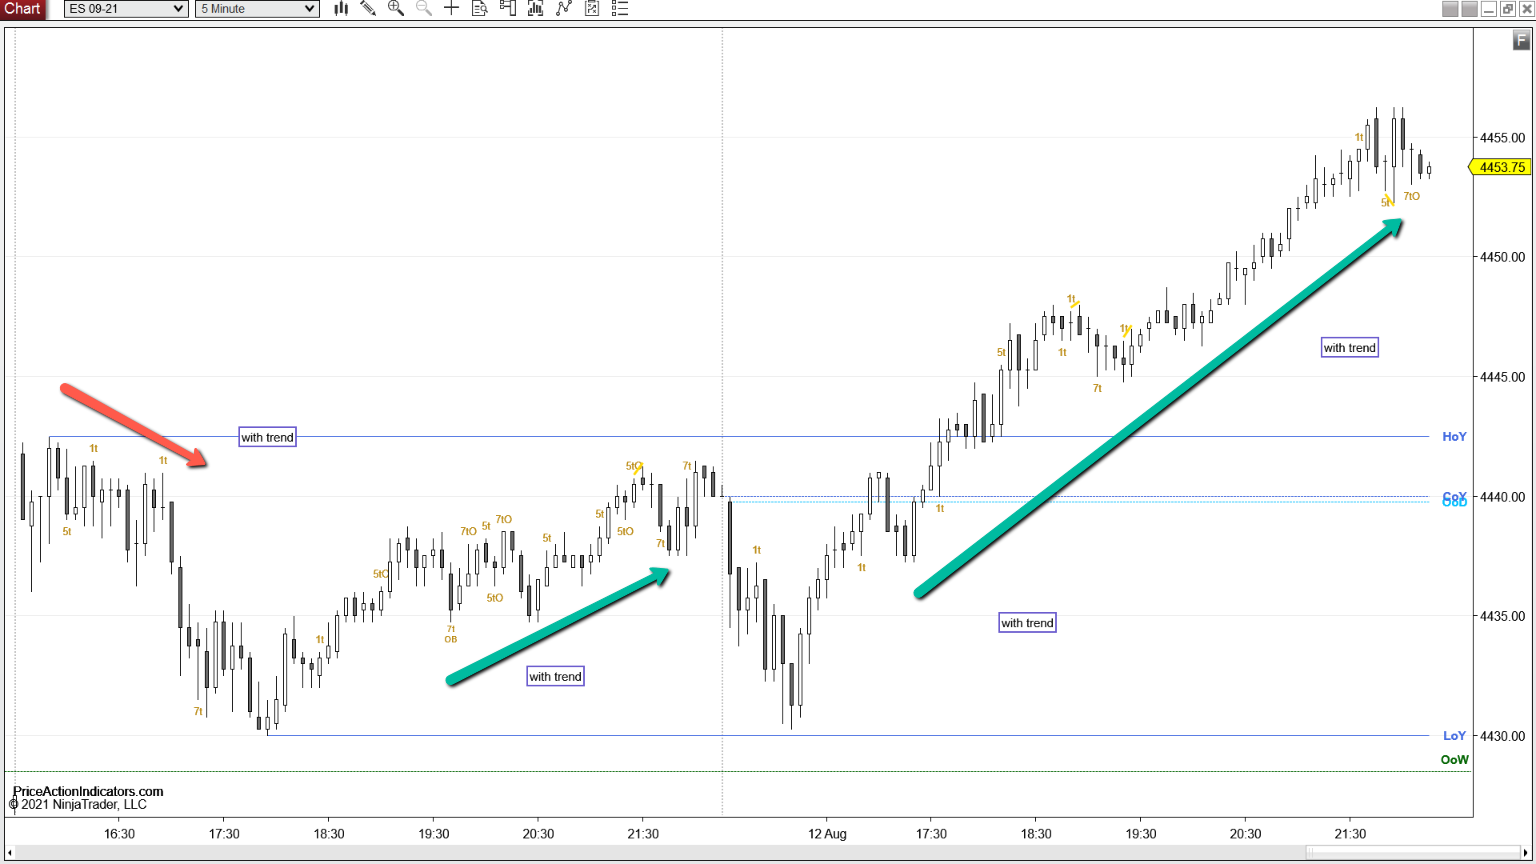
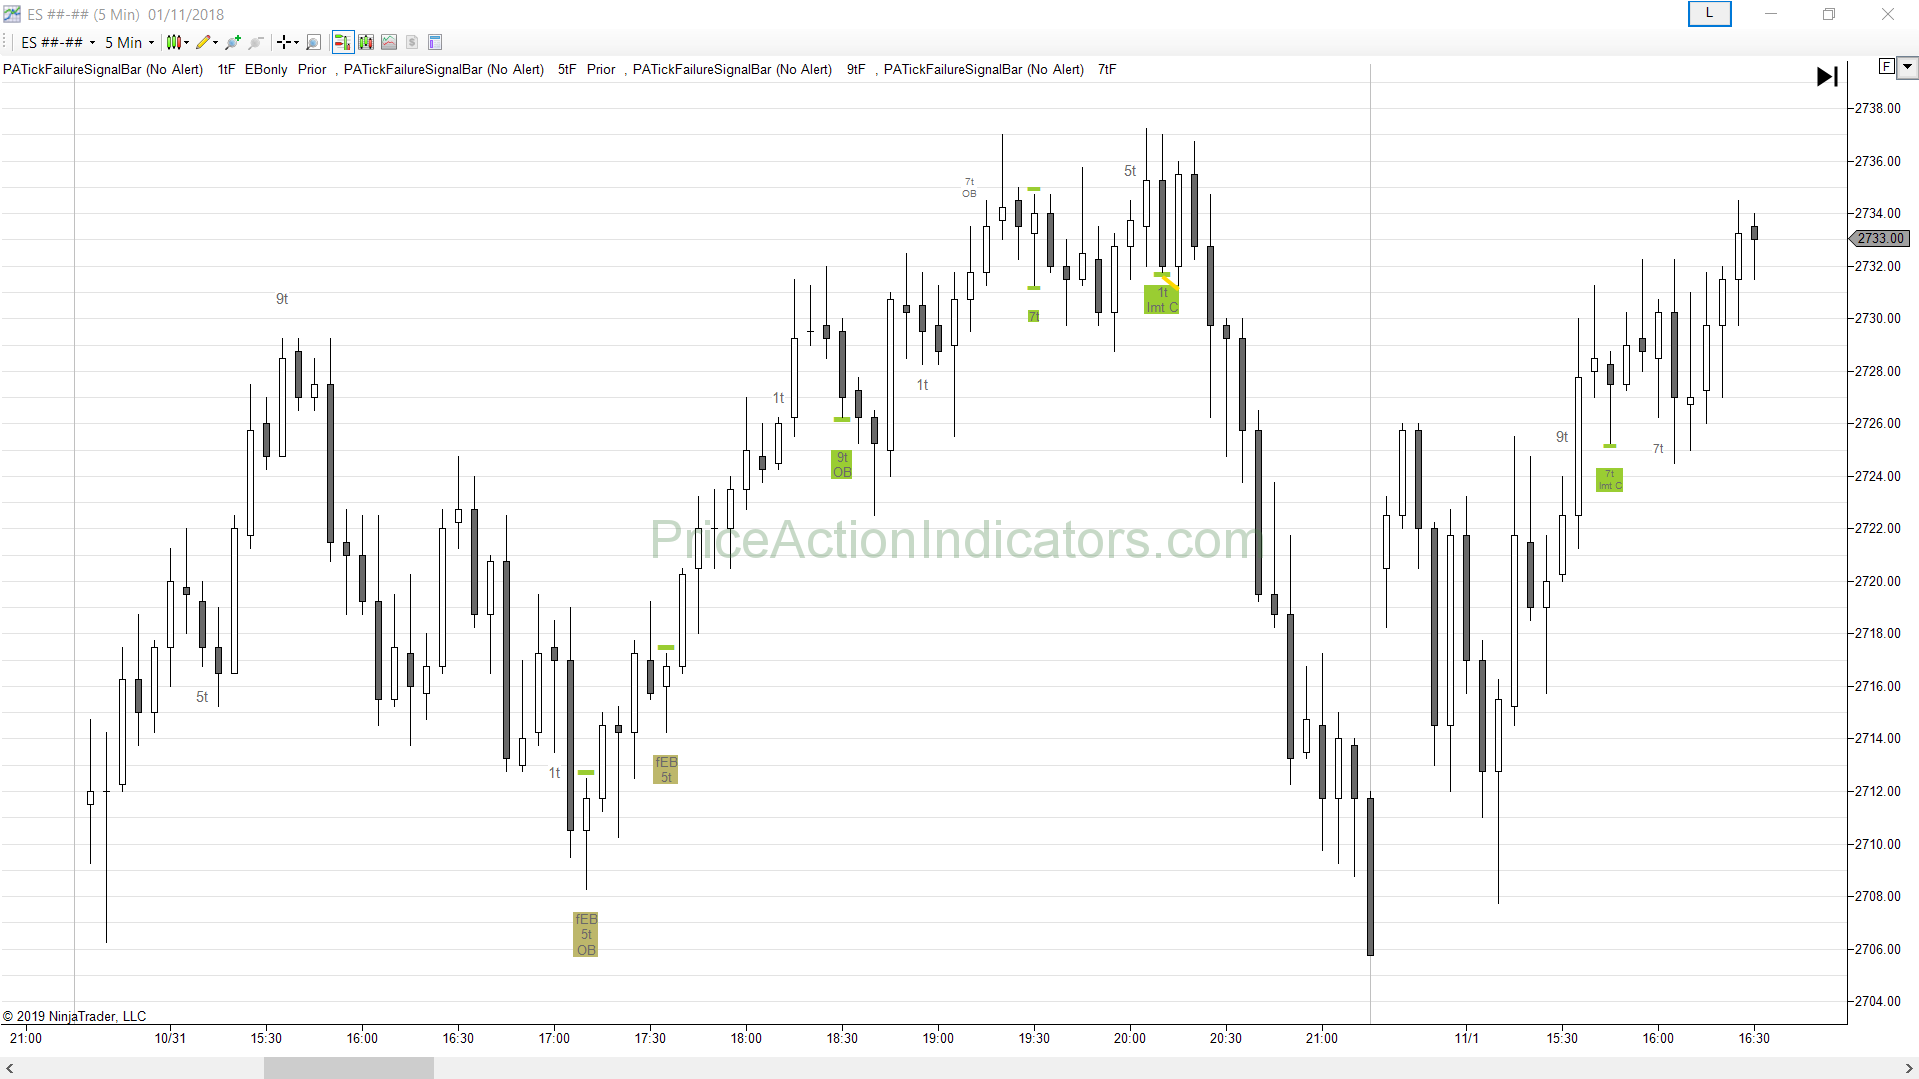
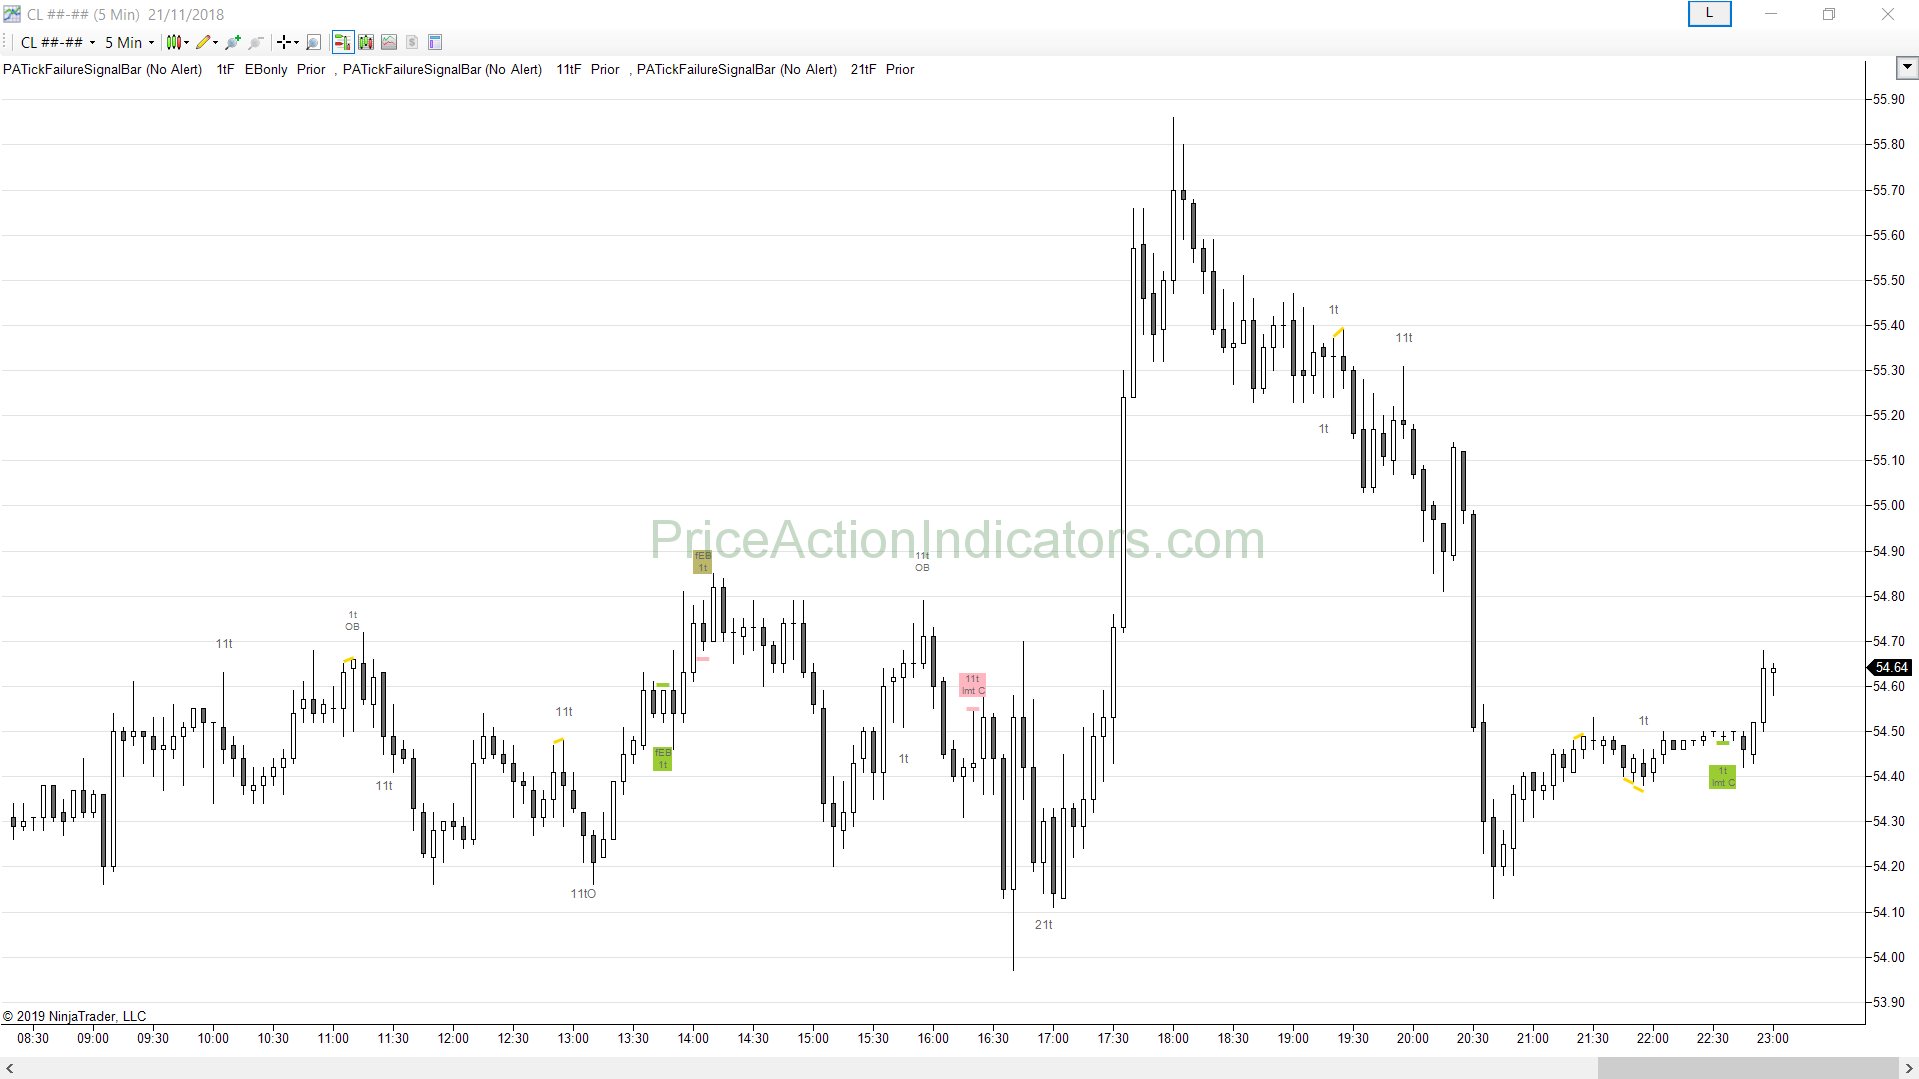
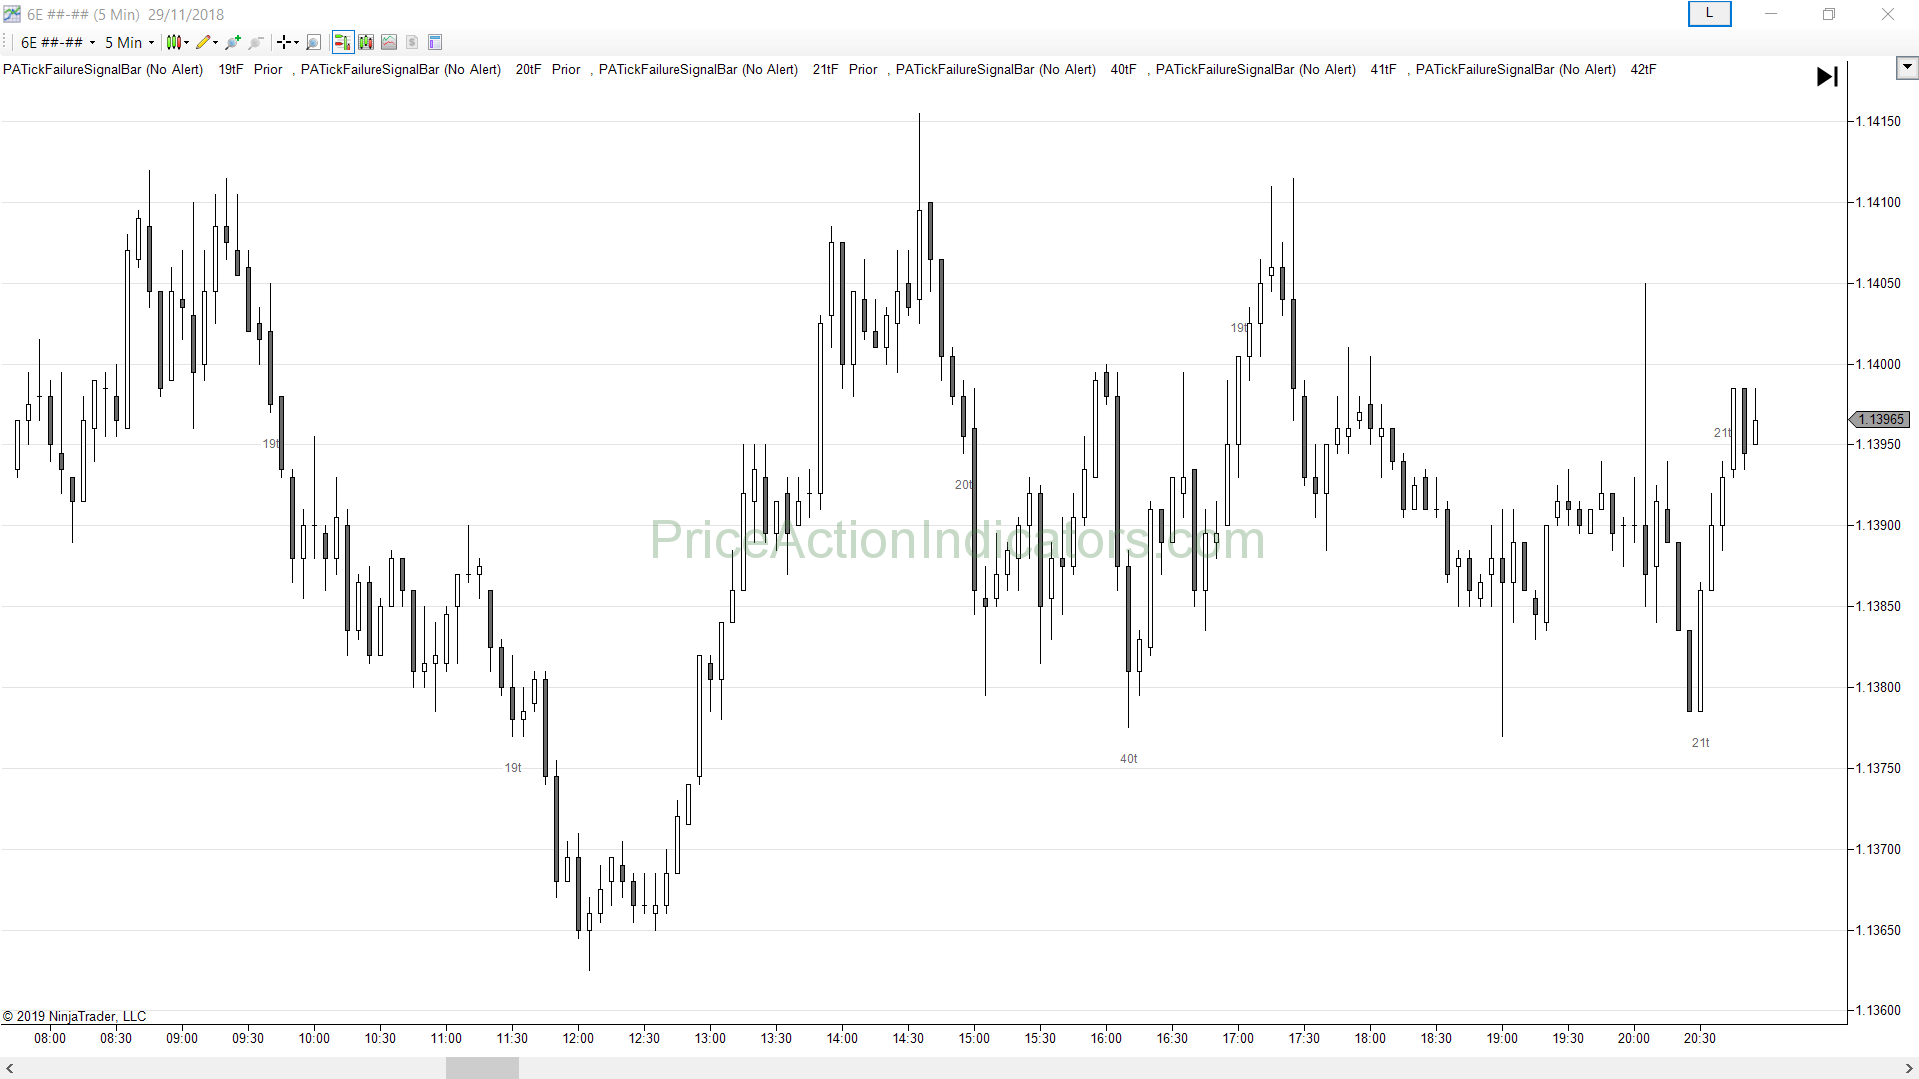
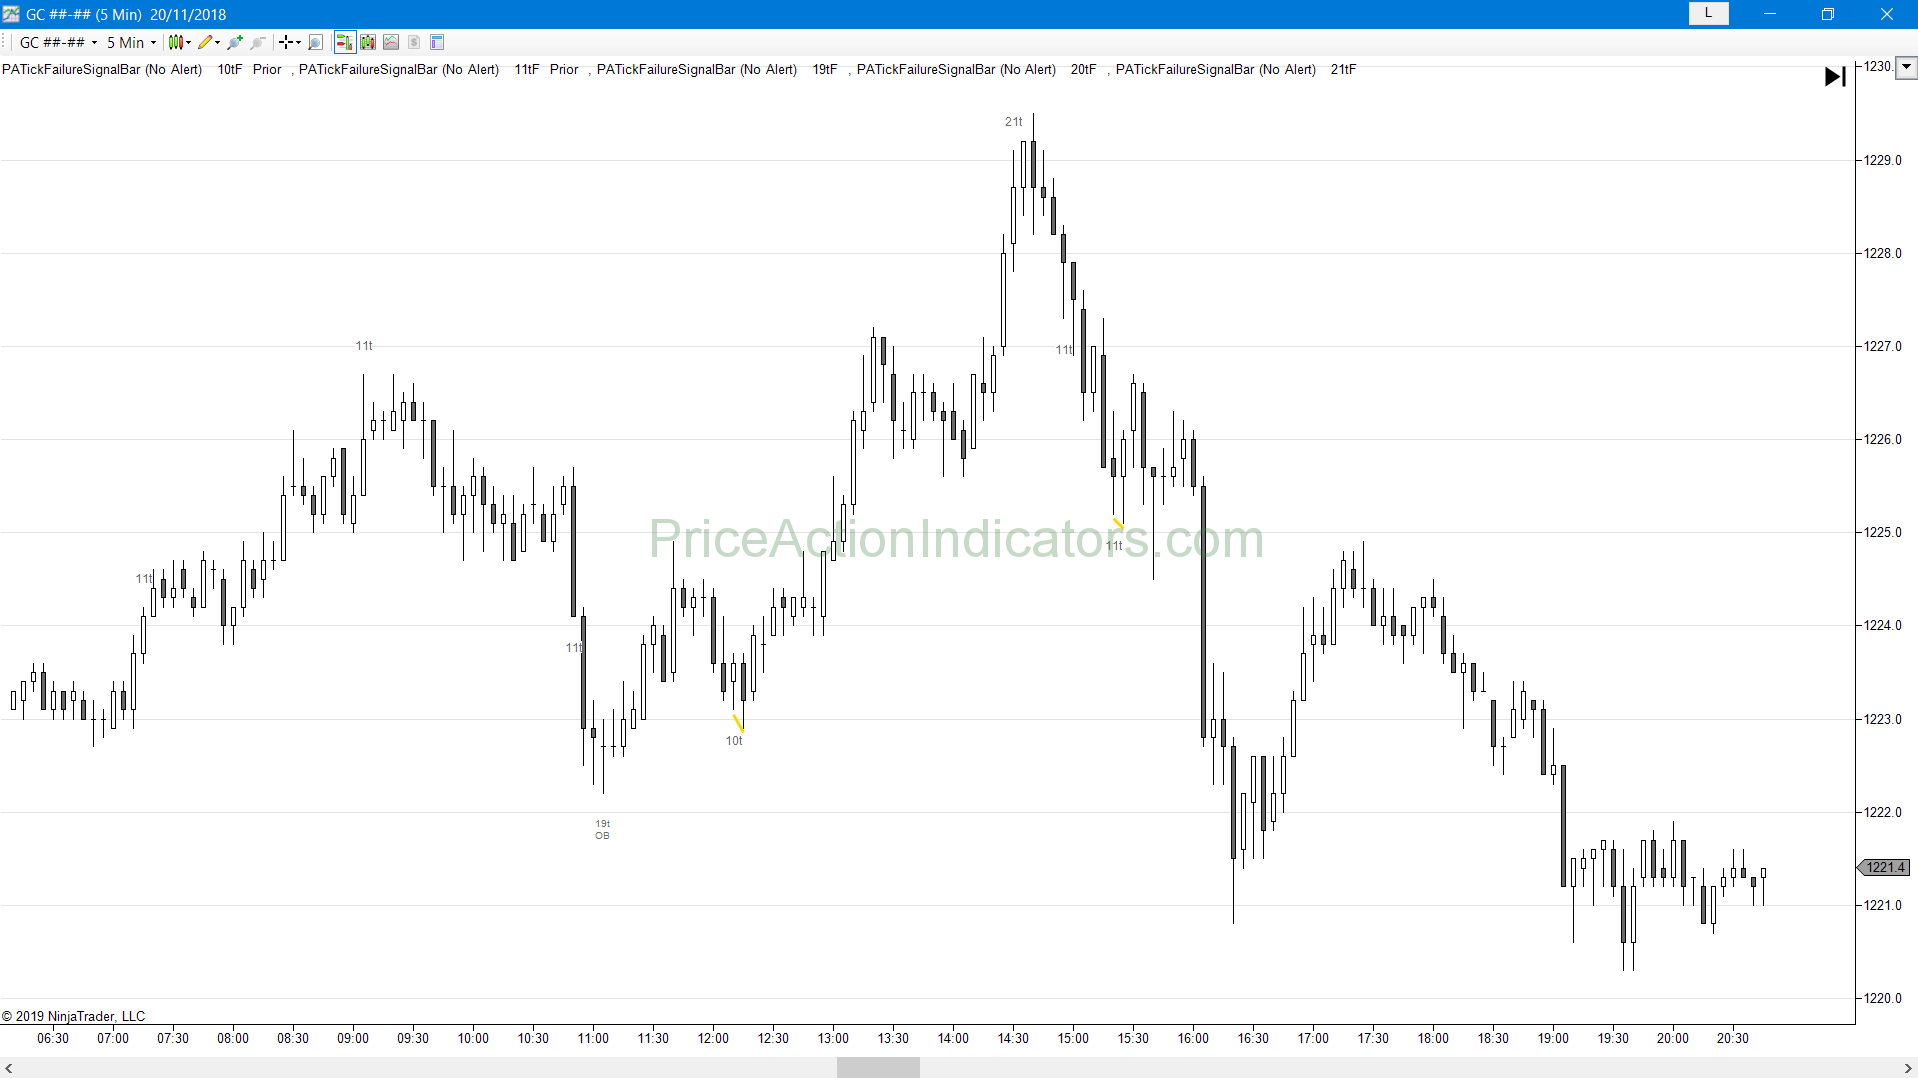
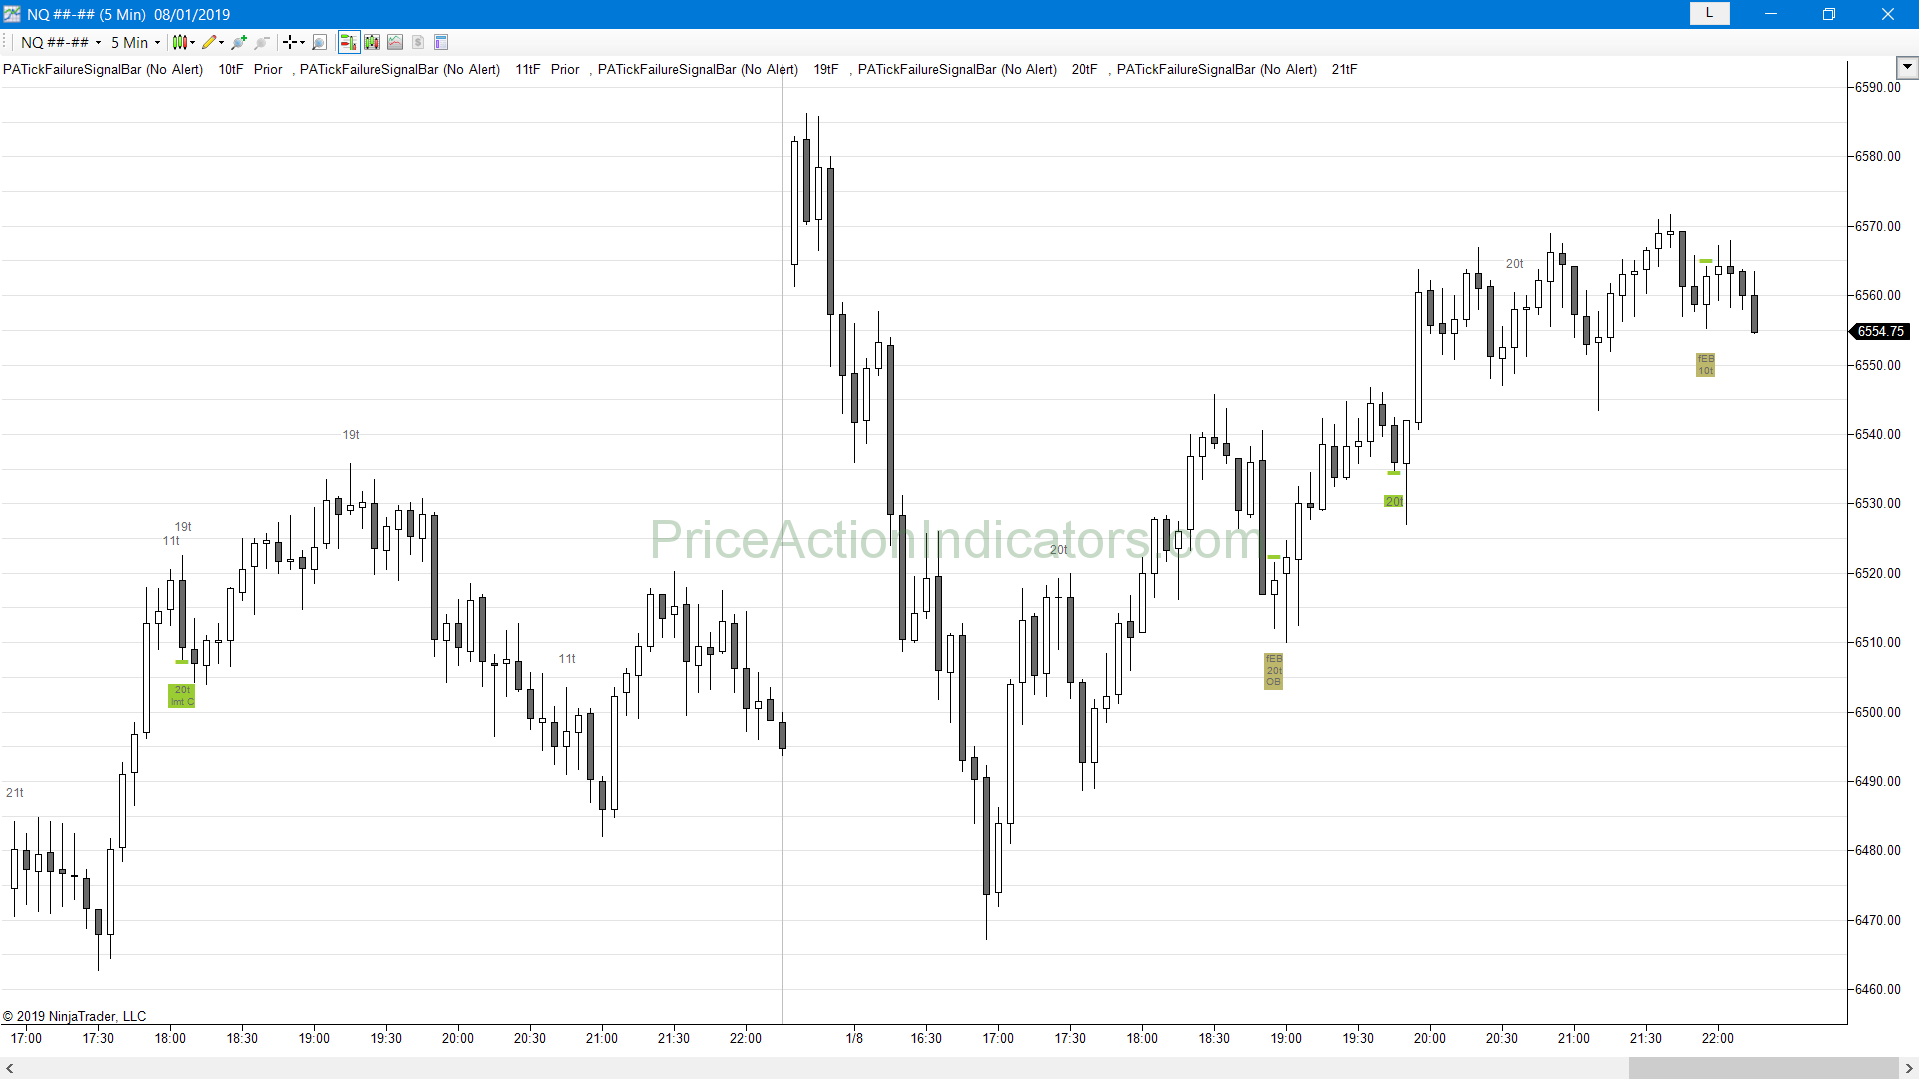
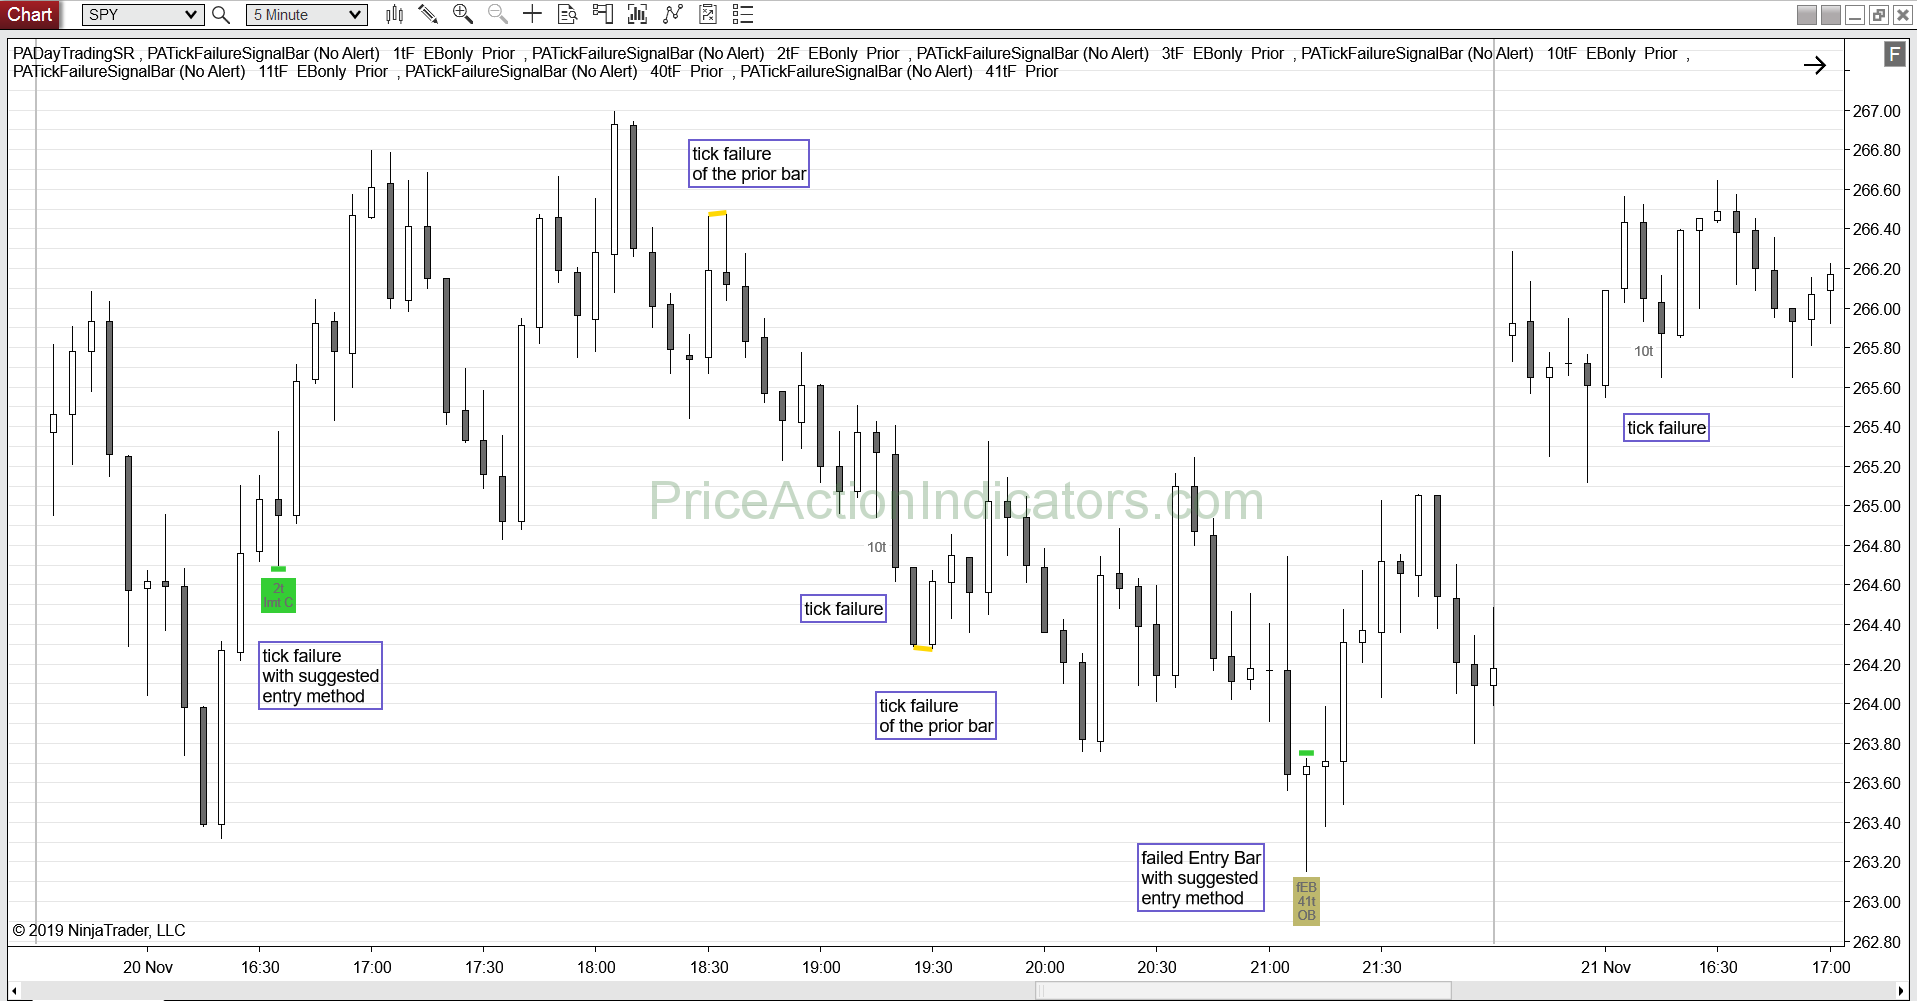
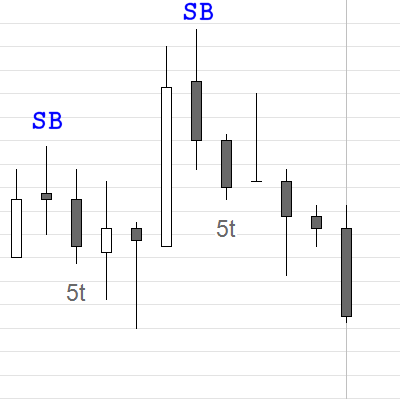
Example Charts

Download a 20 day trial version
Buy now for US $ 180
you get redirected to our reseller MyCommerce/Digital River/Share-it to place your order
to order you need your NinjaTrader® Machine ID (please see FAQ)
for license activation (please see FAQ)
Please contact us for a discount if you’re going to buy more than one indicator.
What are Signal Bars and Entry Bars?
A Signal Bar can be a single candlestick or a bar within a pattern that signals a trader that a possible trade is likely setting up. Just about every bar is a potential Signal Bar. Most of them never lead to an entry though and hence do not become Signal Bars. Many times a Signal Bar can be a setup for a trade in either direction.
Once the Signal Bar has completed, a trader places his stop entry order above or below the Signal Bar. The bar, that moves past the range of the Signal Bar triggers the entry order and puts the trader into that trade. This bar becomes the Entry Bar.
What are Tick Failure Breakouts of Signal Bars?
Tick Failure Breakouts of possible Signal Bars are breakout failures from stop entries above or below these bars.
1 or 2 tick Tick Failure Breakouts of possible Signal Bars (on the ES E-mini) can be considered a failed breakout for traders, who entered on a stop entry above or below that bar. In stocks, Tick Failure Breakouts are often around one to a couple of cents, depending on the price and volatility of the stock.
5 tick Tick Failure Breakouts of possible Signal Bars (on the ES E-mini) can be considered a failure to reach a common scalp target, since a scalp for four ticks (one point) is a very popular trade. A six tick breakout is needed to fill a four tick profit target for a trader who entered on a breakout of the Signal Bar (one tick to enter on a stop, four ticks profit, and one more tick to fill the profit target limit order).
A 5 tick Tick Failure Breakout of a possible Signal Bar (on the ES E-mini) also often means, that there were sellers above that bar (for a bull Signal Bar), who also might have scaled-in one point (four ticks) higher. The same can be true for a 9 tick Tick Failure Breakout, where sellers were able to scale-in twice above that Signal Bar (one and two points higher).
Tick Failure Breakouts of possible Signal Bars can be found in all liquid futures markets, that have many scalpers, like ES, NQ, CL, as well as ETFs like SPY or QQQ, highly liquid stocks and FOREX.
If you trade the MES, load the indicator on the ES chart (the volume is much larger) and take the trades on the MES.
Aggressive/advanced traders buy or sell closes of possible Signal Bars. This creates an Entry Bar with no (shaved Open) or a very small tail on one side. Often this means urgency and a failure of such an Entry Bar can be a great signal. The indicator tries to accommodate for that as well.
Read more on this topic in Al Brooks book:
Reading Price Charts Bar by Bar: The Technical Analysis of Price Action for the Serious Trader
Chapter 9
Failed Signal and Entry Bars and One-Tick Failed Breakouts – page 222 and
Failed Scalps: Five-Tick Failed Breakouts and Failure to Reach a Scalper’s Profit Target – page 251
What do I need to set the Tick Failure to?
Tick Failure Breakouts largely depend on the market and time frame you are trading. Some common scalp targets are (add one or two ticks (futures/equities) for the failure):
ES – 4/6, 8, 12, 16, 20, 24, 32, 40, 48, 60 and 80 ticks
NQ – 10, 20 ticks
CL – 5, 10, 15 ticks
SPY – 10 ticks (cents)
AAPL (Apple stock) – 50, 100 ticks (which is 50 cents and $1)
On the ES E-mini 5 min chart 1 or 2 tick failures are failed breakouts and 5 or 7, 9, 13 and 17 tick are failures to reach common scalp targets. Just add one tick to the common scalp targets from above.
If you trade the MES, load the indicator on the ES chart (the volume is much larger) and take the trades on the MES.
Best results are achieved on futures and equities. If you trade EURUSD Forex use the the 6E future to chart the Tick Failure Breakouts.
Can I simply trade every signal?
This largely depends on context, trading style and stop loss (risk), also on your ability to scale in and the use of wide or swing stops (below the last higher low or above the last lower high in a trend).
Confluence is very important in trading and means to have several (at least two) reasons to take a trade. Your 1st reason is the Tick Failure Breakout and your 2nd reason can be e.g. Support / Resistance, measured moves, trend line / trend channel line overshoot, Buying/Selling Pressure, a 2nd attempt to reverse and many more.
As a start, use Tick Failure Breakouts with trend only and Buy/Sell Closes of possible signal bars or Buy below and Sell above them (especially bars with large wicks/tails) for an early pullback entry. Use a swing stop (below the last higher low or above the last lower high in a trend).
See also the scale-in approach discussed with another indicator here: Can I simply trade every signal?
Also check out the Blog for more examples on how to use Tick Failure Breakouts of possible Signal Bars in your trading.
One more word
The “Signal Bar – Breakout Failure” indicator is pretty special and a more complicated/sophisticated one, probably more suitable for advanced scalping and for traders/scalpers who like to watch every tick and scale-in.
If you’re new to Price Action trading, it might make sense, to start with one of the “more straightforward” indicators like the Reversal Signal Bars or the Buy Sell Pressure indicator.
What do the signals mean?
The “SB” in the following table means Signal Bar, it’s added as clarification.
| Signal | Text | Background Color | Entry Method |
|---|---|---|---|
 |
5t 5 tick failure from the low of the Signal Bar, which can occur on the Entry Bar or later |
no Background Color | no suggestion
trade according to context |
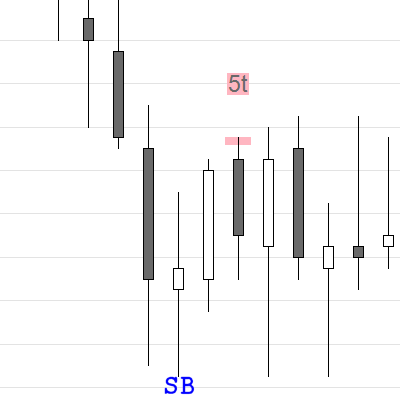 |
5t 5 tick failure from the high of the Signal Bar, which can occur on the Entry Bar or later |
Bear Background Color there was an earlier bear move or exhaustion |
Sell Above |
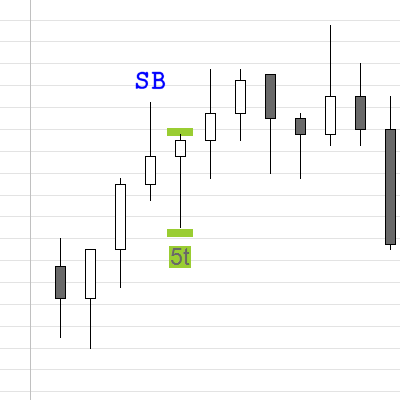 |
5t 5 tick failure from the low of the Signal Bar, which can occur on the Entry Bar or later |
Bull Background Color there was an earlier bull move or exhaustion |
Buy Above Buy Below |
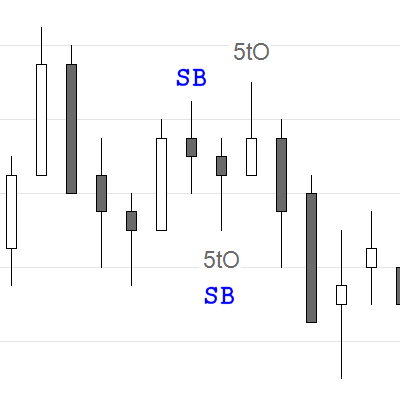 |
5t O 5 tick failure from the open of the Entry Bar for shaved open entry bars (or with a small tail on the Open side) |
no Background Color | no suggestion
trade according to context |
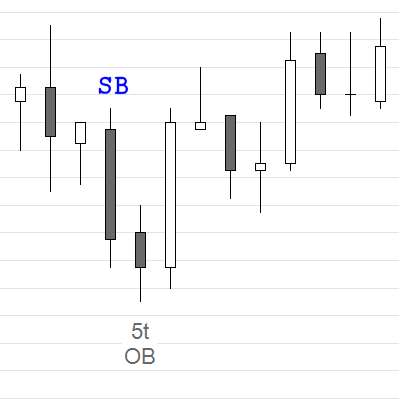 |
5t OB 5 tick failure from the low of the Signal Bar, the Signal Bar is an Outside Bar Outside Bars are often “mini” trading ranges |
no Background Color | no suggestion
trade according to context |
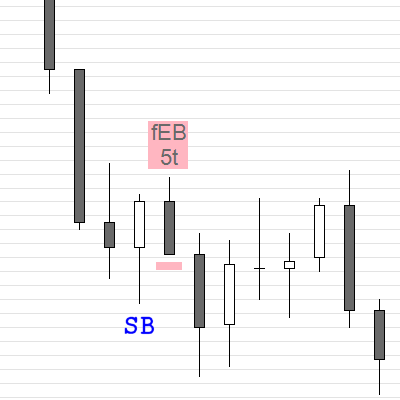 |
fEB 5t 5 tick failure on the Entry Bar from the high of the Signal Bar, probably trapping early bulls |
Bear Background Color there was an earlier bear move or exhaustion the Entry Bar has opposite color to the Signal Bar, trapping breakout traders of the Signal Bar immediately |
Sell Below |
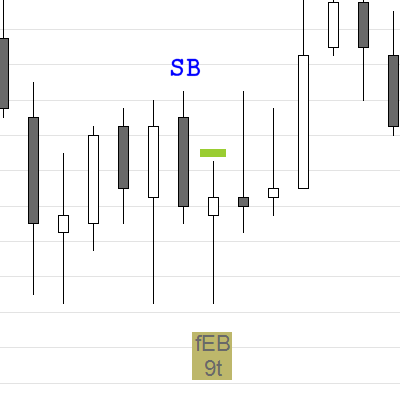 |
fEB 9t 9 tick failure on the Entry Bar from the high or low of the Signal Bar, probably trapping late bears |
Entry Bar Background Color the Entry Bar has opposite color to the Signal Bar, trapping breakout traders of the Signal Bar immediately |
Buy Above |
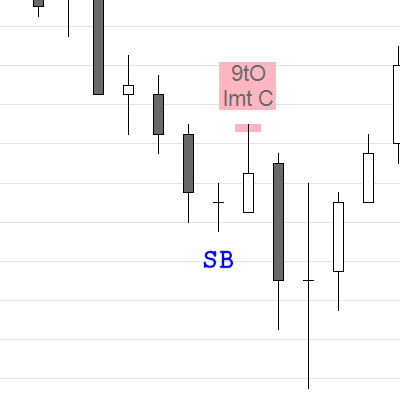 |
9t O, lmt C 9 tick failure on the Entry Bar from the open of the Entry Bar for shaved open entry bars, or with a small tail on the Open side |
Bear Background Color there was an earlier bear move or exhaustion |
Sell Limit Close Sell Above |
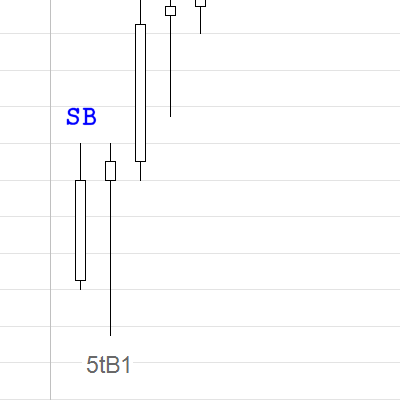 |
5t B1 or 5t B2 5 tick failure from the high or low of the 1st bar of the session (or the 2nd bar, if that is an Outside Bar of the 1st bar of the session) useful, if you trade charts with gaps , like RTH |
no Background Color | no suggestion
trade according to context |
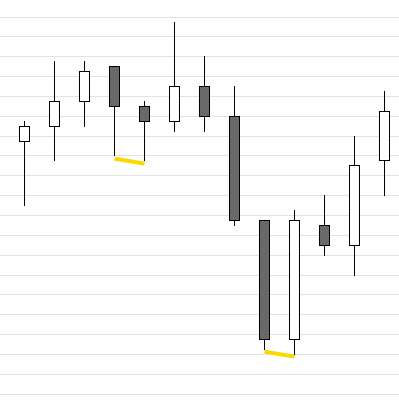 |
Yellow lines 1 or 2 tick failures of the prior bar (e.g. sellers above (SA) an Entry Bar, like disappointed buyers exit above a weak Entry Bar) |
set line color and thickness in settings | no suggestion
trade according to context |
Entry Method
The indicator tries to suggest an appropriate entry method for the context, the Tick Failure Breakout of the Signal Bar occurs in.
This is no investment advice, the investor is solely responsible for the choice of the indicator signals or entry method. Please read our Disclaimer.
| Stop Entry above | stop buy order 1 tick above the high of the bar |
| Stop Entry below | stop sell order 1 tick below the low of the bar |
| Buy Below | limit buy order at the low of the bar (advanced traders) |
| Sell Above | limit sell order at the high of the bar (advanced traders) |
| Buy Limit Close | buy the close of the bar with a limit order (advanced traders) |
| Sell Limit Close | sell the close of the bar with a limit order (advanced traders) |
What are the settings?
The settings probably need to be tweaked especially to the “personality” and time frame of the instrument you’re trading.
If you trade the MES, load the indicator on the ES chart (the volume is much larger) and take the trades on the MES.
Indicator name: PASignalBarBreakoutFailureTick

Show Last 200 Bars only
Show the indicator signals only for the last 200 bars, which will speed up a reload of the chart or indicator
Sound Alert
Play a sound and show an alert in the alert window
Sound Alert on Prior Bar
Also alert on a Tick Failure Breakout of the Prior Bar
Sound Alert Percent
Sound Alert, when Bar is to (Percent) complete (does not work for Range, Kagi or LineBreak)
leave Rearm Seconds 0 (zero), if using on a Range, Kagi or LineBreak chart
Sound Alert Rearm Seconds
Rearm Sound Alert after (Rearm Seconds)
if not using Sound Alert Percent or for Range, Kagi or LineBreak
Sound Alert File
Pick a .WAV file from the NinjaTrader sound folder (how to install sounds, see here )
Ticks
Extend of the Tick Failure Breakout in ticks from the high or low of the Signal Bar
Show for Entry Bar only
Show a possible Tick Failure Breakout only on the Entry Bar (the bar after the Signal Bar)
Show for Prior Bar
Show Tick Failure Breakouts of the prior bar (also, if that is not a Signal Bar)
show lines from the prior bar high/low to the current bar high/low, if that is a Tick Failure
Show Untriggered
Otherwise Tick Failure breakouts, that don’t trigger (price going beyond the other extreme of the bar) , will be deleted
Show Entry Method
If un-ticked show only the Tick Failure Breakout, but not the entry method
Text Size, Offset and Color
Set text properties
Bull Background Color
Please see “What do the signals mean?” above
Bear Background Color
Please see “What do the signals mean?” above
Entry Bar Background Color
Please see “What do the signals mean?” above
Micro Double Bottom/Top Color
Color for the line, that shows a double bottom or top of the Tick Failure Breakout bar with a prior bar
Tick Failure Prior Bar Color and Line Thickness
Please see “What do the signals mean?” above
back to Indicators