
Support and Resistance – Breakout Failure
Indicator for NinjaTrader® 7/8
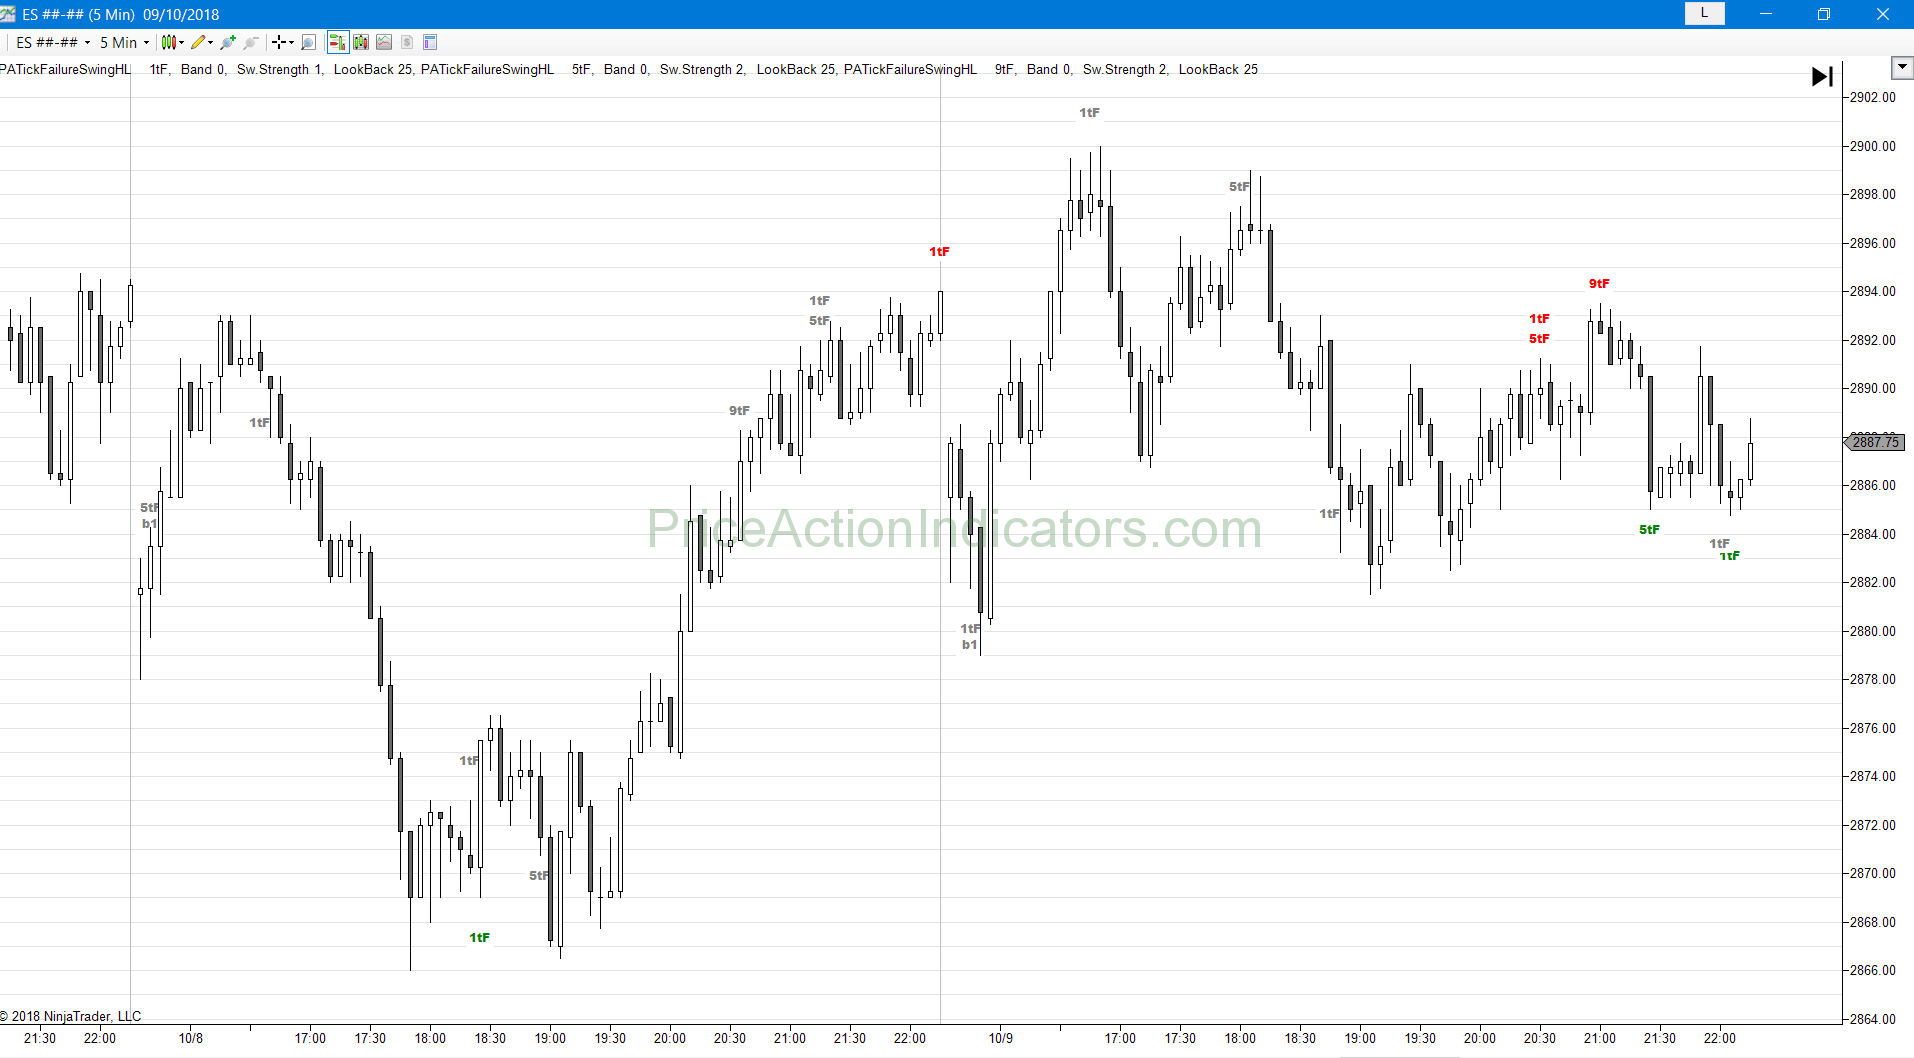
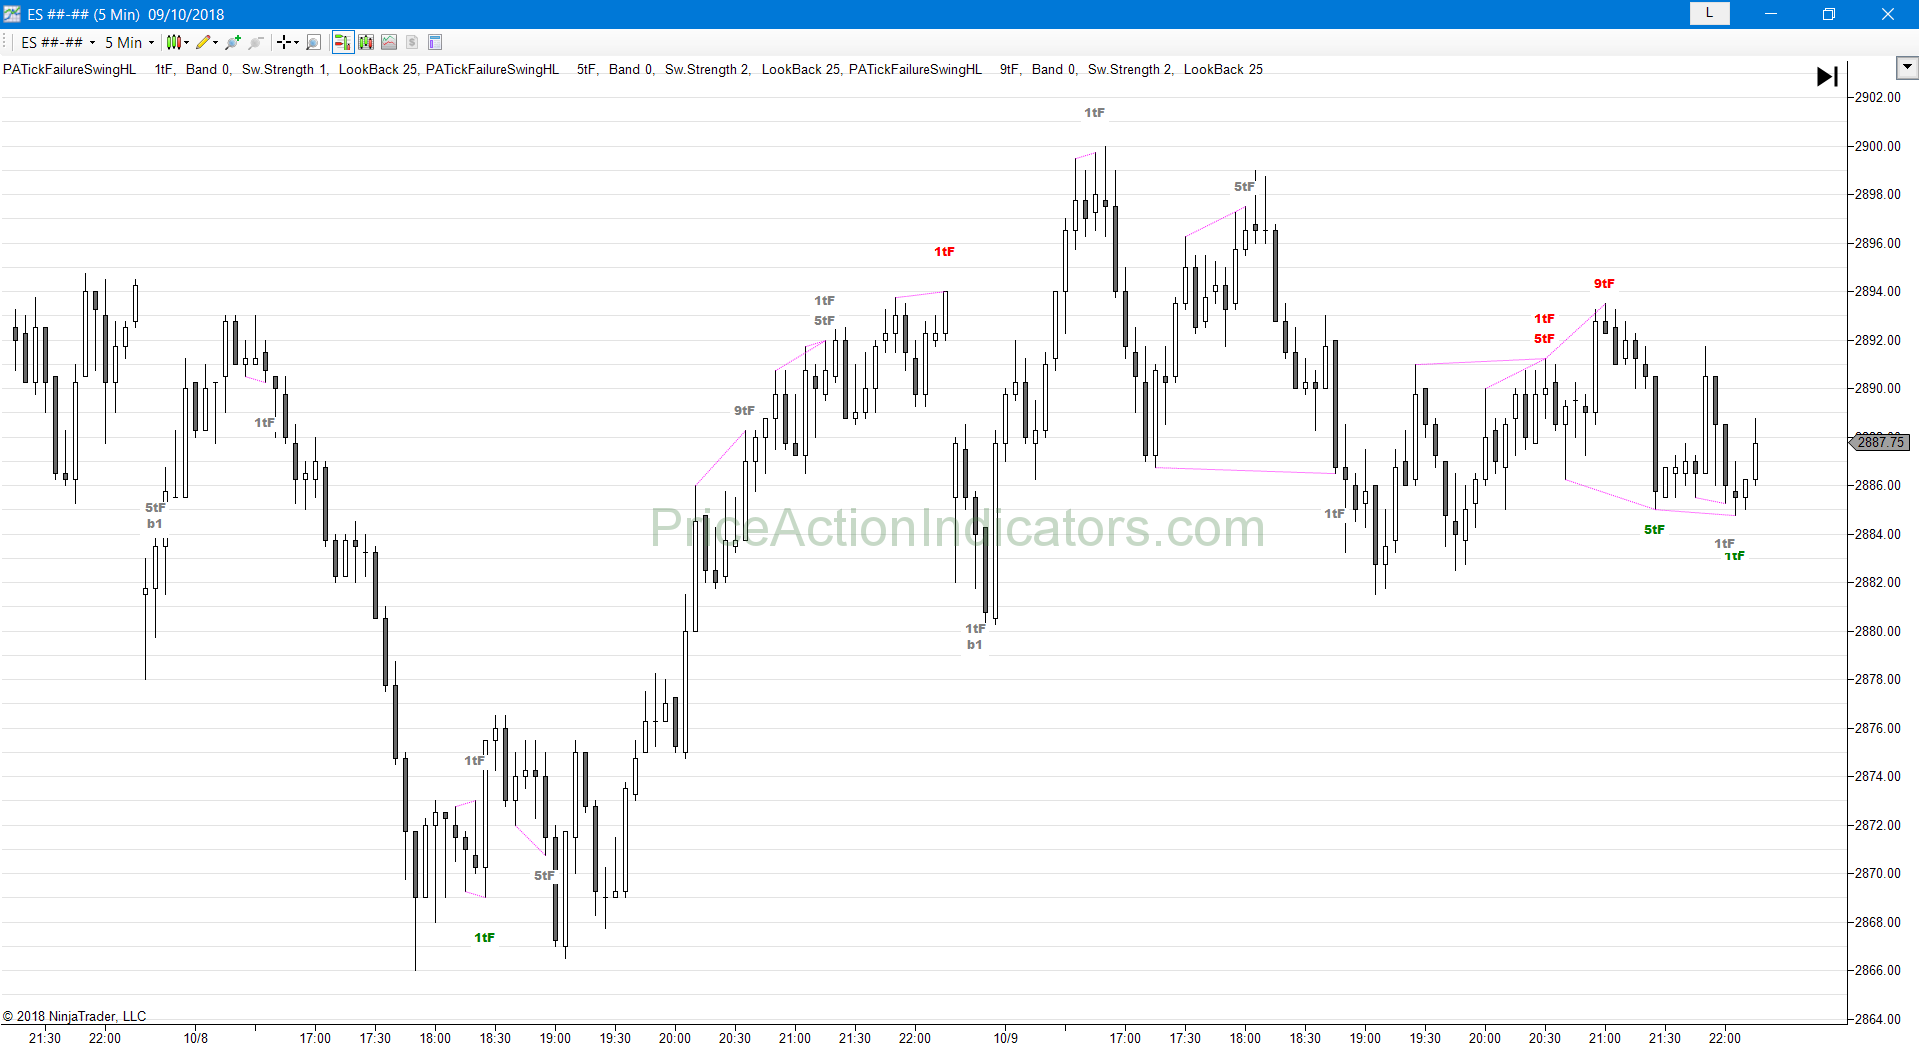
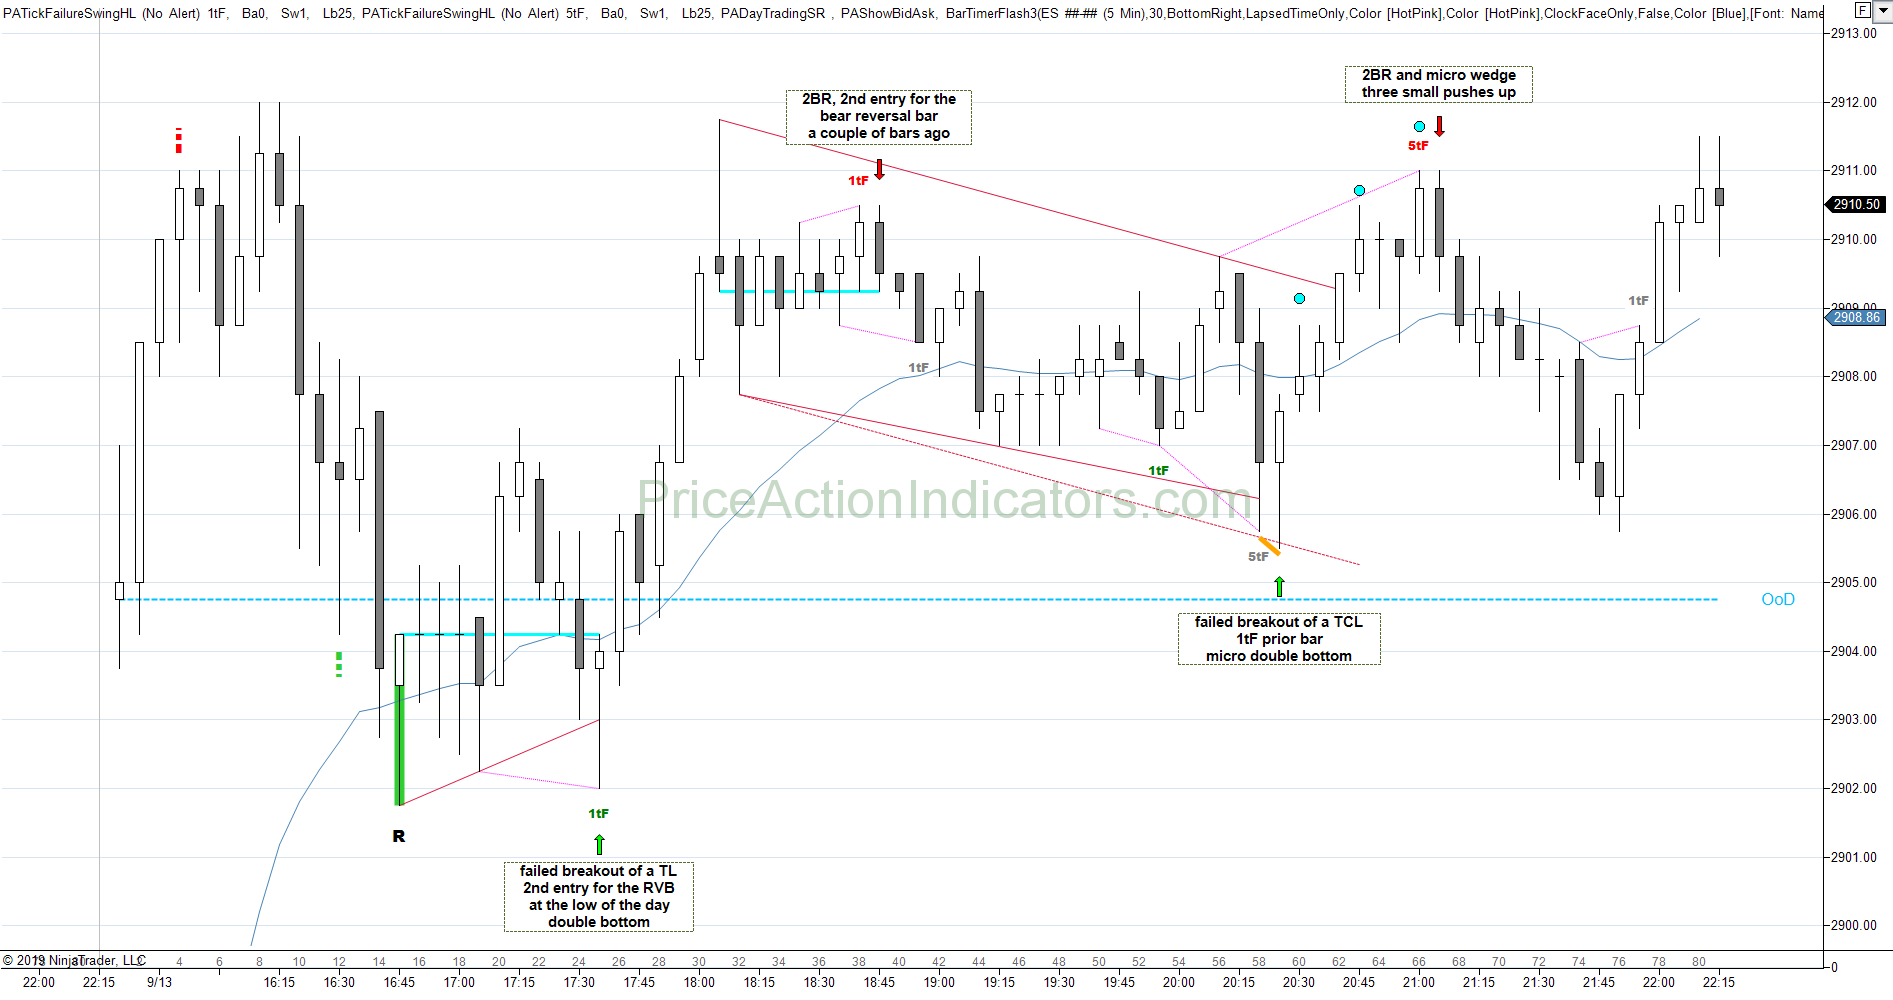
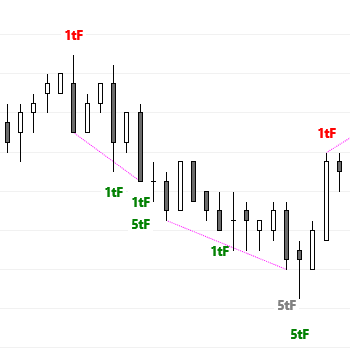
E-mini S&P 500 Future 5 min chart (click to enlarge)
Features
- shows Tick Failure Breakouts of possible Support and Resistance
- shows Tick Failure Breakouts above swing highs and below swing lows
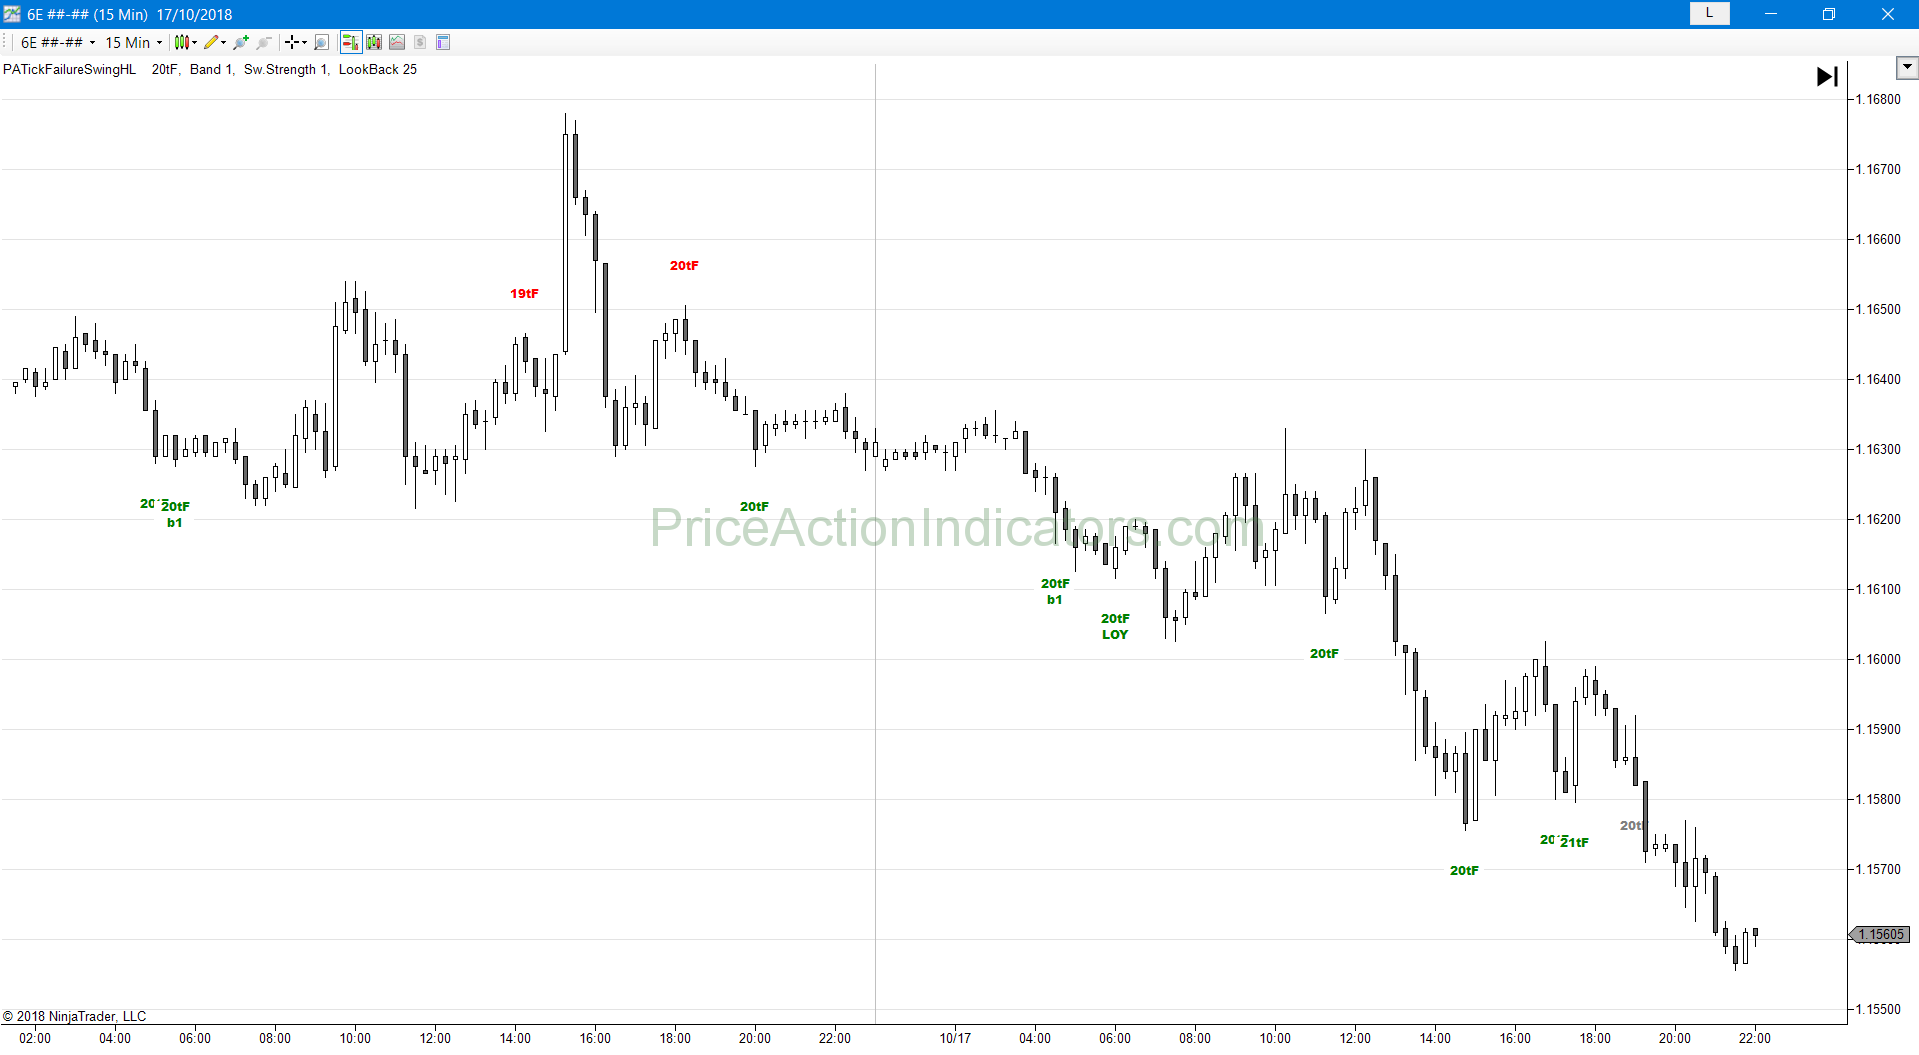
- shows Tick Failure Breakouts above the high and below the low of yesterday (HOY, LOY)
- shows Tick Failure Breakouts above the high and below the low of the 1st bar of the session (useful for RTH traders who trade charts with gaps)
- configure swing strength, bars to look back and individual colors
- use as a discretionary indicator and for Automated Trading with BloodHound
- alert feature
- does not work on Renko and PointAndFigure charts
- achieves best results on futures and equities (on centralized markets, where all participants seeing the same data)
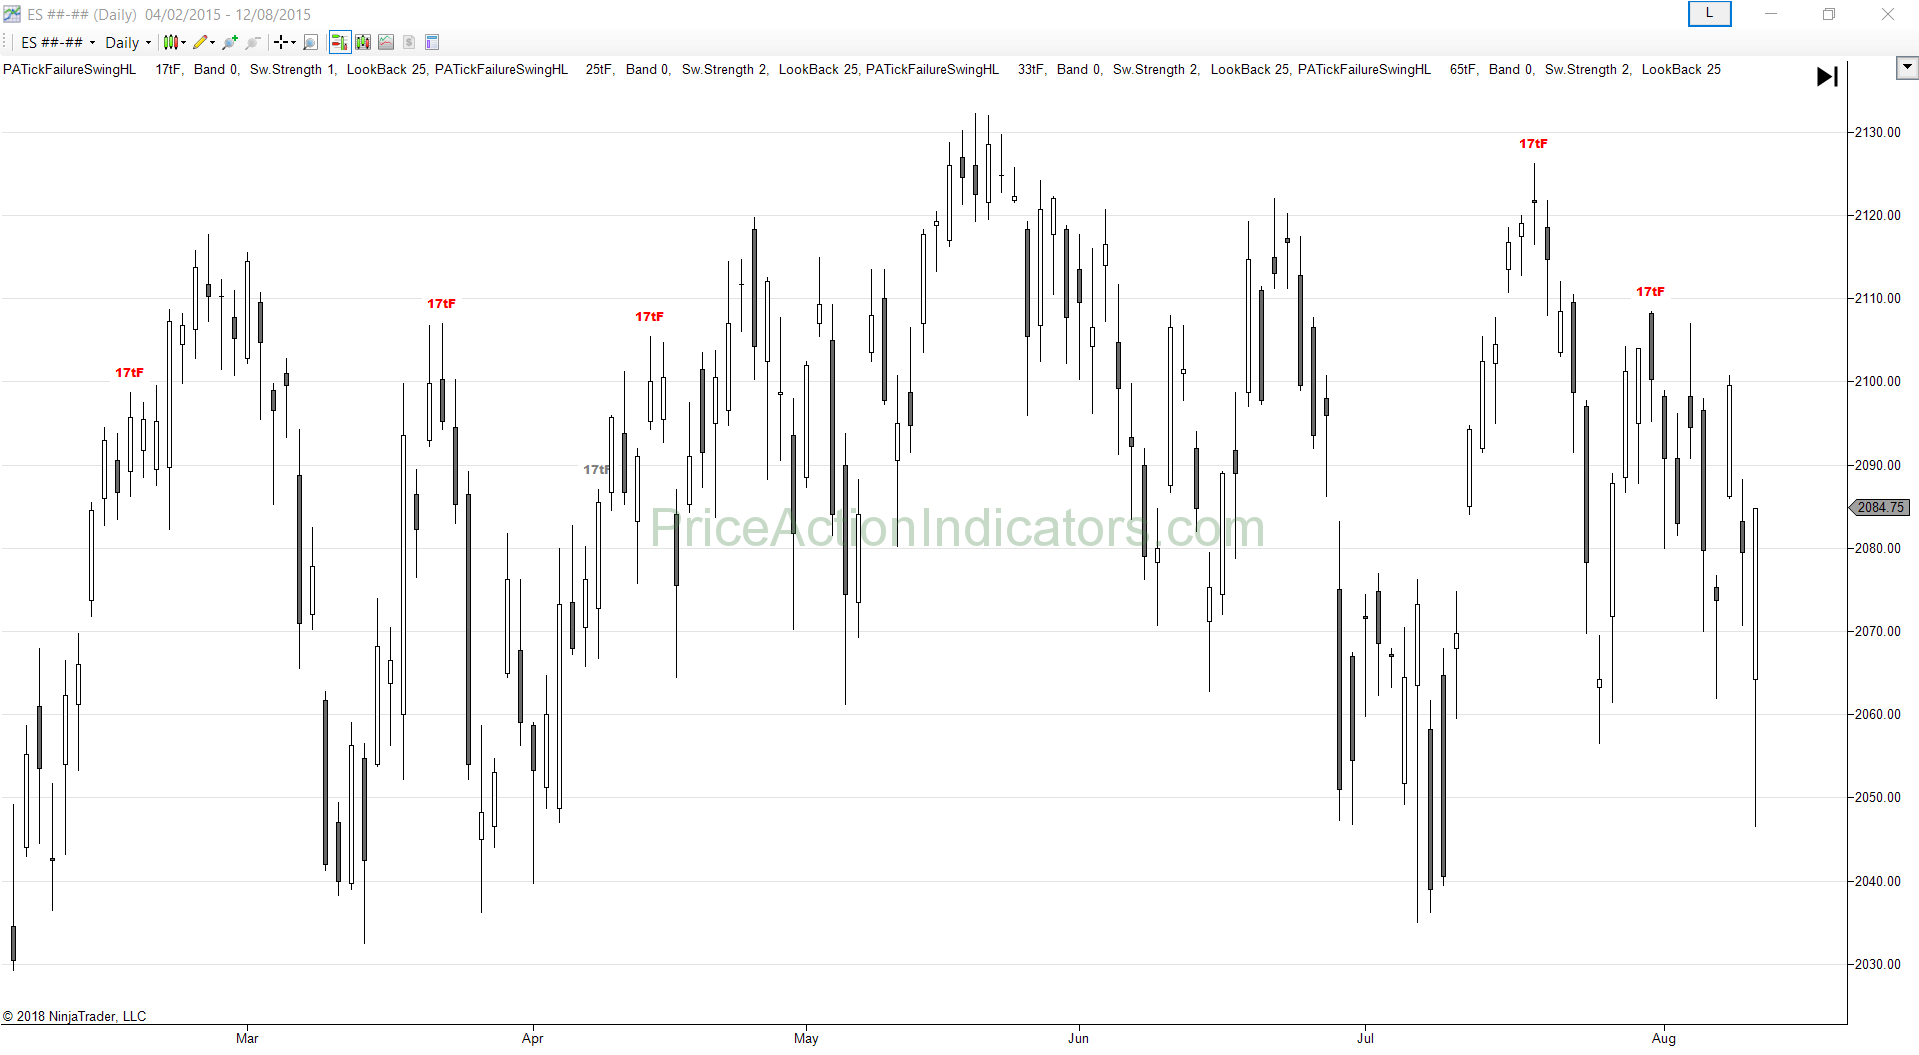
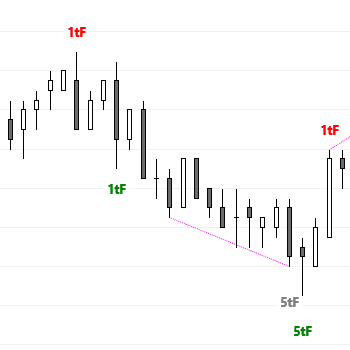
Example Charts


Download a 20 day trial version
Buy now for US $ 180
you get redirected to our reseller MyCommerce/Digital River/Share-it to place your order
to order you need your NinjaTrader® Machine ID (please see FAQ)
for license activation (please see FAQ)
Please contact us for a discount if you’re going to buy more than one indicator.
Automated Trading
Only the NinjaTrader 8 version of the S/R Breakout Failure Tick indicator is compatible with BloodHound from SharkIndicators. You can call it as well from your own NinjaTrader indicators or strategies. Read more here.
Examples from the Blog
Here are a couple of the latest blog posts, that highlight the signals of the Tick Failure Breakout indicator in context.
Read more here: More Charts
For advanced/experienced traders
Here you find a basic example, how one might trade Tick Failure Breakouts using a scale in approach.
Read more here: A Scale-In Trading Approach
What are Tick Failure Breakouts?
Tick Failure Breakouts are breakout failures (also called failed breakouts) of prior swing highs/lows, high/low of the 1st bar of the session and HOY, LOY (High/Low of Yesterday), to name a few.
1 or 2 tick Tick Failure Breakouts (on the E-mini) can be considered a failed breakout for traders, who entered on the breakout on a stop entry above/below that swing high/low. In stocks, Tick Failure Breakouts are often around one to a couple of cents, depending on the price and volatility of the stock.
5 tick Tick Failure Breakouts (on the E-mini) can be considered a failure to reach a common scalp target, since a scalp for four ticks (one point) is a very popular trade. A six tick breakout is needed to fill a four tick profit target for a trader who entered on a breakout (one tick to enter on a stop, four ticks profit, and one more tick to fill the profit target limit order). With higher volatility (and larger range/bars) that four tick scalp often becomes a scalp for six ticks.
A 5 tick Tick Failure Breakout (on the E-mini) also often means, that there were sellers above a swing high (for a bull breakout), who also might have scaled-in one point (four ticks) higher. The same can be true for a 9 tick Tick Failure Breakout, where sellers were able to scale-in twice above the swing high (one and two points higher).
Tick Failure Breakouts can be found in all liquid futures markets, that have many scalpers, like ES, NQ, CL, as well as ETFs like SPY or QQQ, highly liquid stocks and FOREX.
If you trade the MES, load the indicator on the ES chart (the volume is much larger) and take the trades on the MES.
What do I need to set the Tick Failure to?
Tick Failure Breakouts largely depend on the market and time frame you are trading. Some common scalp targets are (add one or two ticks (futures) for the failure):
ES – 4/6, 8, 10, 12 and 16 ticks
NQ – 10, 20 ticks
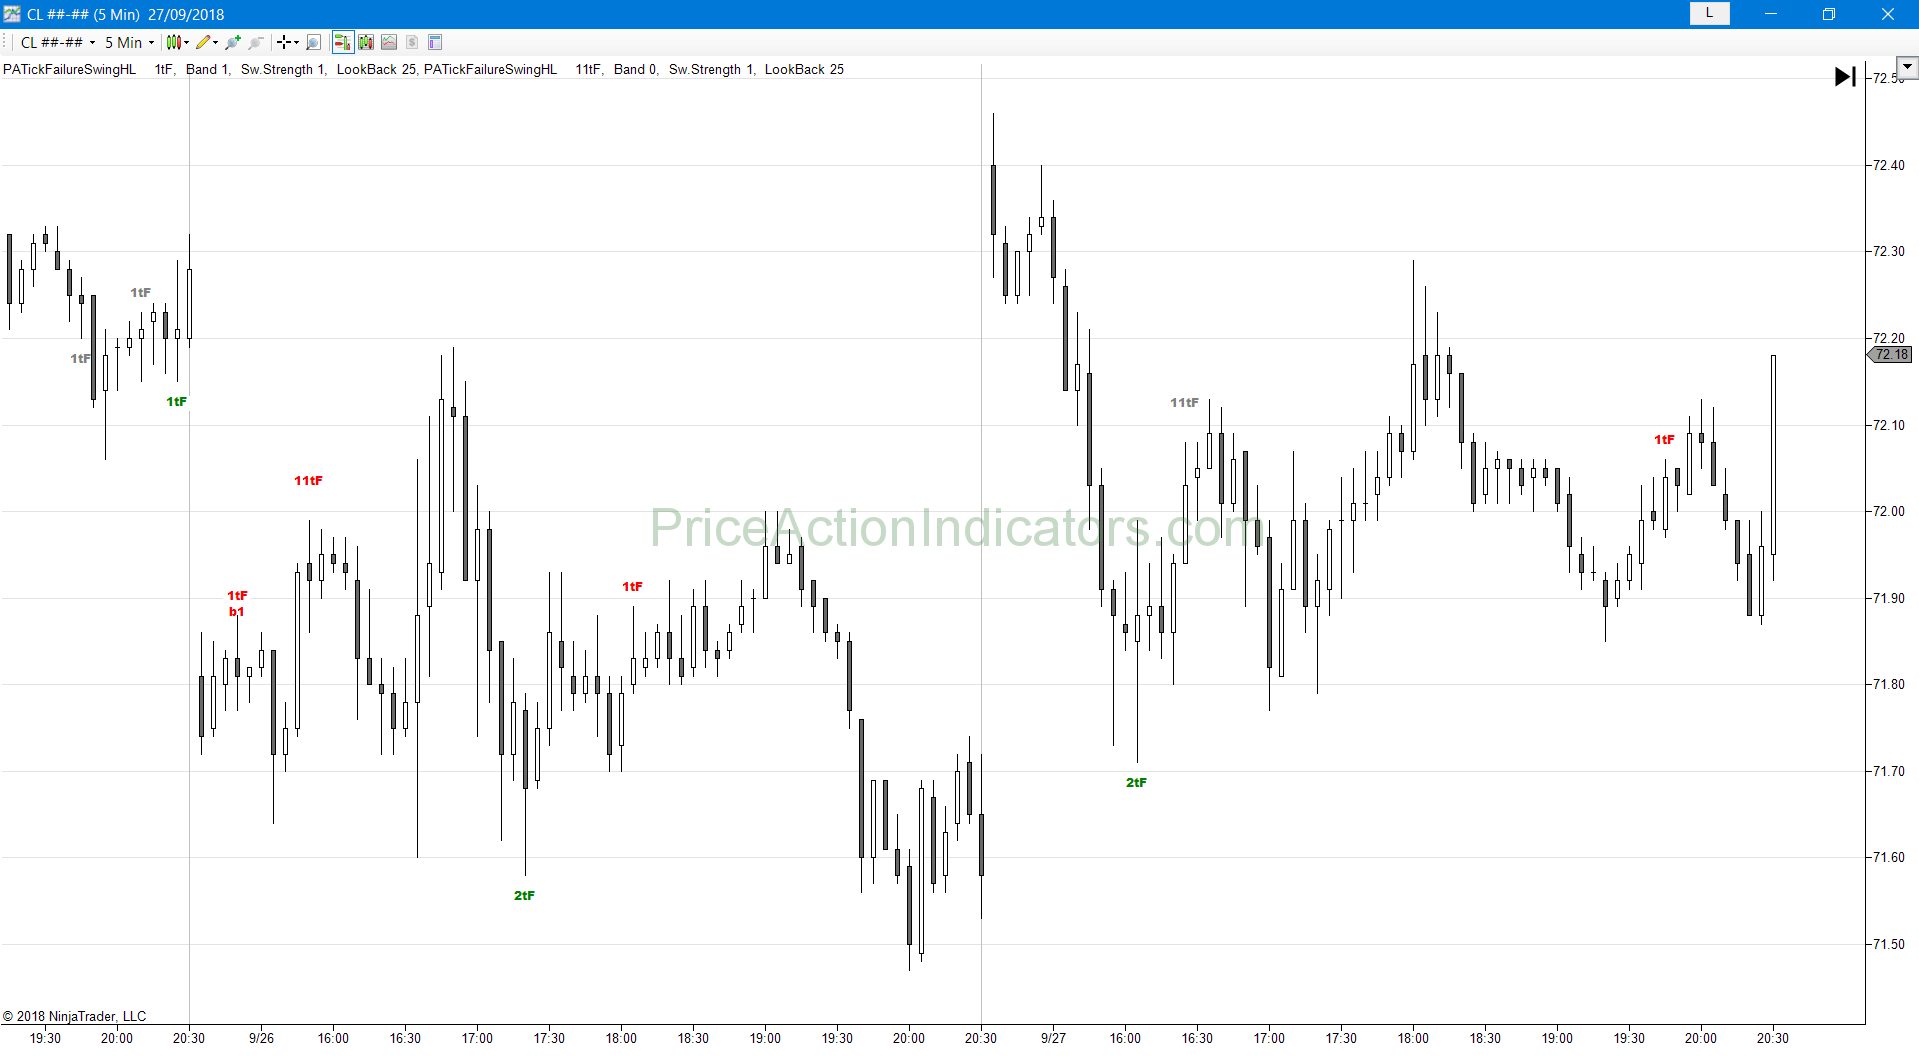
CL – 5, 10, 15 ticks
SPY – 10 ticks (cents)
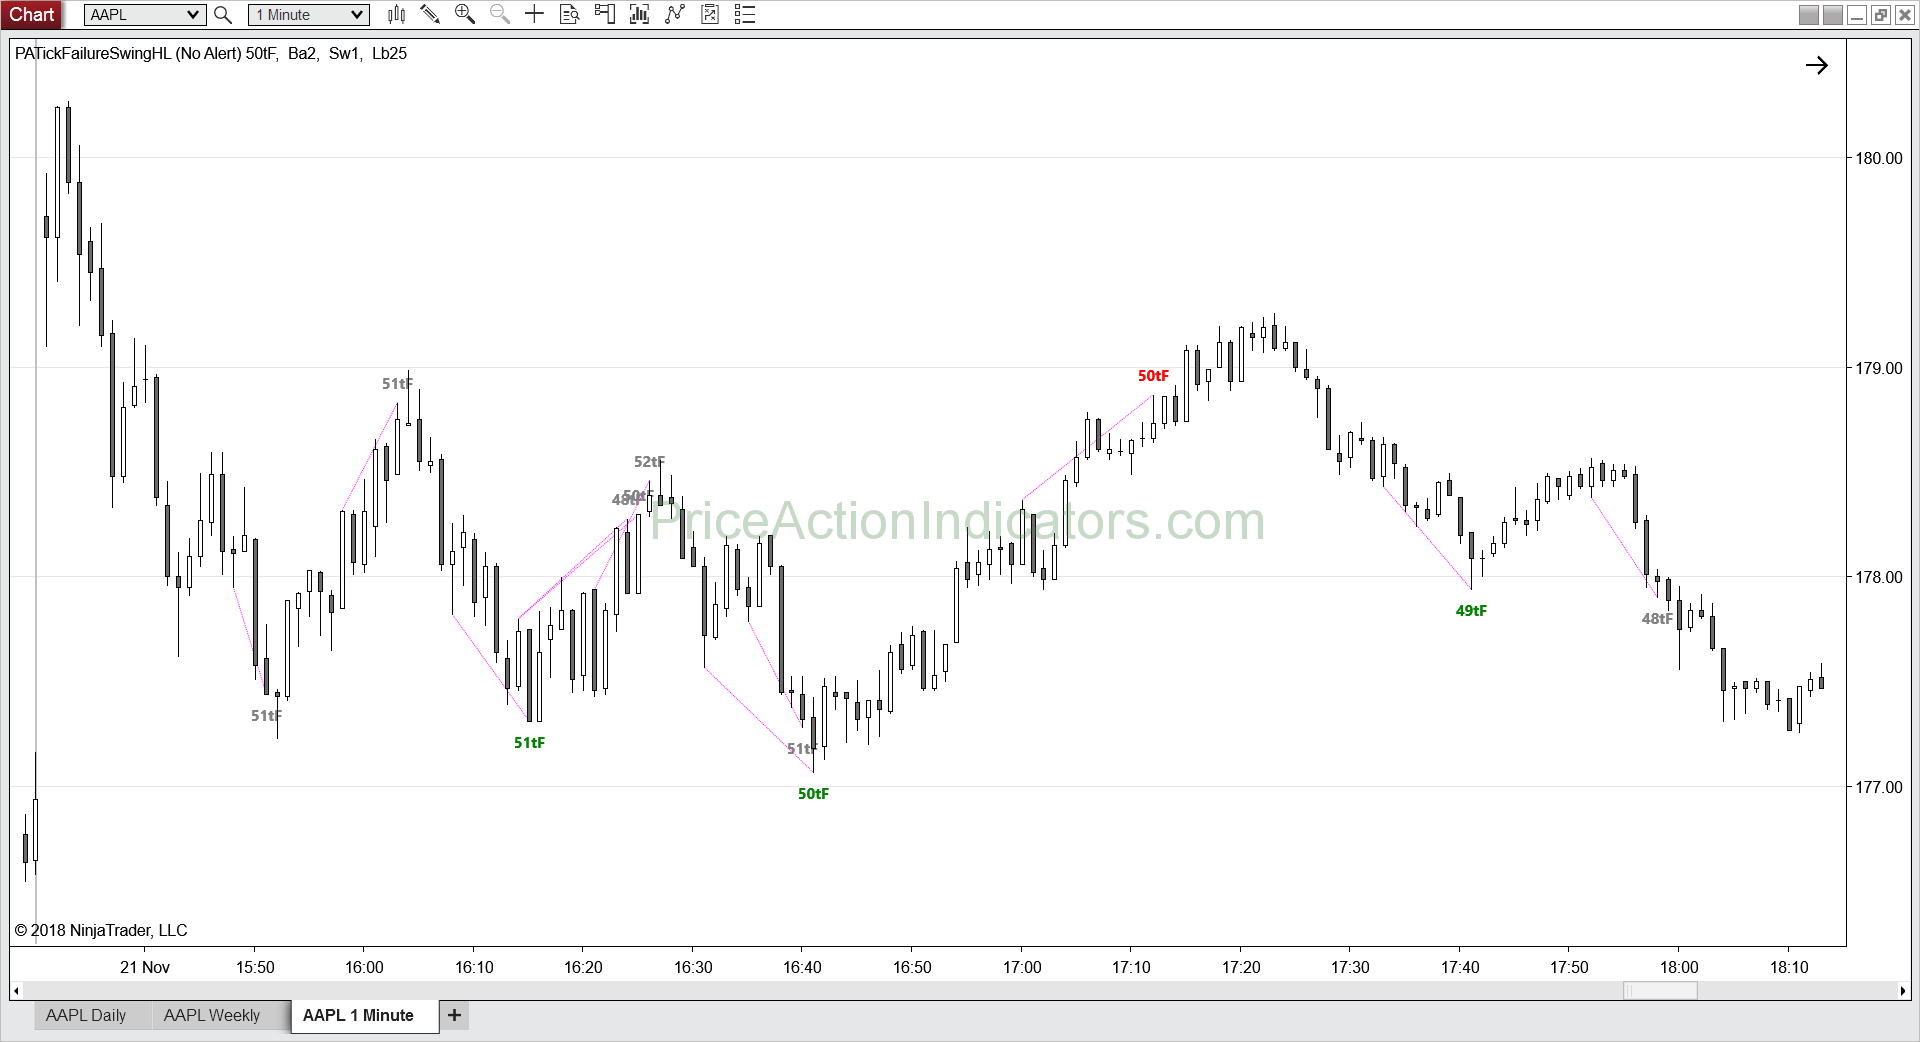
AAPL (Apple stock) – 50, 100 ticks (which is 50 cents and $1)
On the ES E-mini 5 min chart 1 or 2 tick failures are failed breakouts and 5 or 7, 9, 11, 13 and 17 ticks are failures to reach common scalp targets.
If you trade the MES, load the indicator on the ES chart (the volume is much larger) and take the trades on the MES with the price from the ES contract. Sometimes the MES overshoots though.
Best results are achieved on futures and equities.
Can I simply trade every signal?
This largely depends on context, trading style and stop loss (risk), also on your ability to scale in and the use of wide or swing stops (below the last higher low or above the last lower high in a trend) .
Check out the Blog for more examples on how to use Tick Failure Breakouts in your trading.
Look for confluence
Confluence is very important in trading and means to have several (at least two) reasons to take a trade. Your 1st reason is the Tick Failure Breakout and your 2nd reason can be e.g. Support / Resistance, measured moves, trend line / trend channel line overshoot, Buying/Selling Pressure, a 2nd attempt to reverse and many more.
What are the settings?
The settings probably need to be tweaked especially to the “personality” and time frame of the instrument you’re trading.
If you trade the MES, load the indicator on the ES chart (the volume is much larger) and take the trades on the MES with the price from the ES contract. Sometimes the MES overshoots though.
Indicator name: PASuppResBreakoutFailureTick
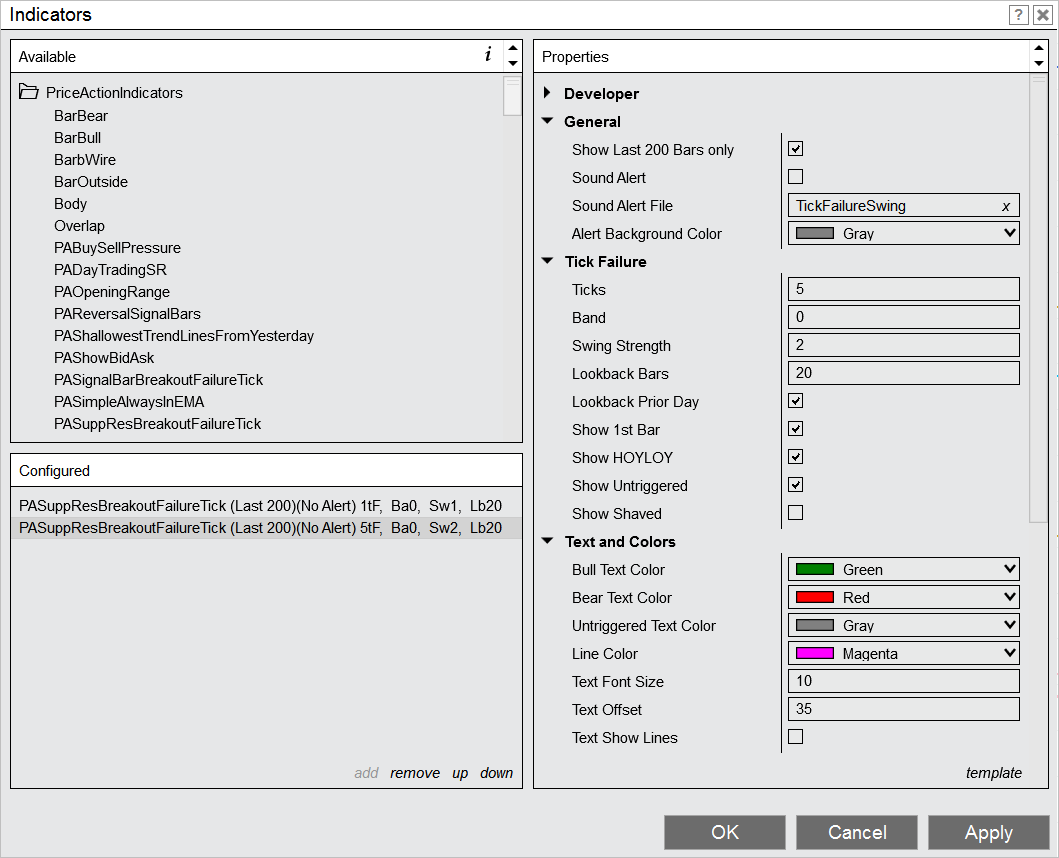
Show Last 200 Bars only
Show the indicator signals only for the last 200 bars, which will speed up a reload of the chart or indicator
Sound Alert
Play a sound and show an alert in the alert window
Sound Alert File
Pick a .WAV file from the NinjaTrader sound folder (how to install sounds, see here )
Ticks
Extend of the Tick Failure breakout in ticks
Band
Ticks above or below Tick Failure (e.g. set “Ticks” to 100 and “Band” to 2 to show 98, 99, 100, 101 and 102 Tick Failure breakouts)
Swing Strength
Show Tick Failure breakouts only for swings with a certain swing strength
1 = one bar with a lower high to the left and right of a swing high
Look back Bars
Number of bars back to look for a swing high or low
Look back Prior Day
Show Tick Failure breakouts of swing highs or lows from prior session
Show Bar 1
Show Tick Failure breakouts above or below the 1st bar of the session (useful, if you trade charts with gaps , like RTH
Show HOY LOY
Show Tick Failure breakouts of the High or Low of Yesterday
Show Untriggered
Otherwise Tick Failure breakouts, that don’t trigger (price go beyond the other end of the bar), will be deleted
Show Shaved close bars
A shaved close bar is bar with a strong close (on the high for bull or on the low for bear) showing possible strength against a possible fade trade.
| Show Shaved Close Bars
|
Don’t Show Shaved Close Bars
|
back to Indicators