
Automated Trading – Buy Sell Pressure (NT 8)
Only the NinjaTrader 8 version of the Buy Sell Pressure indicator is compatible with BloodHound from SharkIndicators or can be used in the Market Analyzer/Strategy Builder of NinjaTrader. You can call it as well from your own NinjaTrader indicators or strategies. It exposes the following data series and plots.
| Data Series / Plot | Type | Description / Value |
| BullMomentum | <Integer> | indicates a Bull Momentum pattern |
| BearMomentum | <Integer> | indicates a Bear Momentum pattern |
| BullExhaustion | <Integer> | indicates a Bull Exhaustion pattern |
| BearExhaustion | <Integer> | indicates a Bear Exhaustion pattern |
| BullMomentum_Extended (a) | <Integer> | indicates a Bull Momentum pattern |
| BearMomentum_Extended (a) | <Integer> | indicates a Bear Momentum pattern |
| BullExhaustion_Extended (a) | <Integer> | indicates a Bull Exhaustion pattern |
| BearExhaustion_Extended (a) | <Integer> | indicates a Bear Exhaustion pattern |
| Plot BullMomentum | n/a | indicates Bull Momentum ( +1 ) |
| Plot BearMomentum | n/a | indicates Bear Momentum ( +1 ) |
| Plot BullExhaustion | n/a | indicates Bull Exhaustion ( +1 ) |
| Plot BearExhaustion | n/a | indicates Bear Exhaustion ( +1 ) |
(a) Using the “Extend Signals for N bars” setting in the indicator settings, the initial signals can be extended to a fixed number of bars following it. If set to e.g. 5, a Buying Pressure signal from five bars ago is still “valid” on the current bar and indicated in the “_Extended” data series.
The following settings can be accessed from BloodHound:
| Indicator Setting | Description |
| show_MOM | Momentum signals |
| show_EXH | Exhaustion signals |
| showBodies | Checks the change of bodies of bars for BGP and SGP |
| showTails | Checks the change of tails of bars for BGP and SGP |
| showOverlap | Checks the change of overlap of bars for BGP and SGP |
| showBrsSrsOnOpen | Checks for gaps between the Opens of bars and the closes of prior bars |
| extend_Signals | Extend Signals for N bars, also refer here at the bottom of the page |
All other settings like e.g. ShowLast200, ShowAlert, SoundFile and all settings for the text or graphics aren’t used by BloodHound.
more on Buy/Sell Pressure signals
A basic BloodHound Setup
For a basic setup in BloodHound use two “Indicator Threshold Solvers”.
https://www.sharkindicators.com/documentation/confidence-solvers/indicator-threshold/
 |
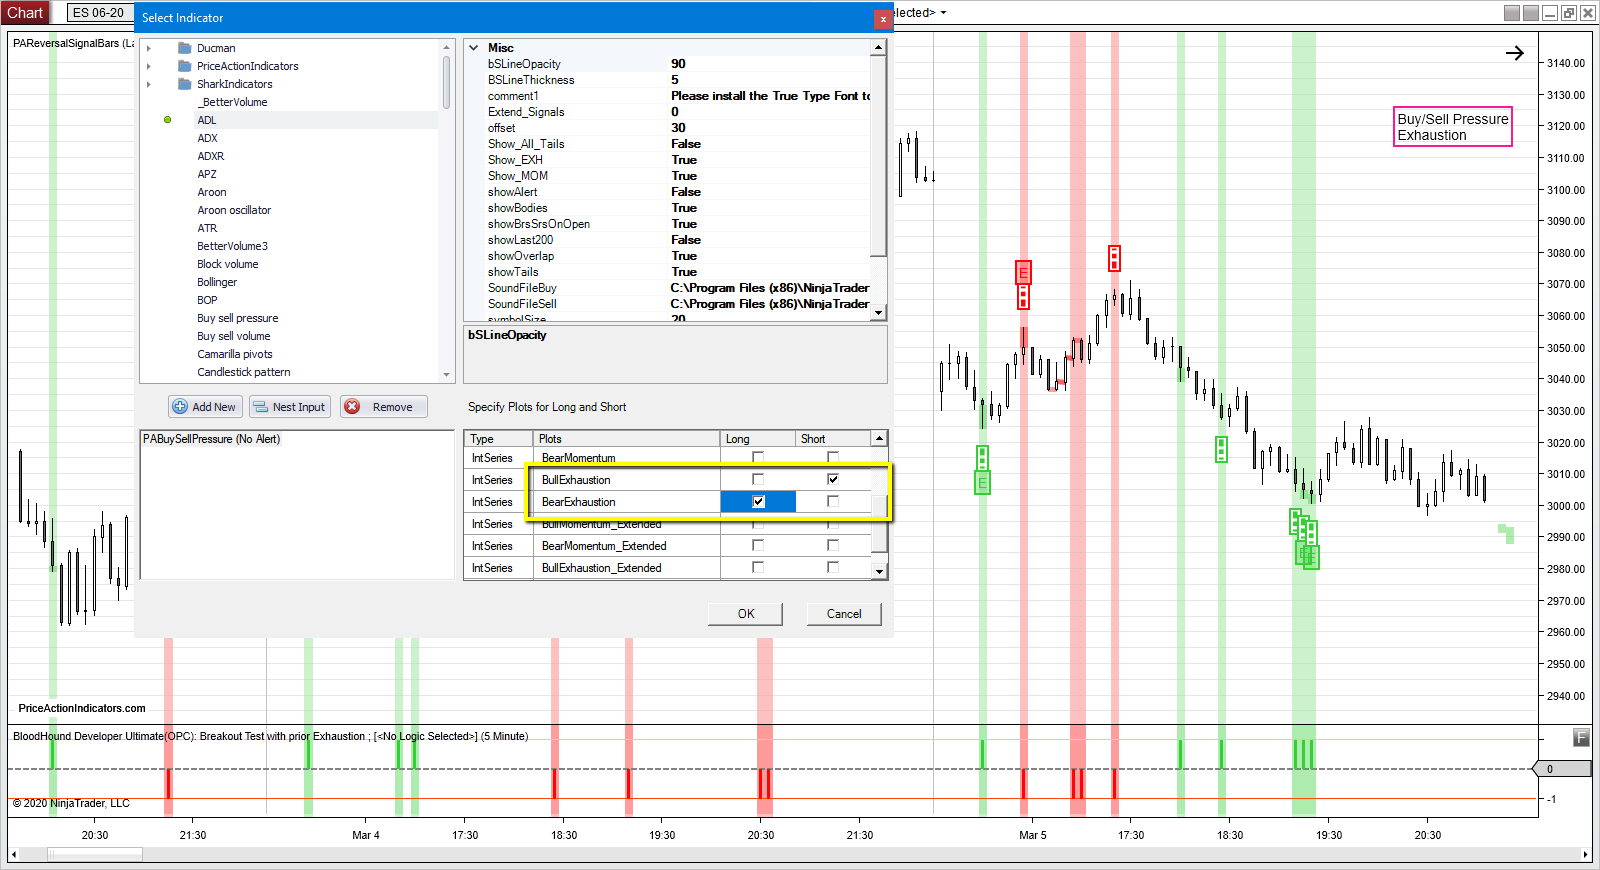
To filter all Reversal Bars or Patterns assign the Long side of the Threshold Solver to the RVB_Bull_Indication Series and the Short side to the RVB_Bear_Indication series .
Also setup the Thresholds like shown in the screenshot. |
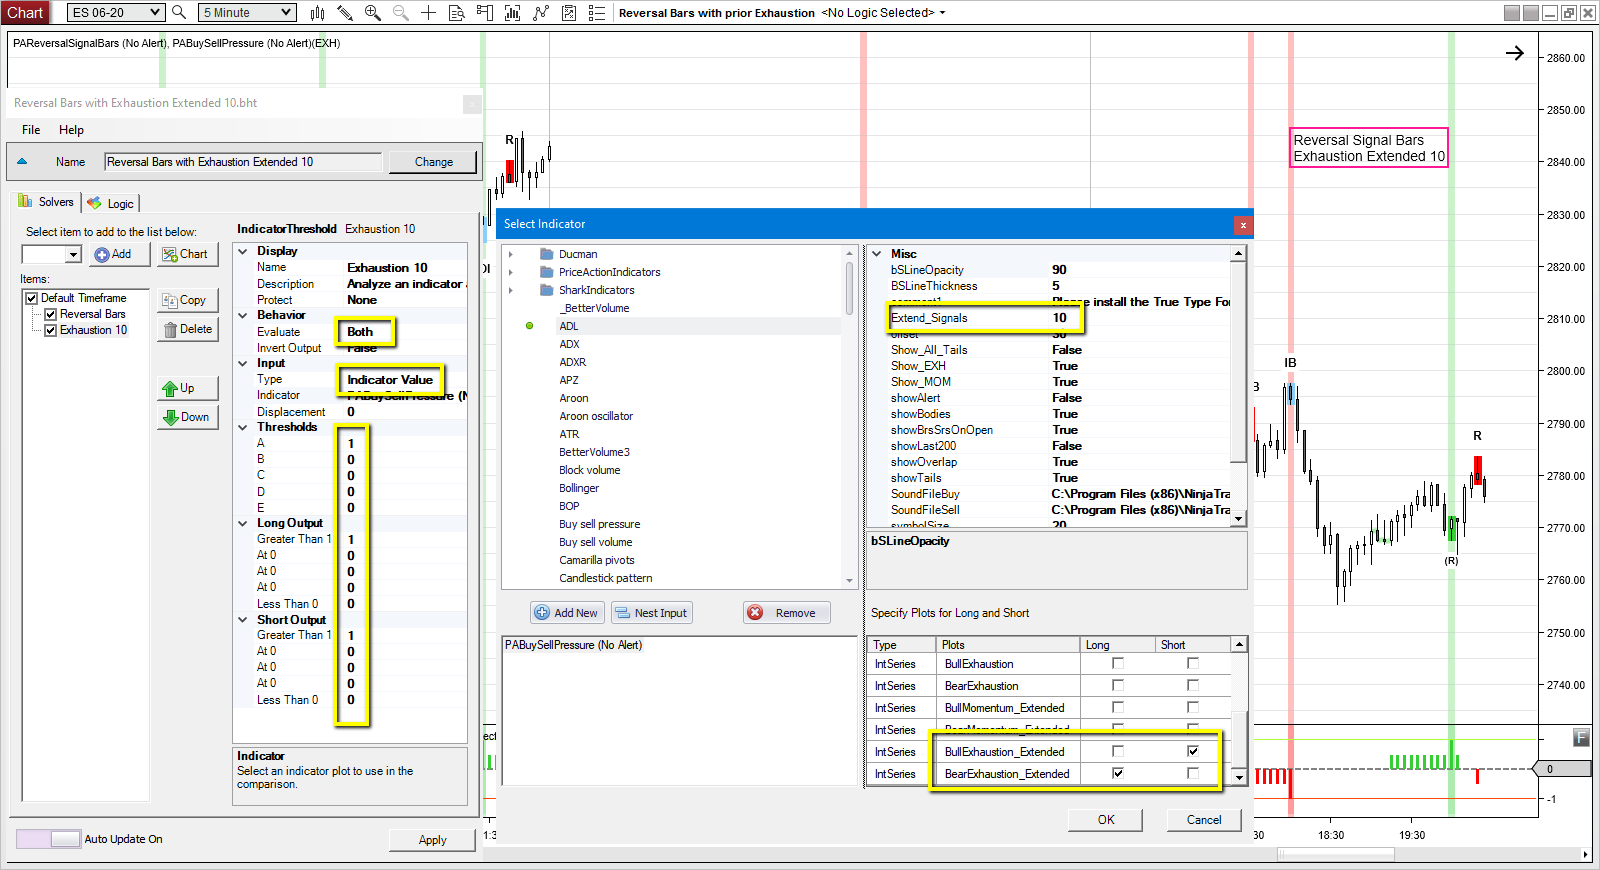 |
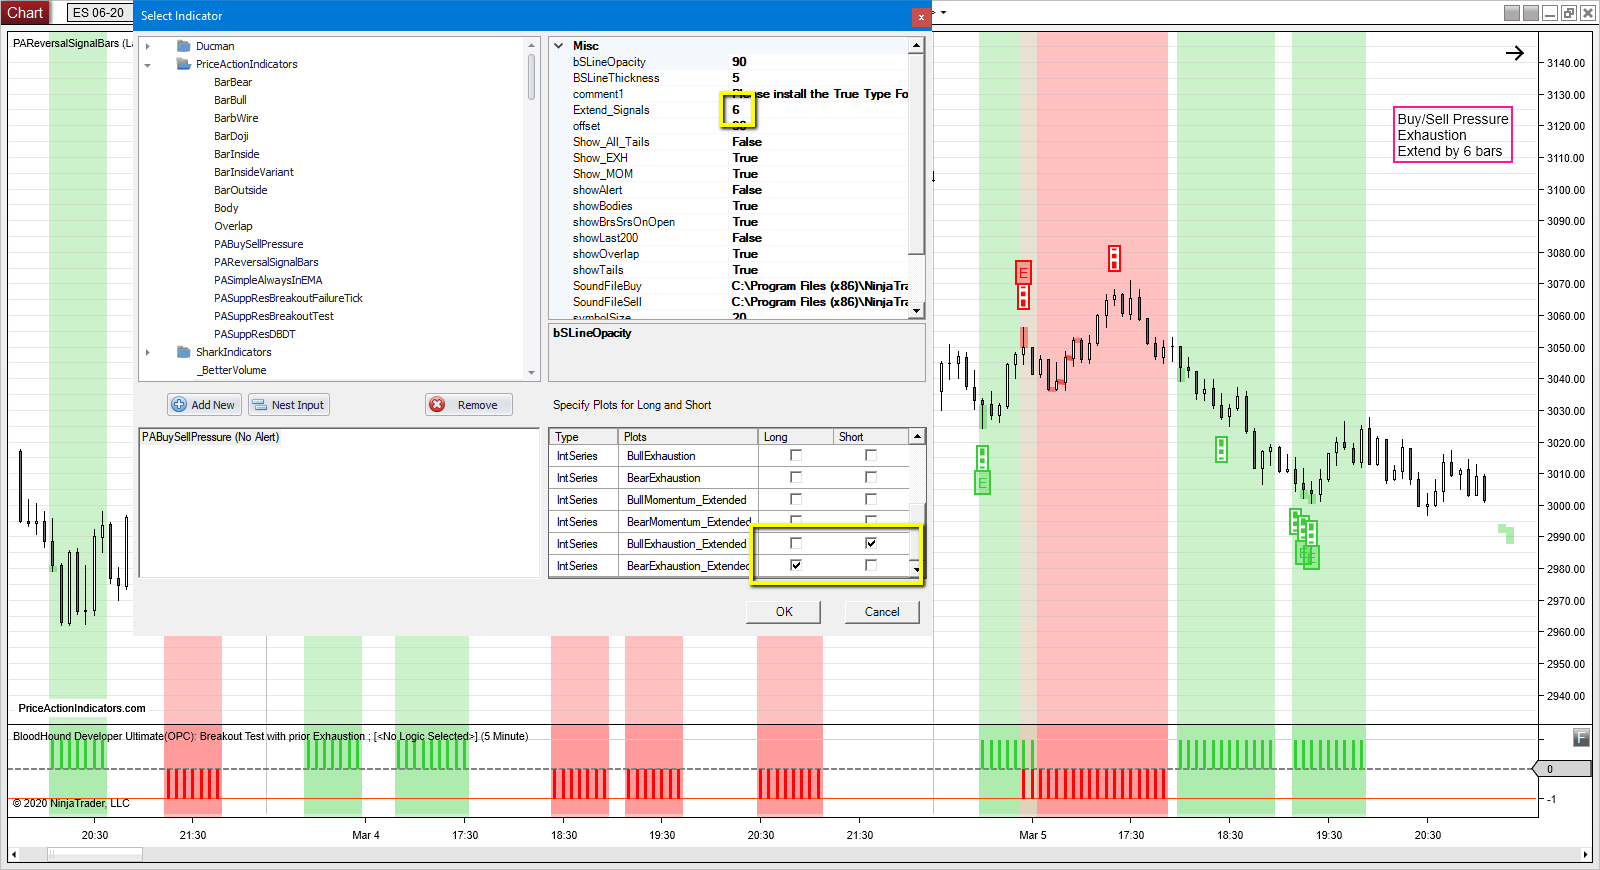
To filter only Reversal Bars or Patterns for prior Exhaustion, assign the Short side of the Threshold Solver to the BullExhaustion_Extended and the Long side to the BearExhaustion_Extended series.
Also setup the Thresholds like shown in the screenshot. |
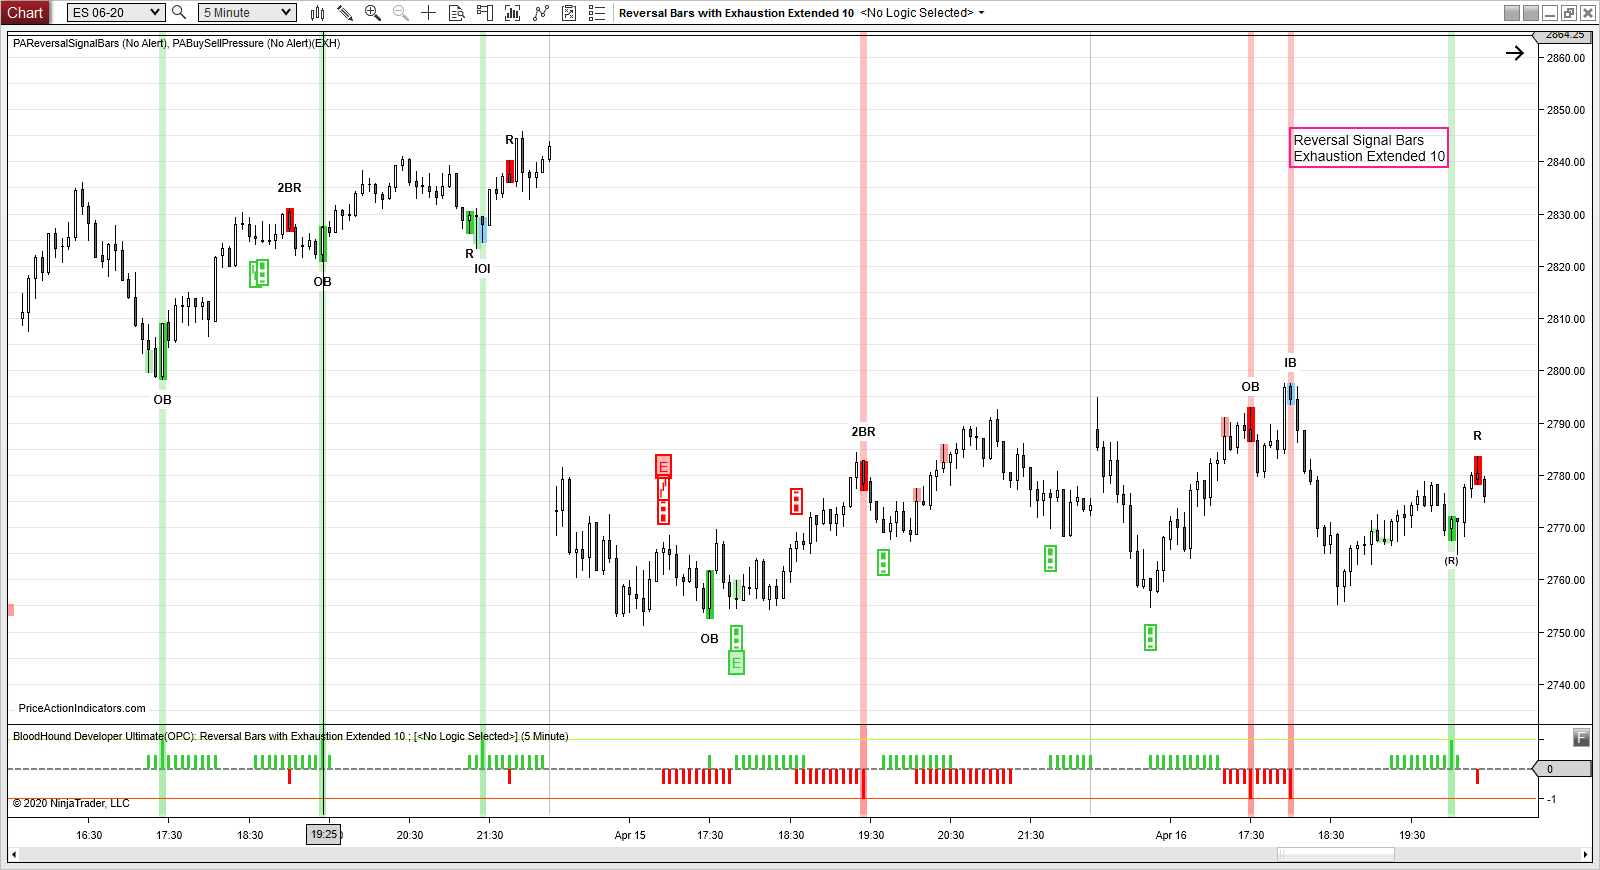
Resulting Chart
BloodHound Templates
Market Analyzer Column Setup
To setup a Market Analyzer Column follow the instructions in the NinjaTrader help guide:
https://ninjatrader.com/support/helpGuides/nt8/en-us/?market_analyzer.htm

|
|
First setup a new column with an indicator as an input value. Chose PAReversalSignalBars as that indicator. Be sure to also setup the right Data Series and Time Frame. This screenshot is for Buying Pressure. Setup another column for Selling Pressure (the Short side). https://ninjatrader.com/support/helpGuides/nt8/en-us/?working_with_columns.htm |
|
|
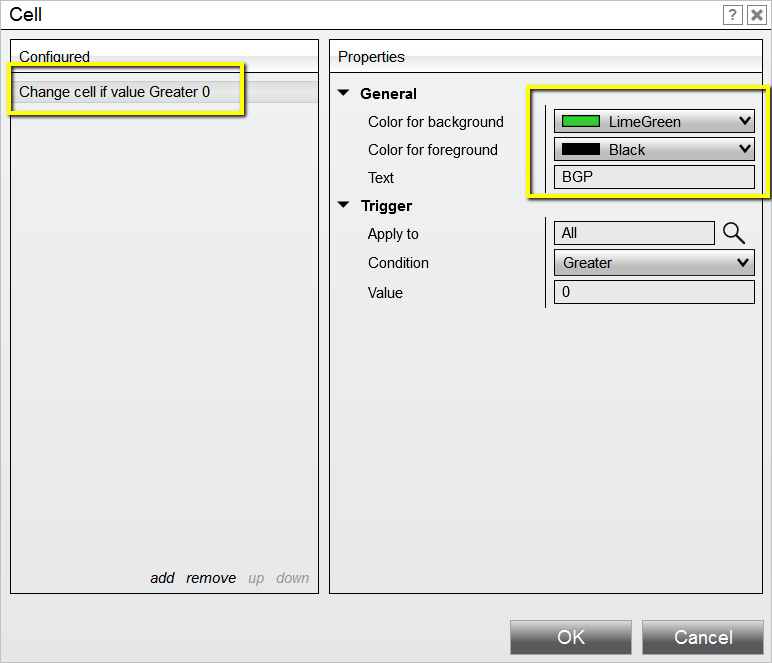
To highlight cells in the new column, setup a cell condition. One for the Buying Pressure and another one for a Selling Pressure column. https://ninjatrader.com/support/helpGuides/nt8/en-us/?creating_cell_and_filter_condi.htm |

Market Analyzer Template
Download the file “Market_Analyzer_Templates.zip” from here and open it. The file contains two Market Analyzer templates to show how Price Action Indicators can be used with NinjaTrader Market Analyzer.
Just copy the .xml files to the following folder and open them in the Market Analyzer.
…\Documents\NinjaTrader 8\templates\MarketAnalyzer\
Calling PABuySellPressure from a Custom indicator or strategy
Please, always download the latest version of the Price Action Indicators from the Download page.
For indicator properties please also refer to the settings on the indicator page):
PABuySellPressure(bool show_MOM, bool show_EXH, bool showBodies, bool showTails, bool showOverlap, bool showBrsSrsOnOpen, int extend_Signals);
example for a Buy signal
if (PABuySellPressure(true, true, true, true, true, true, 6).BearExhaustion_Extended[0]>0) BackBrushes[0] = Brushes.LightGreen;
example for a Sell signal
if (PABuySellPressure(true, true, true, true, true, true, 6).BullExhaustion_Extended[0]>0) BackBrushes[0] = Brushes.LightPink;
NinjScript source code
ExampleForPAI.cs (download) is a small NinjScript source code file, that has a couple of examples in it how to call the Price Action Indicators from another indicator or strategy. If the file is displayed in the browser window you need to right click “Save link as”.
The file needs to be copied to the following folder. …\Documents\NinjaTrader 8\bin\Custom\PriceActionIndicators\
Please contact us for more examples or questions.
What do the signal mean?
More Charts
Automated Trading
Please tell us what you think is missing, any kind of feedback is highly appreciated – contact us
Back to Buy Sell Pressure