
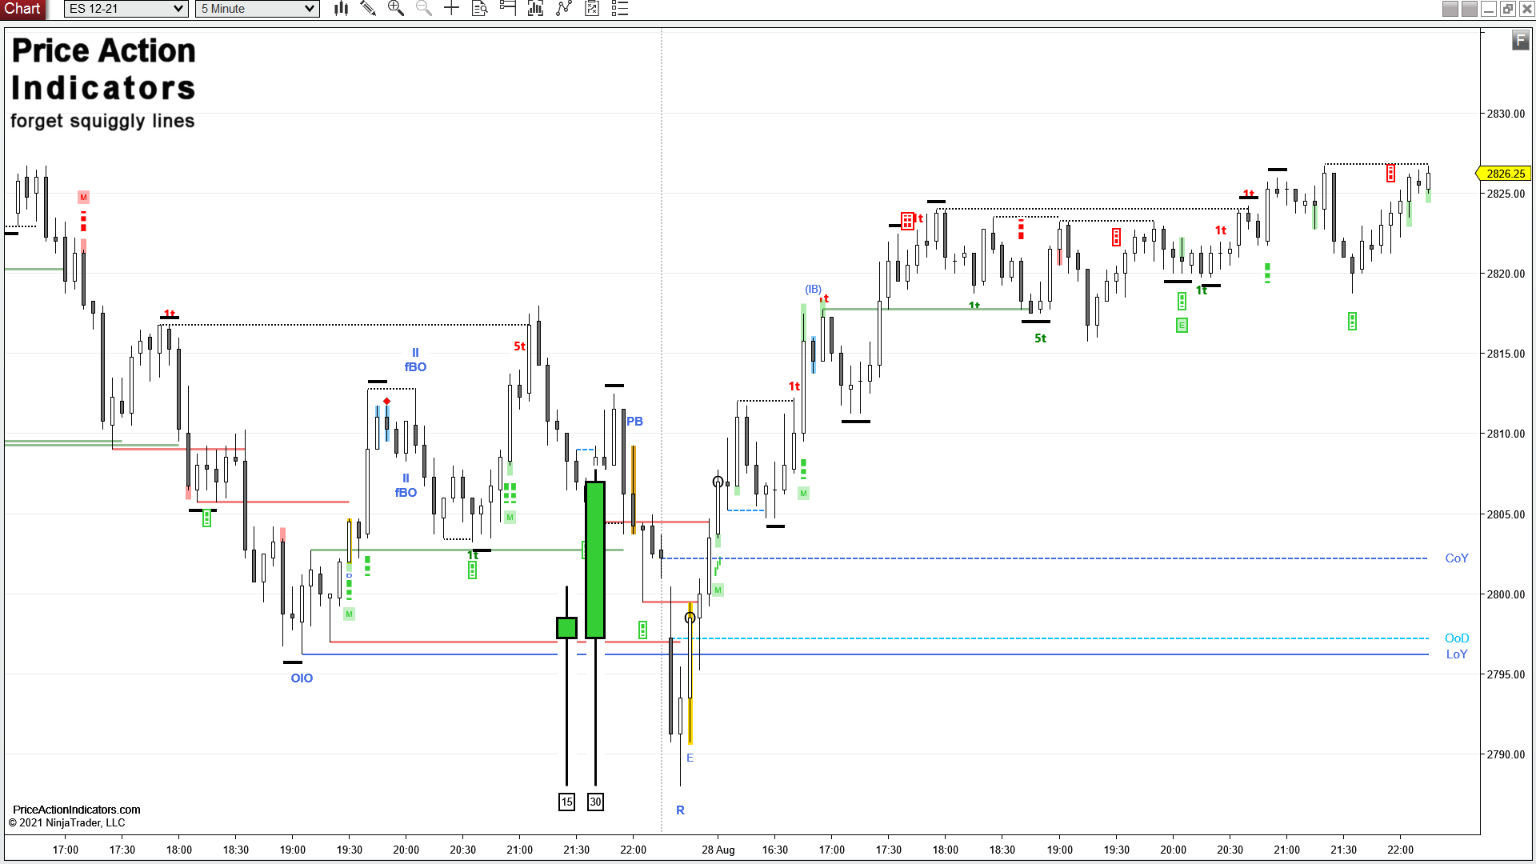
Price Action Indicators – forget squiggly lines!
Analyzing bar charts in such detail is a new approach to Price Action Trading. Our portfolio of indicators is meant to support a Price Action trading style. Keeping the market context (Trend, Trading Range or Reversal) in mind, you can use our knowledge to find high probability entries.
Whether you scalp or swing trade, our indicators can show you setups with favorable risk/reward profiles for your trading style. Most of our NinjaTrader 8 indicators can be used for Automated Trading as well.
You can use our indicators on any instrument and time frame, also range, tick, volume, reversal and many other types of charts. They probably need to be tweaked especially to the “personality” and time frame of the instrument you’re trading.
Confluence is very important in trading and means to have several (at least two) reasons to take a trade. Your 1st reason can be a Reversal Signal Bar and your 2nd reason can be e.g. Support/Resistance, a trend line overshoot, Buying/Selling pressure, Tick Failure Breakouts and many more.
This is what Price Action Indicators is about. Confluence of signals at support/resistance.
Trend (Strength) and Reversal
The Buy Sell Pressure indicator is a new approach to Price Action trading. It identifies Momentum and Exhaustion by examining bar features and relation to prior bars.
The Reversal Signal Bars indicator identifies 10+ different Signal Bars or patterns for possible reversals by examining bar features and relation to prior bars.
The Simple AlwaysIn EMA indicator is using recent bar closes to calculate the “Always In” direction. A trader preferably should be looking to enter the market in that direction only. A squiggly line, but with a different approach ?
 |
Buy Sell Pressure | Trend & Reversal | NT 7 and 8 | Automated Trading with NT 8 |
Buy now for
|
 |
Reversal Signal Bars | Trend & Reversal | NT 7 and 8 | Automated Trading with NT 8 |
Buy now for
|
 |
Simple AlwaysIn EMA | Trend & Reversal | NT 7 and 8 | Automated Trading |
Free to use |
Price at Support & Resistance
Support and resistance of the prior days are important levels where lots of buyers and sellers are willing to trade a security.
The Day Trading S/R Pro indicator shows price action at these support/resistance levels.
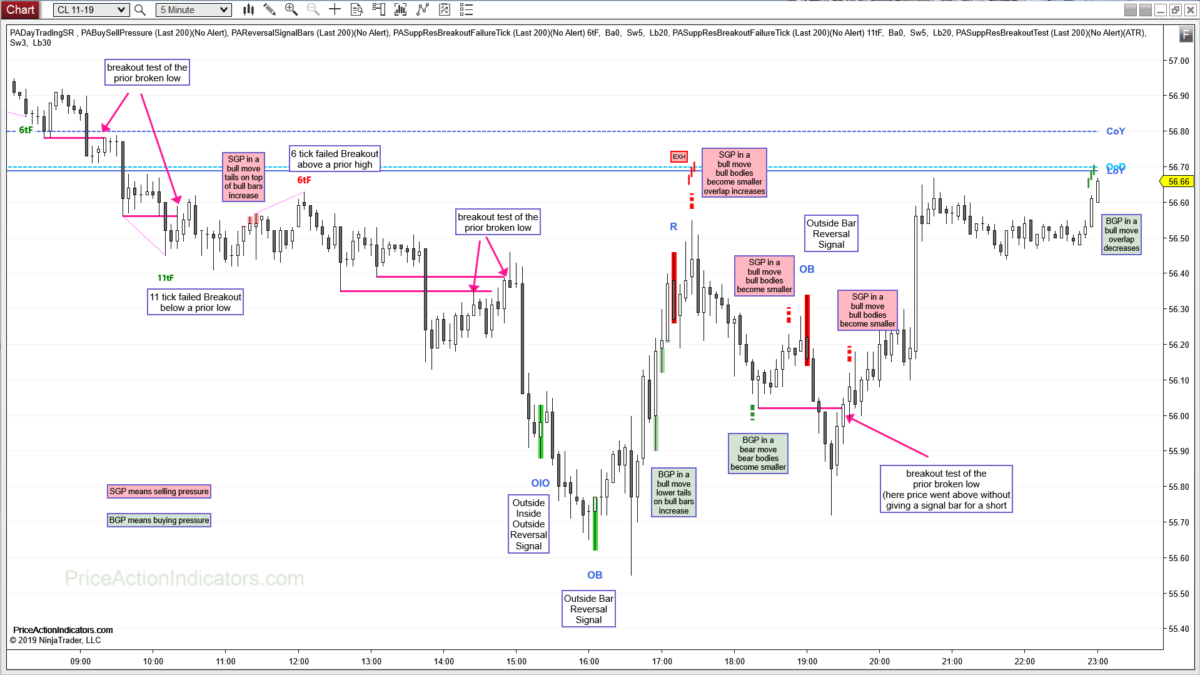
Breakouts often fail after a certain number of ticks beyond the breakout point (faders sell above or buy below a breakout point and scale in), that is what the Breakout Failure indicator looks at.
If a breakout is successful you often have a breakout test of the breakout point (faders of the breakout buy back / sell out of their positions around the breakout point). That is what the Breakout Test indicator may be used for.
The Double Bottom/Top indicator can be used to spot a test of support or resistance before there is a breakout.
Notice a possible change of sentiment during the forming of the Opening Range using the Price Action Opening Range indicator.
 |
Day Trading S/R Pro | Support & Resistance | NT 8 only | 
|
Buy now for
|
 |
Double Bottom/Top | Support & Resistance | NT 8 only | Automated Trading with NT 8 |
Buy now for
|
 |
Breakout Failure | Support & Resistance | NT 7 and 8 | Automated Trading with NT 8 |
Buy now for
|
 |
Breakout Test | Support & Resistance | NT 7 and 8 | Automated Trading with NT 8 |
Buy now for
|
 |
Opening Range | Support & Resistance | NT 8 only | New Update |
Buy now for
|
 |
Day Trading S/R | Support & Resistance | NT 7 and 8 |
Free to use |
|
 |
Gaps from Prior Days | Support & Resistance | NT 7 and 8 |
Free to use |
|
 |
Shallowest Trend Lines from Yesterday | Support & Resistance | NT 7 and 8 |
Free to use |
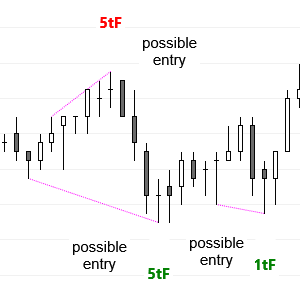
The Signal Bar – Breakout Failure indicator is a new approach to Price Action trading. It shows Tick Failure Breakouts above or below possible Signal Bars in real-time and suggests possible entry methods.
 |
SB Breakout Failure | Signal Bar | NT 7 and 8 | Automated Trading with NT 8  |
Buy now for
|
 |
Show Bid/Ask Size | Other | NT 7 and 8 |
Free to use |
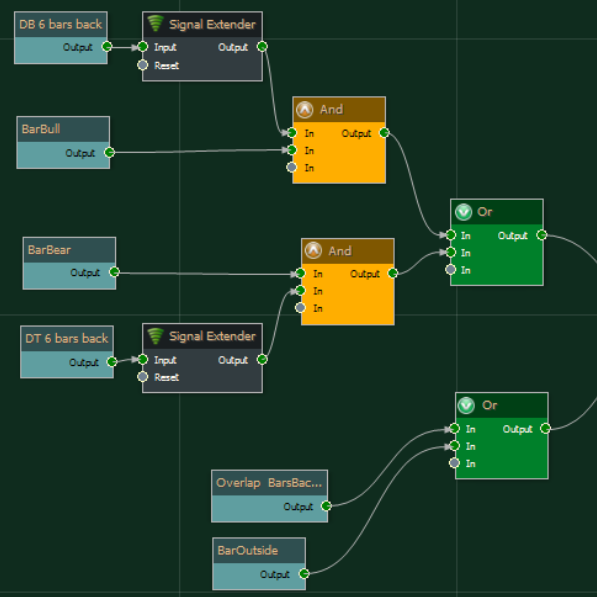 |
BloodHound Templates | Automated Trading | NT 8 only | |
Free to use |
 Please contact us for a discount if you’re going to buy more than one indicator.
Click “Buy now” and you get redirected to our reseller MyCommerce / Digital River to place your order.
To order you need your NinjaTrader® Machine ID (please see FAQ). For license activation (please see FAQ)
5 min Crude Oil Future chart with Price Action Indicators

Check out our E-mini Blog, we use Price Action Indicators in our daily trading.
NinjaTrader® is a registered trademark of NinjaTrader Group, LLC. No NinjaTrader company has any affiliation with the owner, developer, or provider of the products or services described on this website, or any interest, ownership or otherwise, in any such product or service, or endorses, recommends or approves any such product or service.