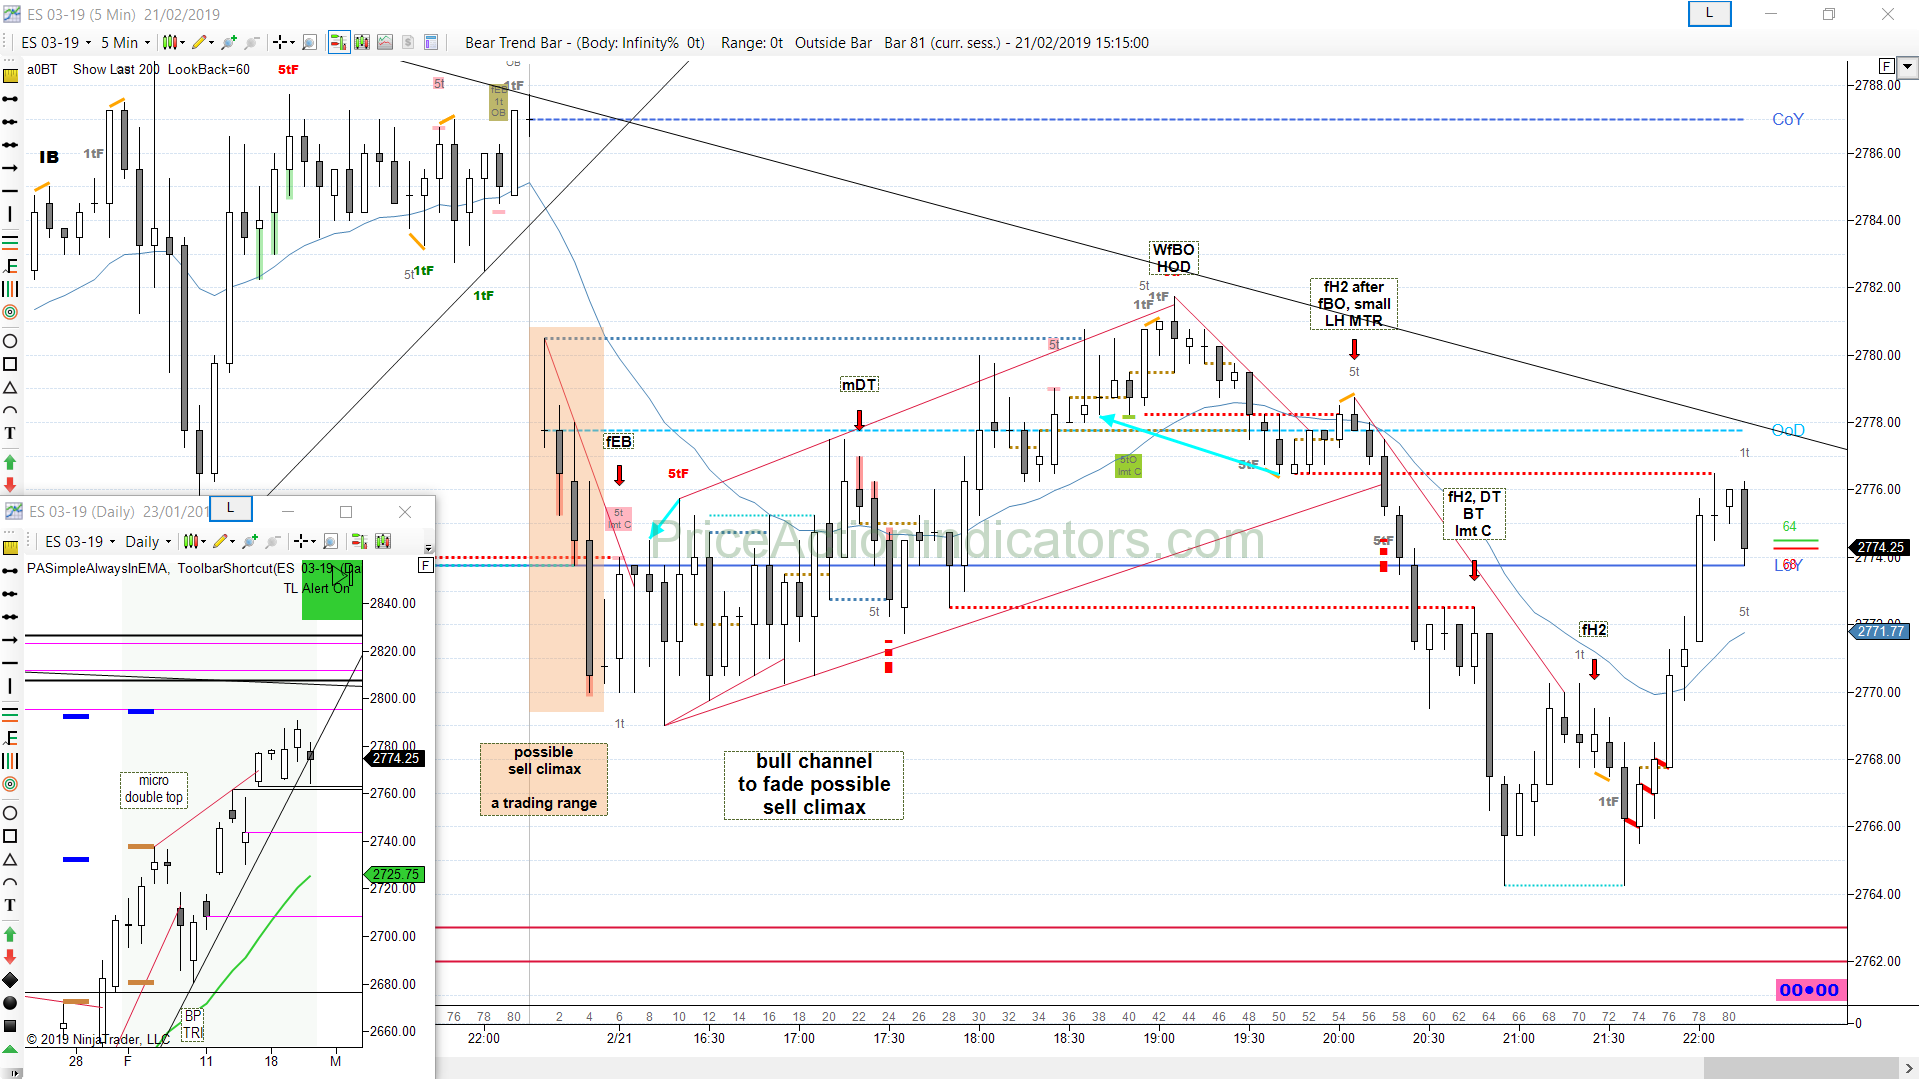
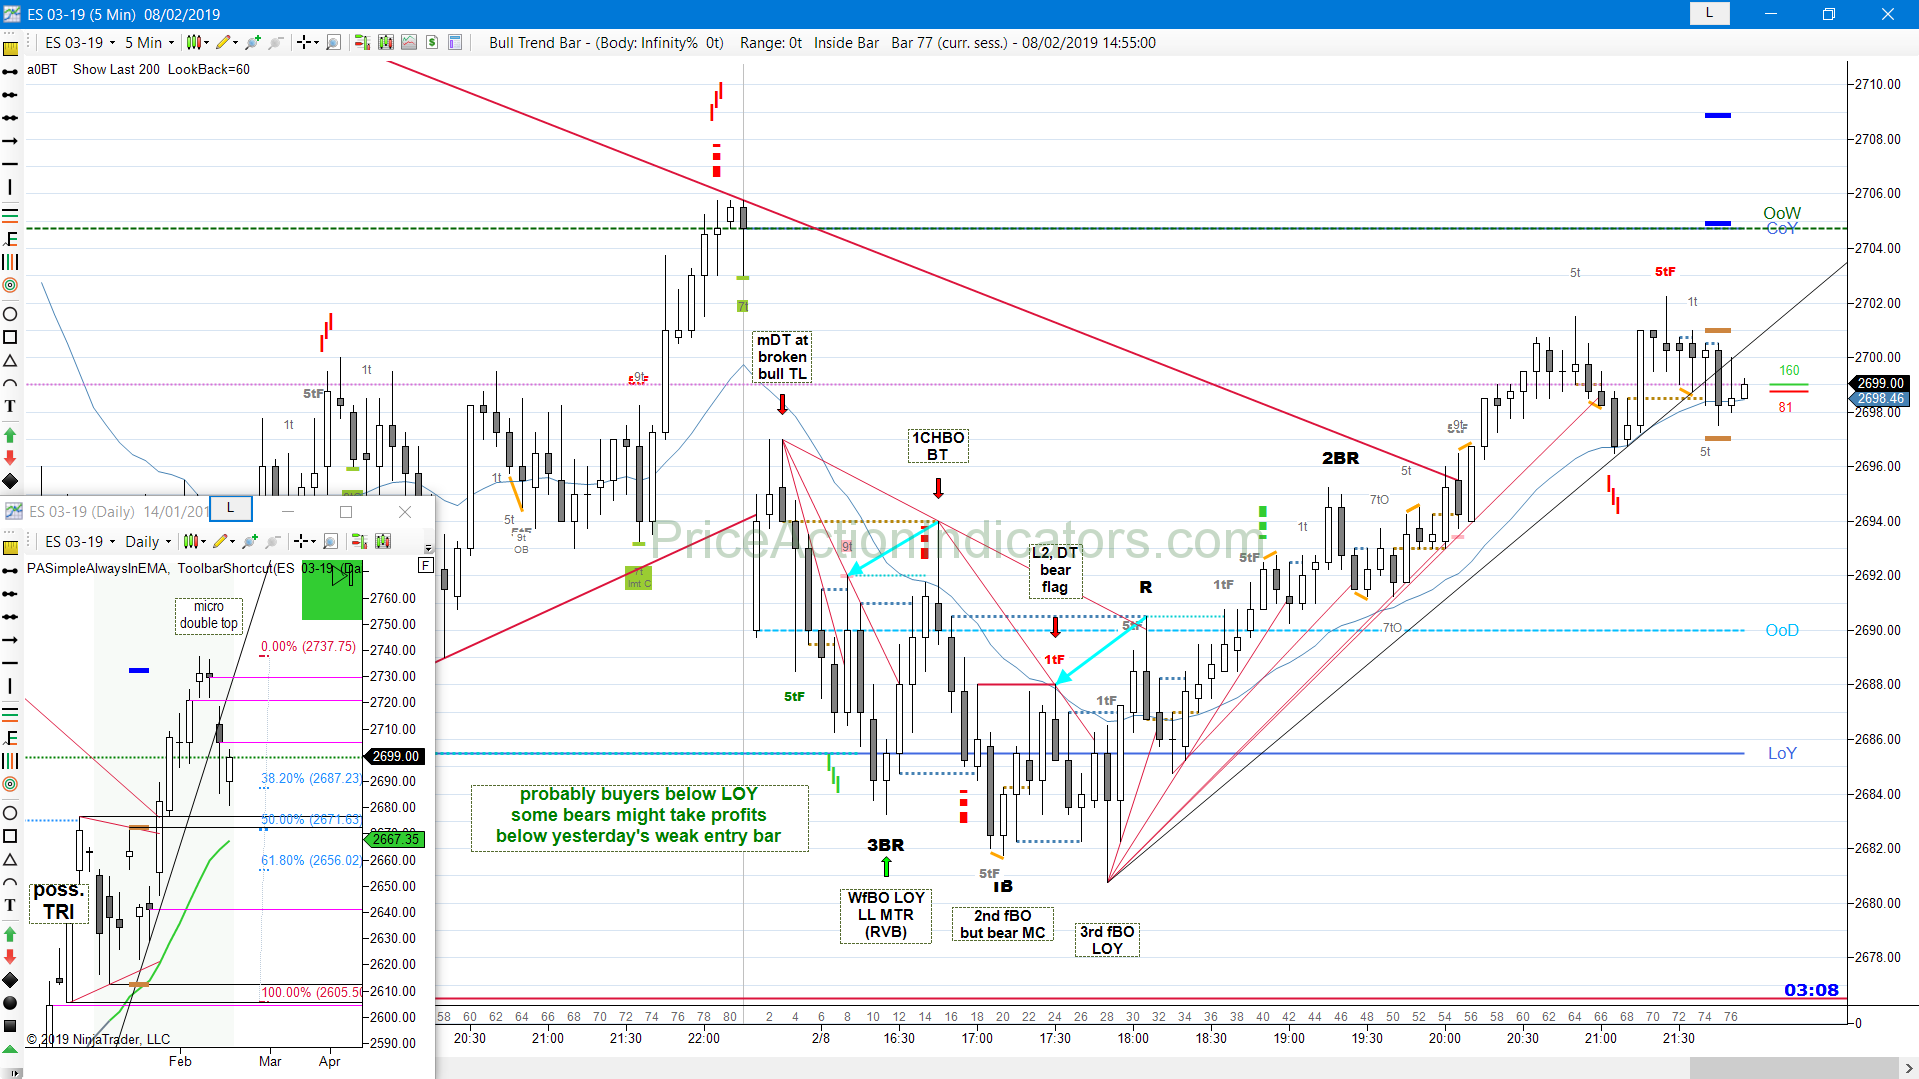
Bear gap, mid range, SX, fEB, mDT, bull CH, WfBO, fH2, LH MTR
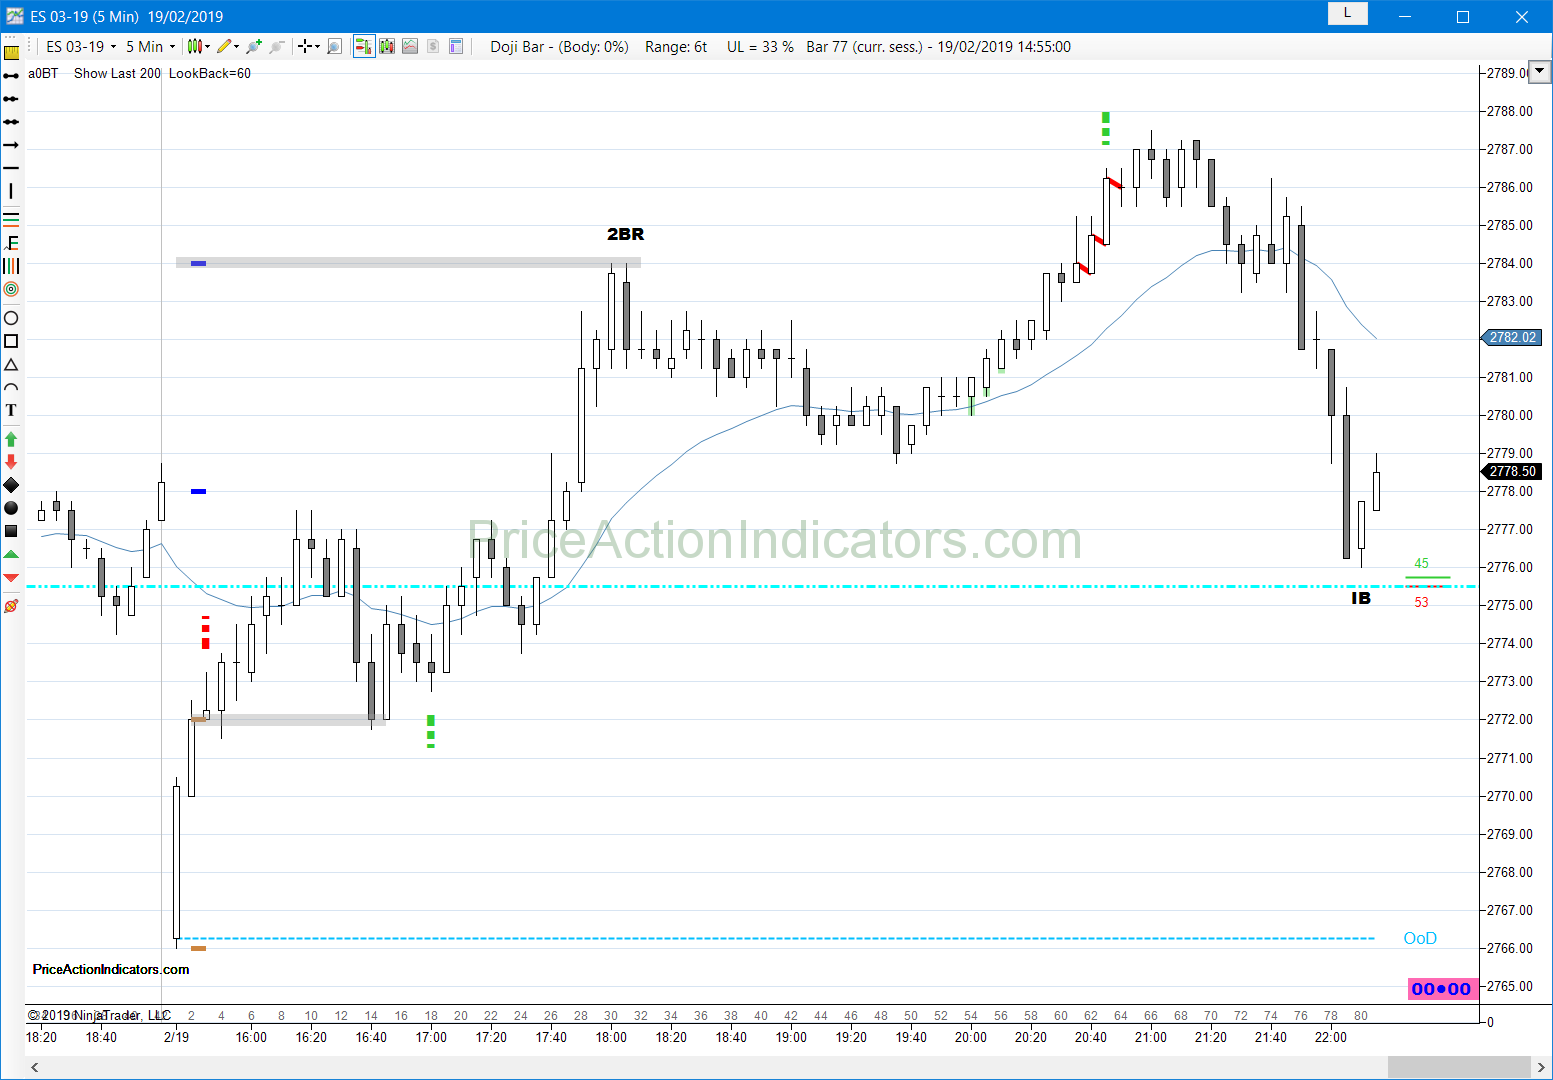
a small TR day
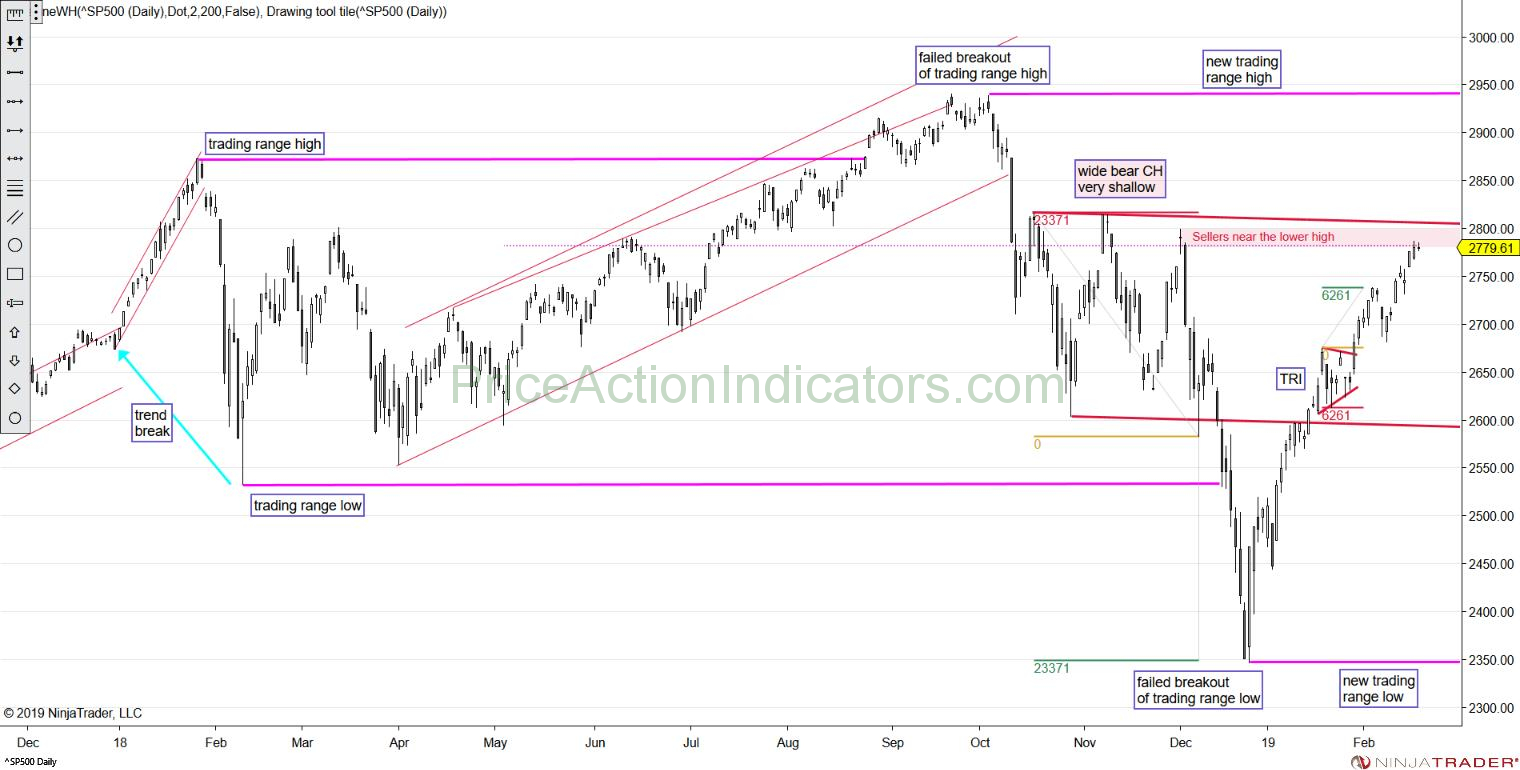
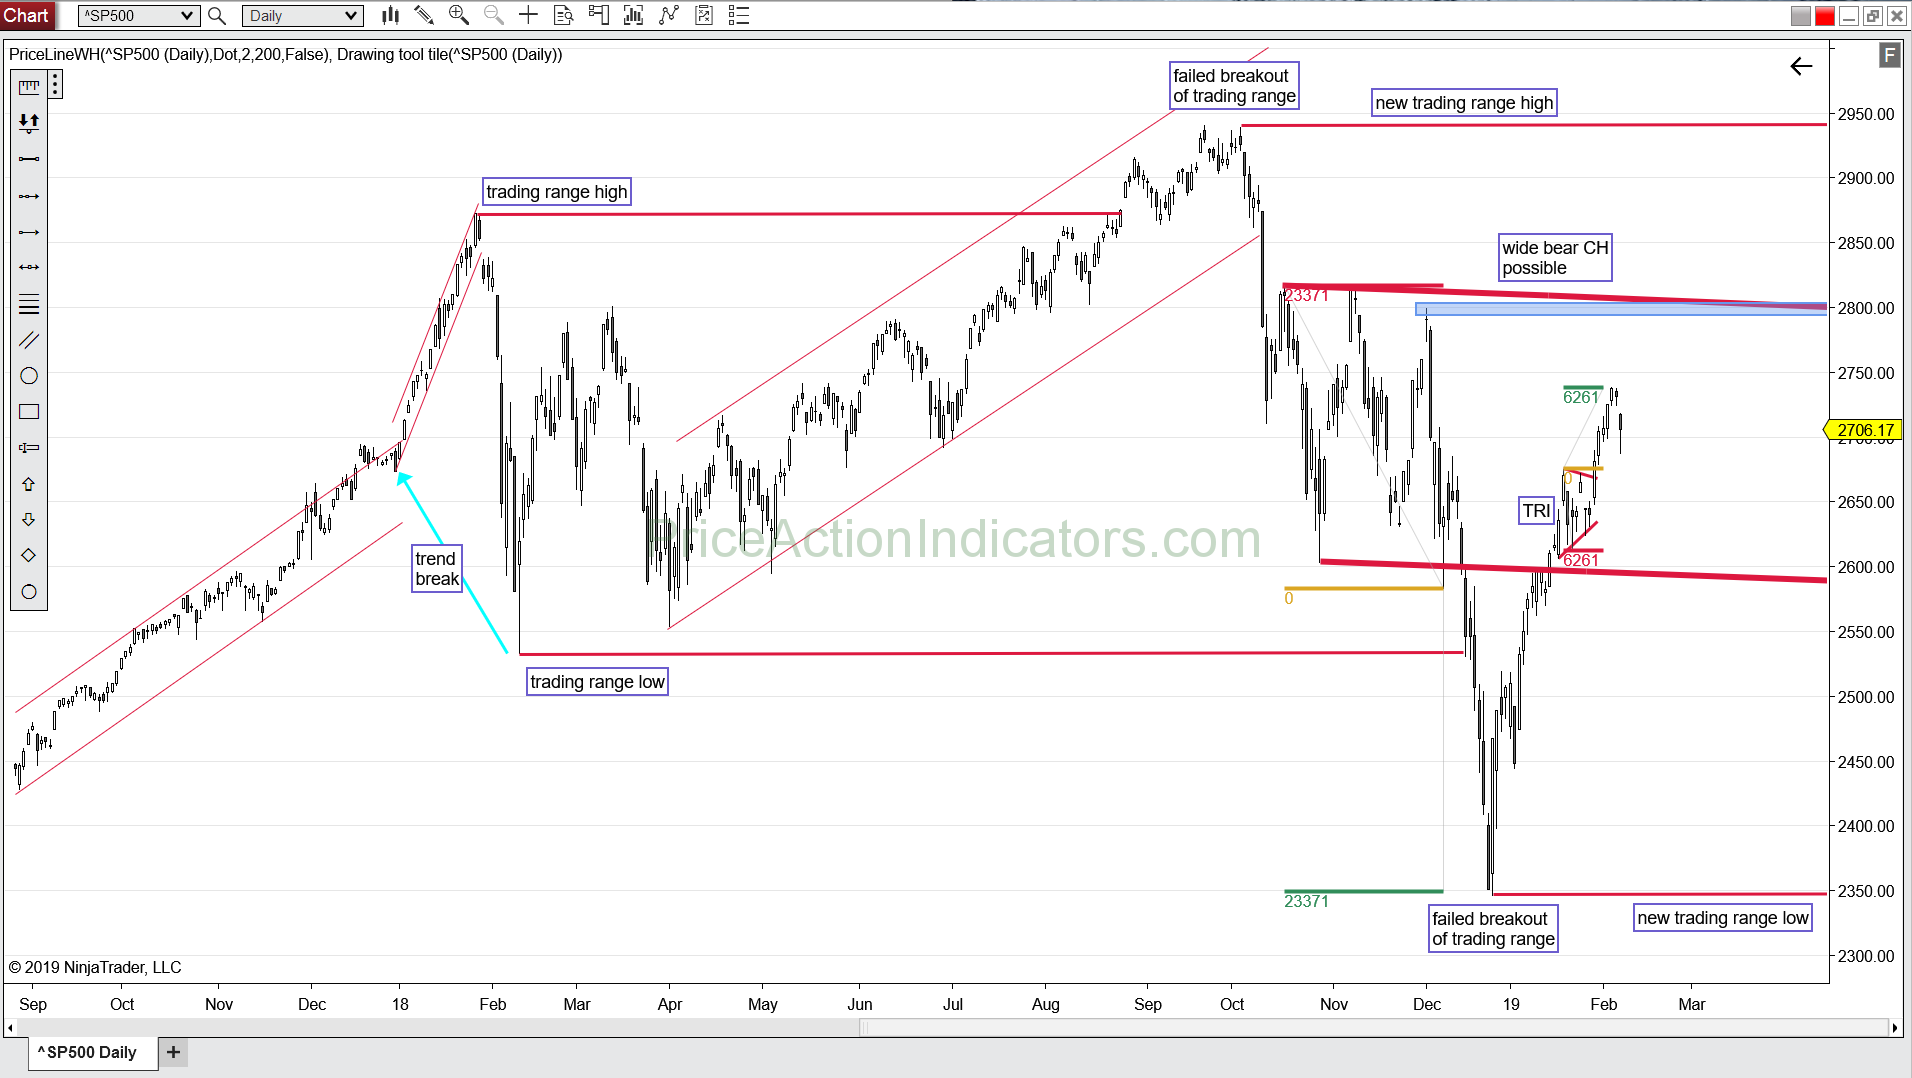
daily chart
Always In Long (AIL) since 01/04
some bears up here, 18 points below the last LH of the wide bear CH I mentioned yesterday
Bulls buy below the last HL (Tuesday low)