E-mini ES 2018/08/31

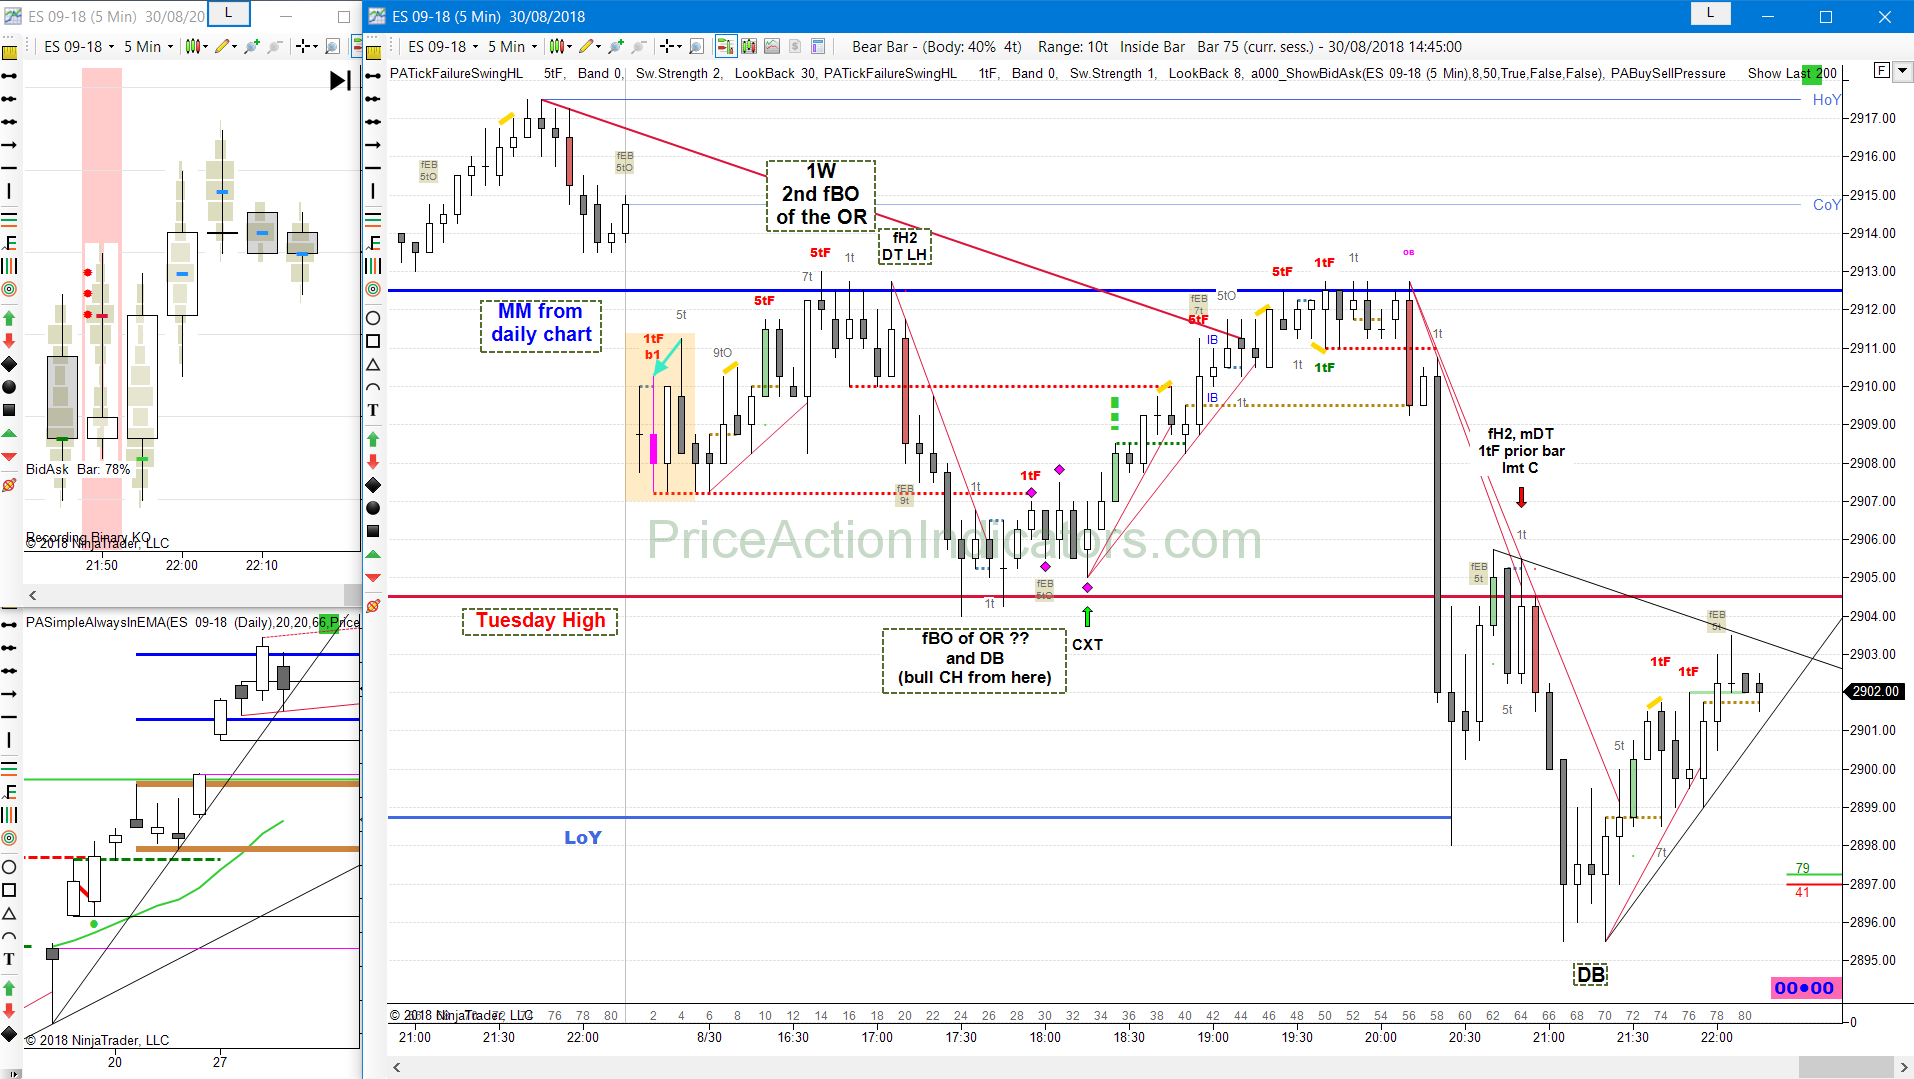
Bear gap, mid range, DP, bull CH, MC, fH2, CXT, WfBO LOY, HL MTR, BT, 1tF BT, DT
again, can see nicely, how we bounced off of S/R from the daily chart

daily chart
a poss. HL and BO PB

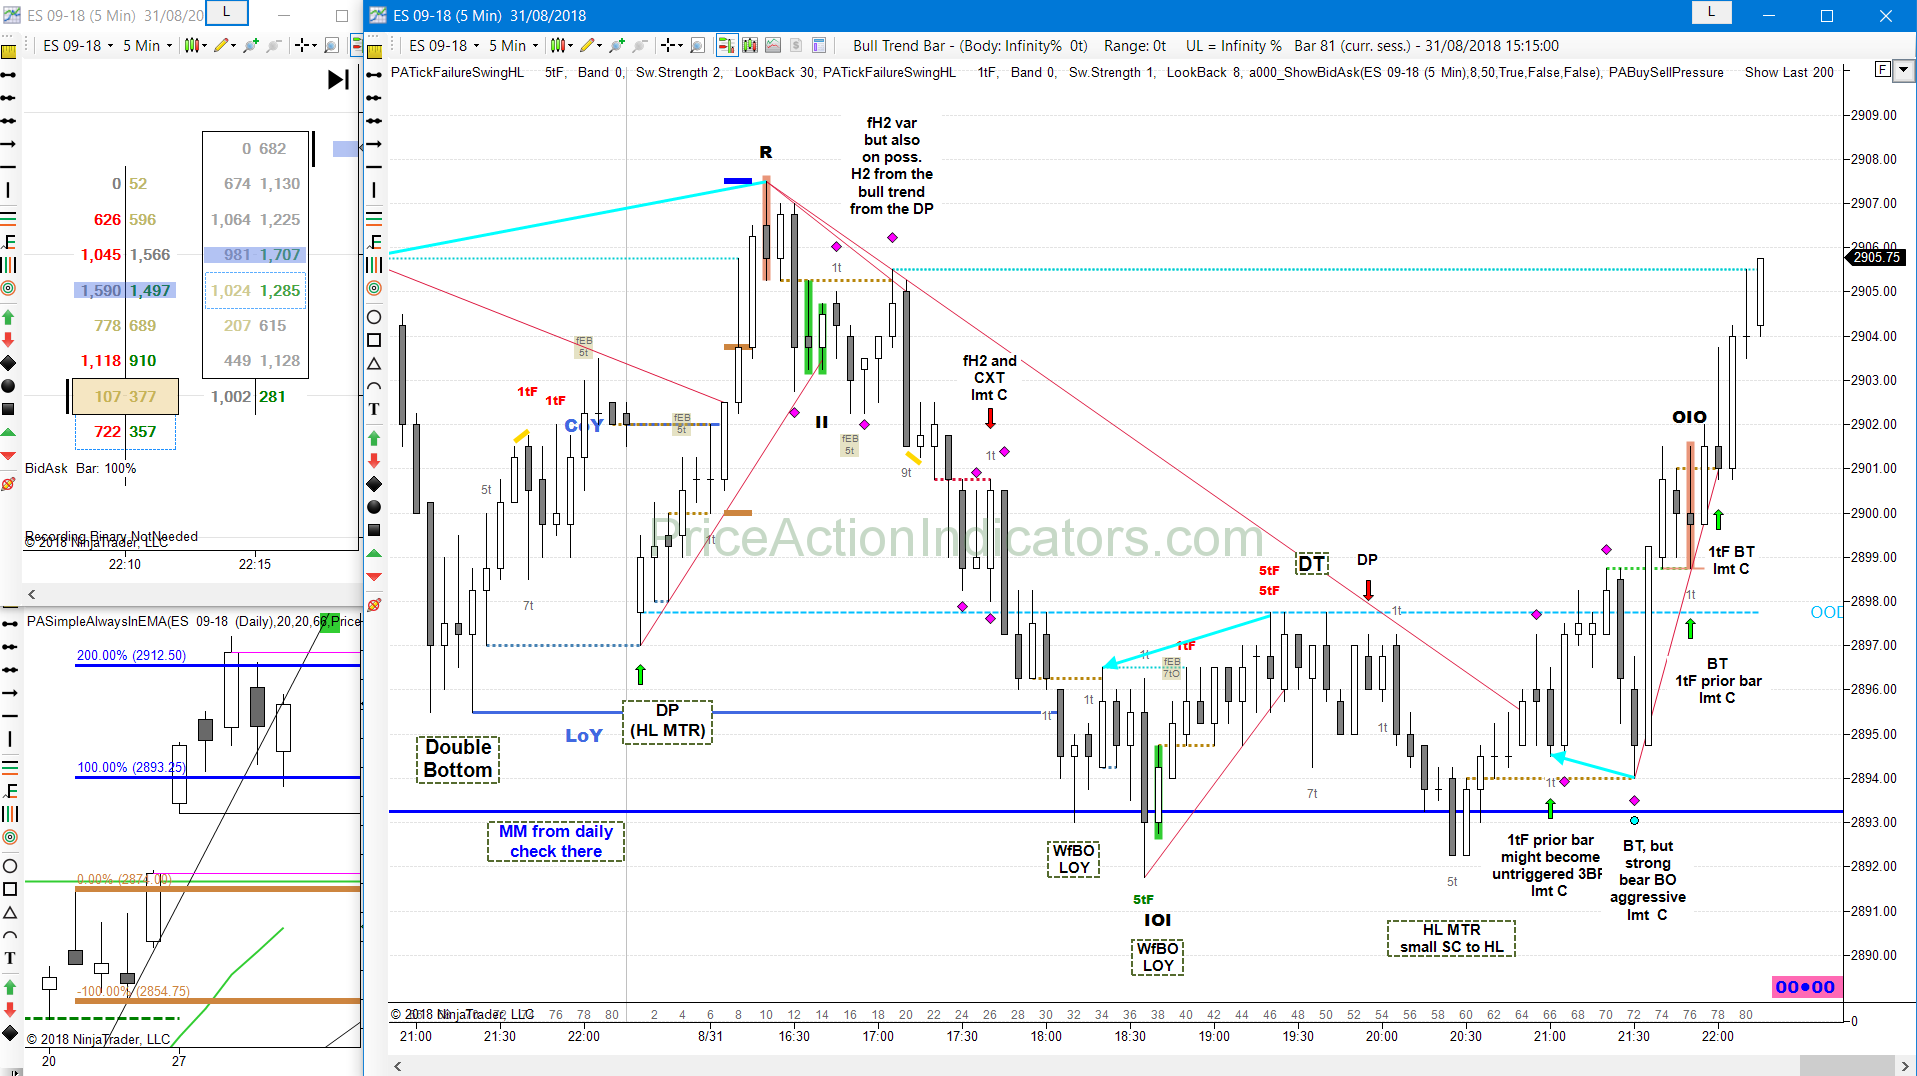
Why are the MMs from the daily chart S/R?
MMs of PBs are “bread and butter” MMs (easy to see and understand)
bulls who B the BO (2874) on 08/24 have PT of e.g. one (2893) and two times (2912) their risk
risk for them is the L of the PB before BO (2855)
bears know/expect that, short at the poss. MM target and scale in higher (e.g. at the 1st and 2nd target, one and two x MM)
bears then get out/PT at their 1st entry (2893, 1xMM) Continue reading “E-mini ES 2018/08/31”

E-mini ES 2018/08/30

Bear gap, mid range, OR, 2nd fBO, 1W, fH2, DT, fBO, DB, bull CH, CXT, fH2

can see nicely, how we bounced off of S/R and then got a BP of it (the fH2 at b64)

daily chart
Yesterday’s bar closed right at (AND NOT ABOVE) the MM I mentioned (the MM of Tuesdays range)
bears probably PT because of that (I would) 🙂

E-mini ES 2018/08/29

Continuation, SHS, failed DT, failed RVB, MM, DT, inv. SHS, deep PB, mDB, DP, doji TT
bulls tried for SC, but failed
poss. TT by loss of momentum (8 consecutive dojis)

daily chart
Yesterday’s bear body acted as a PB
Brs above using the L of it as a HL and their stop placement
1xMM is then the height of Y range 🙂

E-mini ES 2018/08/28

Bull gap, above HOY, BB, bear CH, CXT, 1CHBO
2BR, IOI, 3BR, OIO, 2BR
BB yesterday’s PM trading range (LOD)

daily chart
Yesterday closed above the 1xMM of the last PB (the blue line)
that became intra-day support already yesterday and was support today as well

using bear failures in a bull and vice versa
such failures are:
fBO tick failures of swings and SBs (fEB)
BT and 1tF BT of SBs and swings
BB and SA after 3 or 4 bars of same color
SE in a PB (failure to reverse the trend)