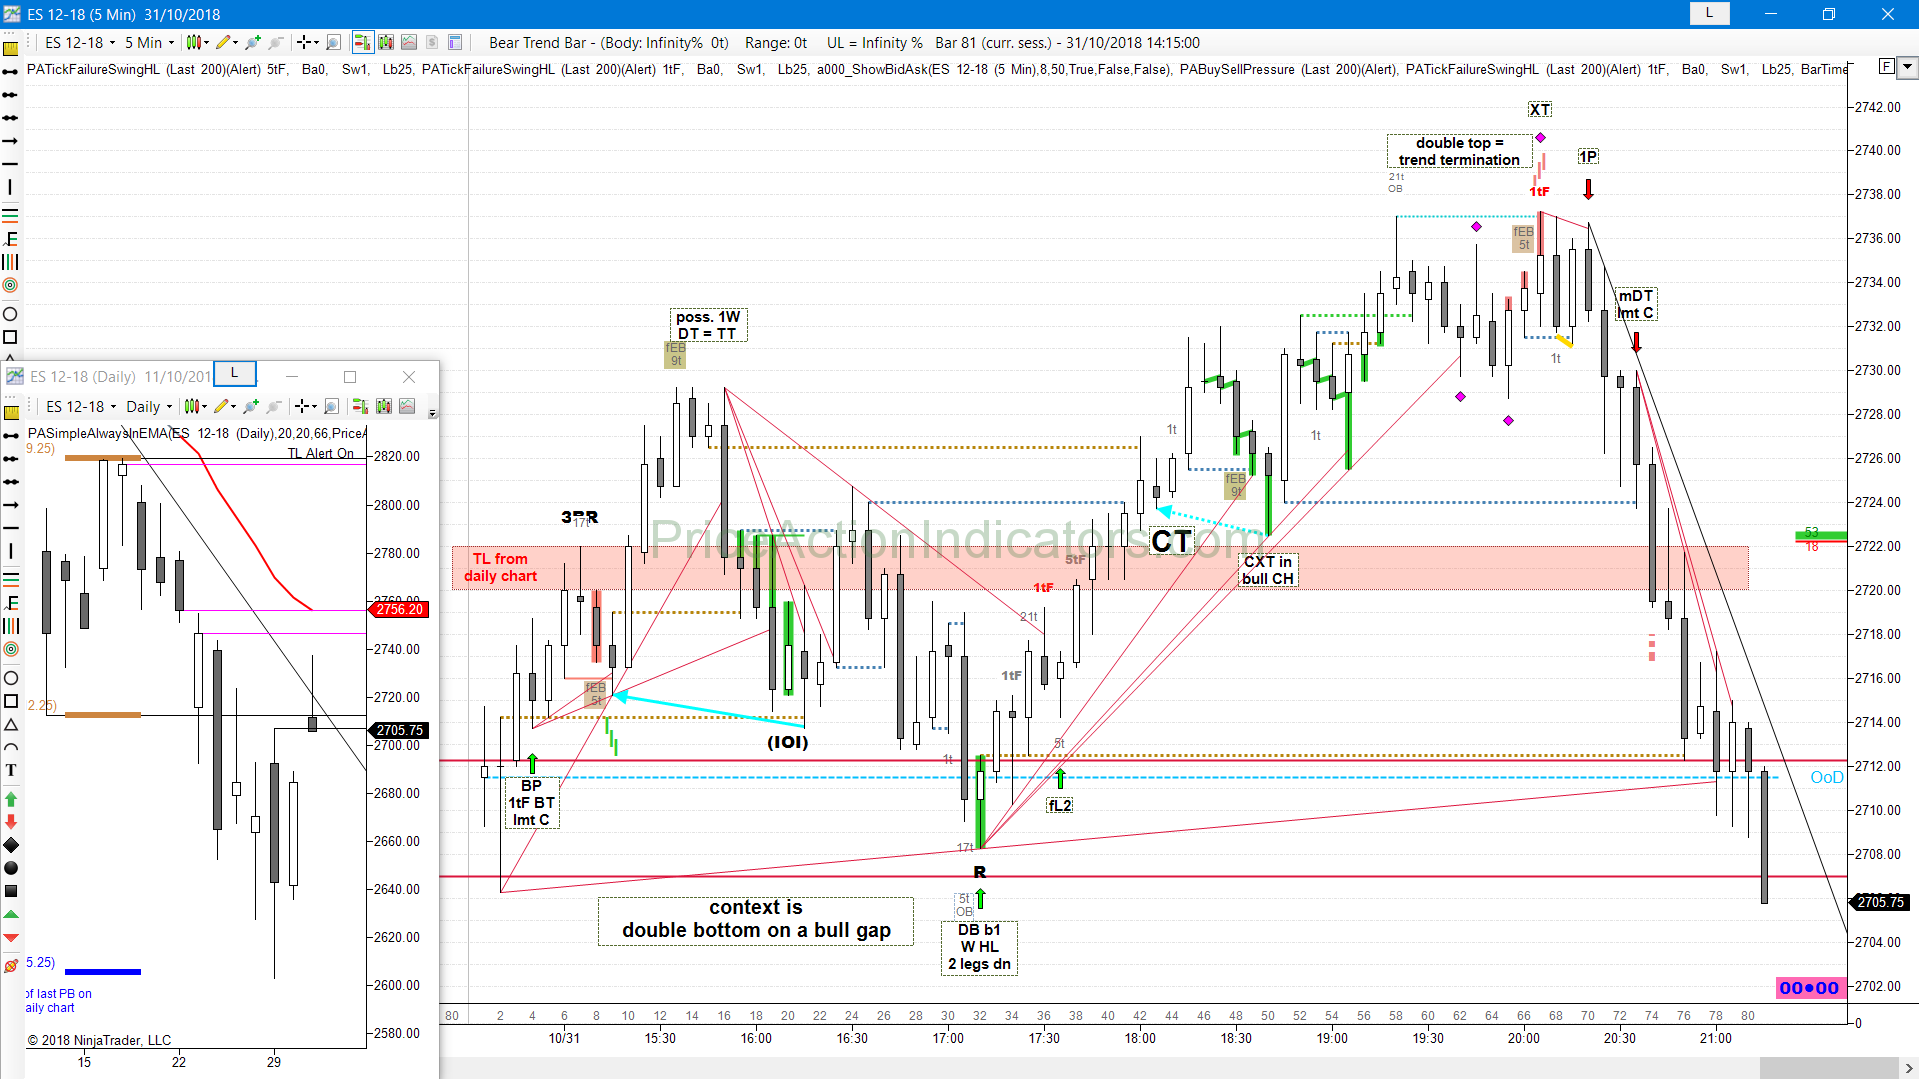
Bull gap, above HOY, OR (b1,b2), BP, 1tF BT, 1W, DB, fL2, bull CH, CXT, XT, HH MTR, mDT
the DT TT and XT is a HH MTR
daily chart
shaved C RVB at the bear TL, bulls don’t want this to trigger short

for NinjaTrader® – Forget Squiggly Lines!
Bull gap, above HOY, OR (b1,b2), BP, 1tF BT, 1W, DB, fL2, bull CH, CXT, XT, HH MTR, mDT
the DT TT and XT is a HH MTR
daily chart
shaved C RVB at the bear TL, bulls don’t want this to trigger short
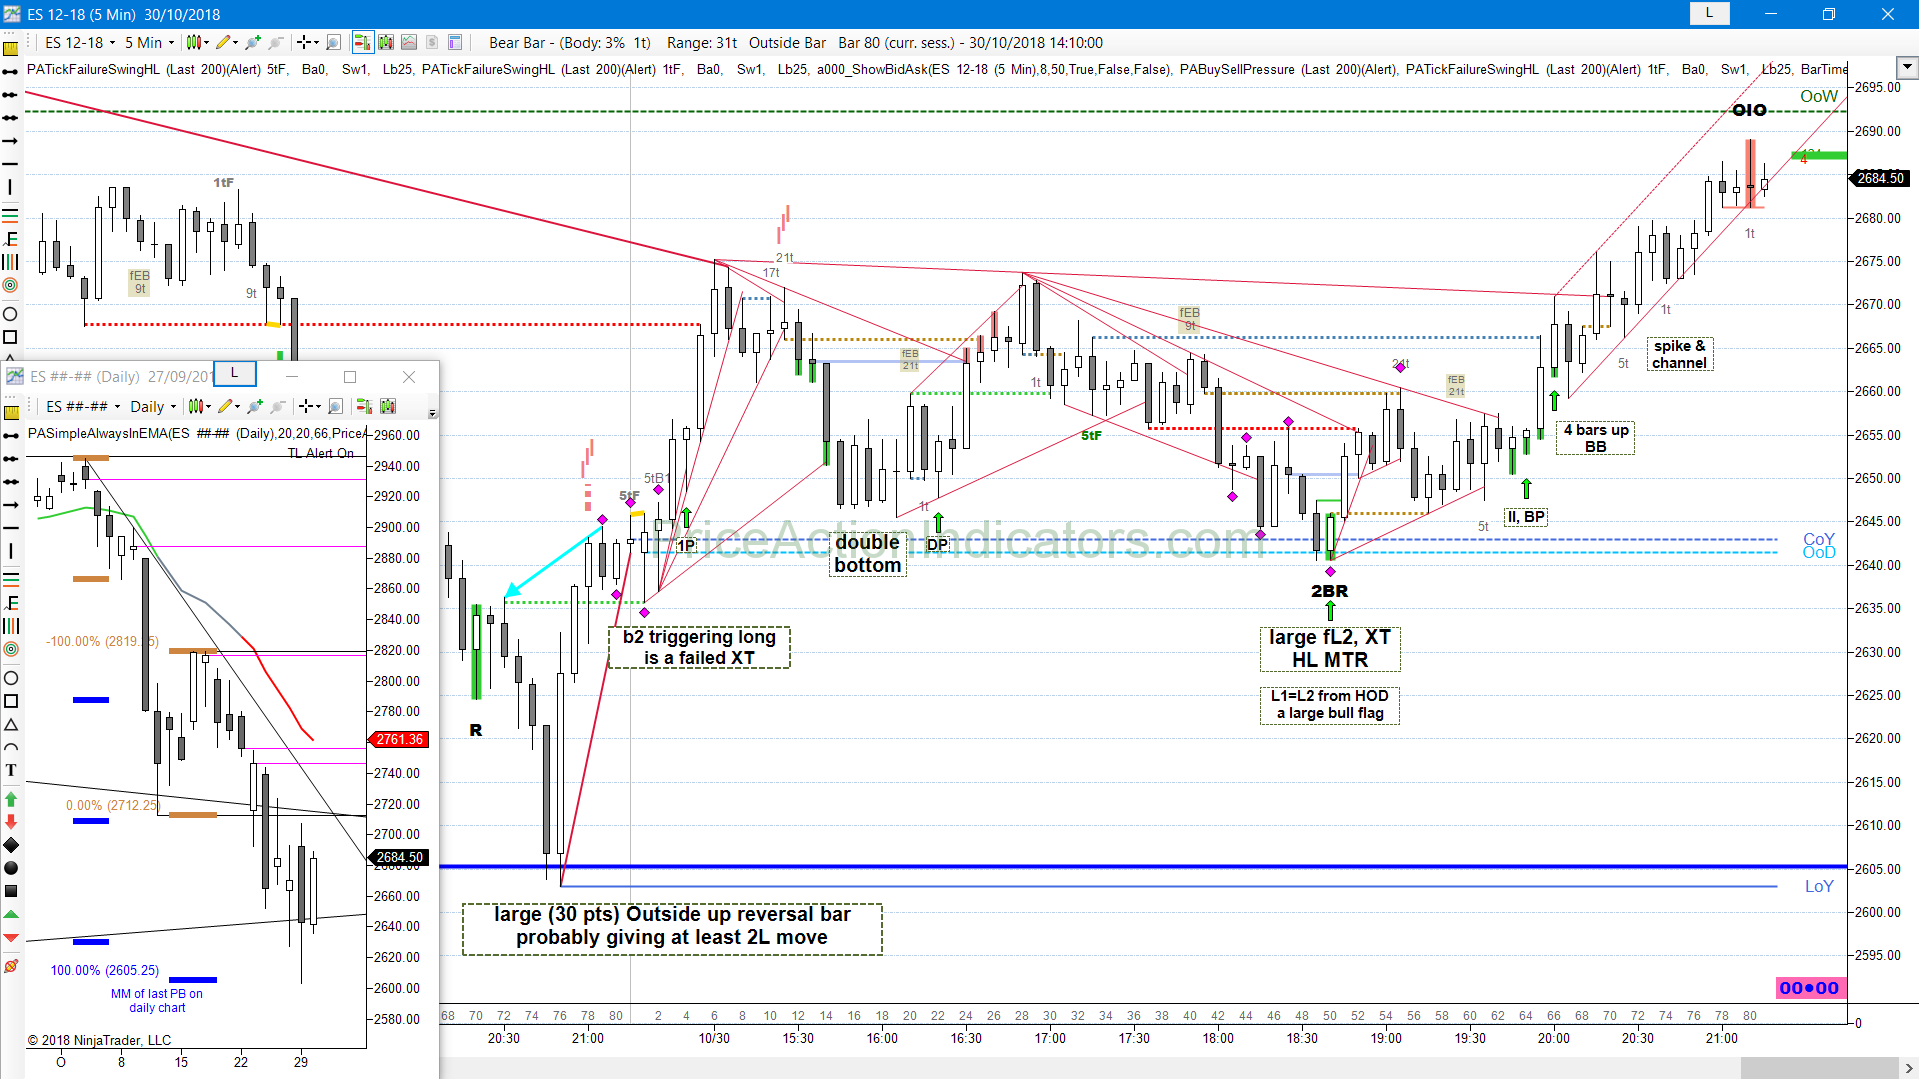
Continuation, failed XT, DB, DP, large fL2, XT, HL MTR, BP, BB, SC
(the BP is no II)
daily chart
IOI for the bulls, a 2E at the TRI TL
some bears probably will exit, if that triggers (some above the HOY, some above the high of the entire pattern)
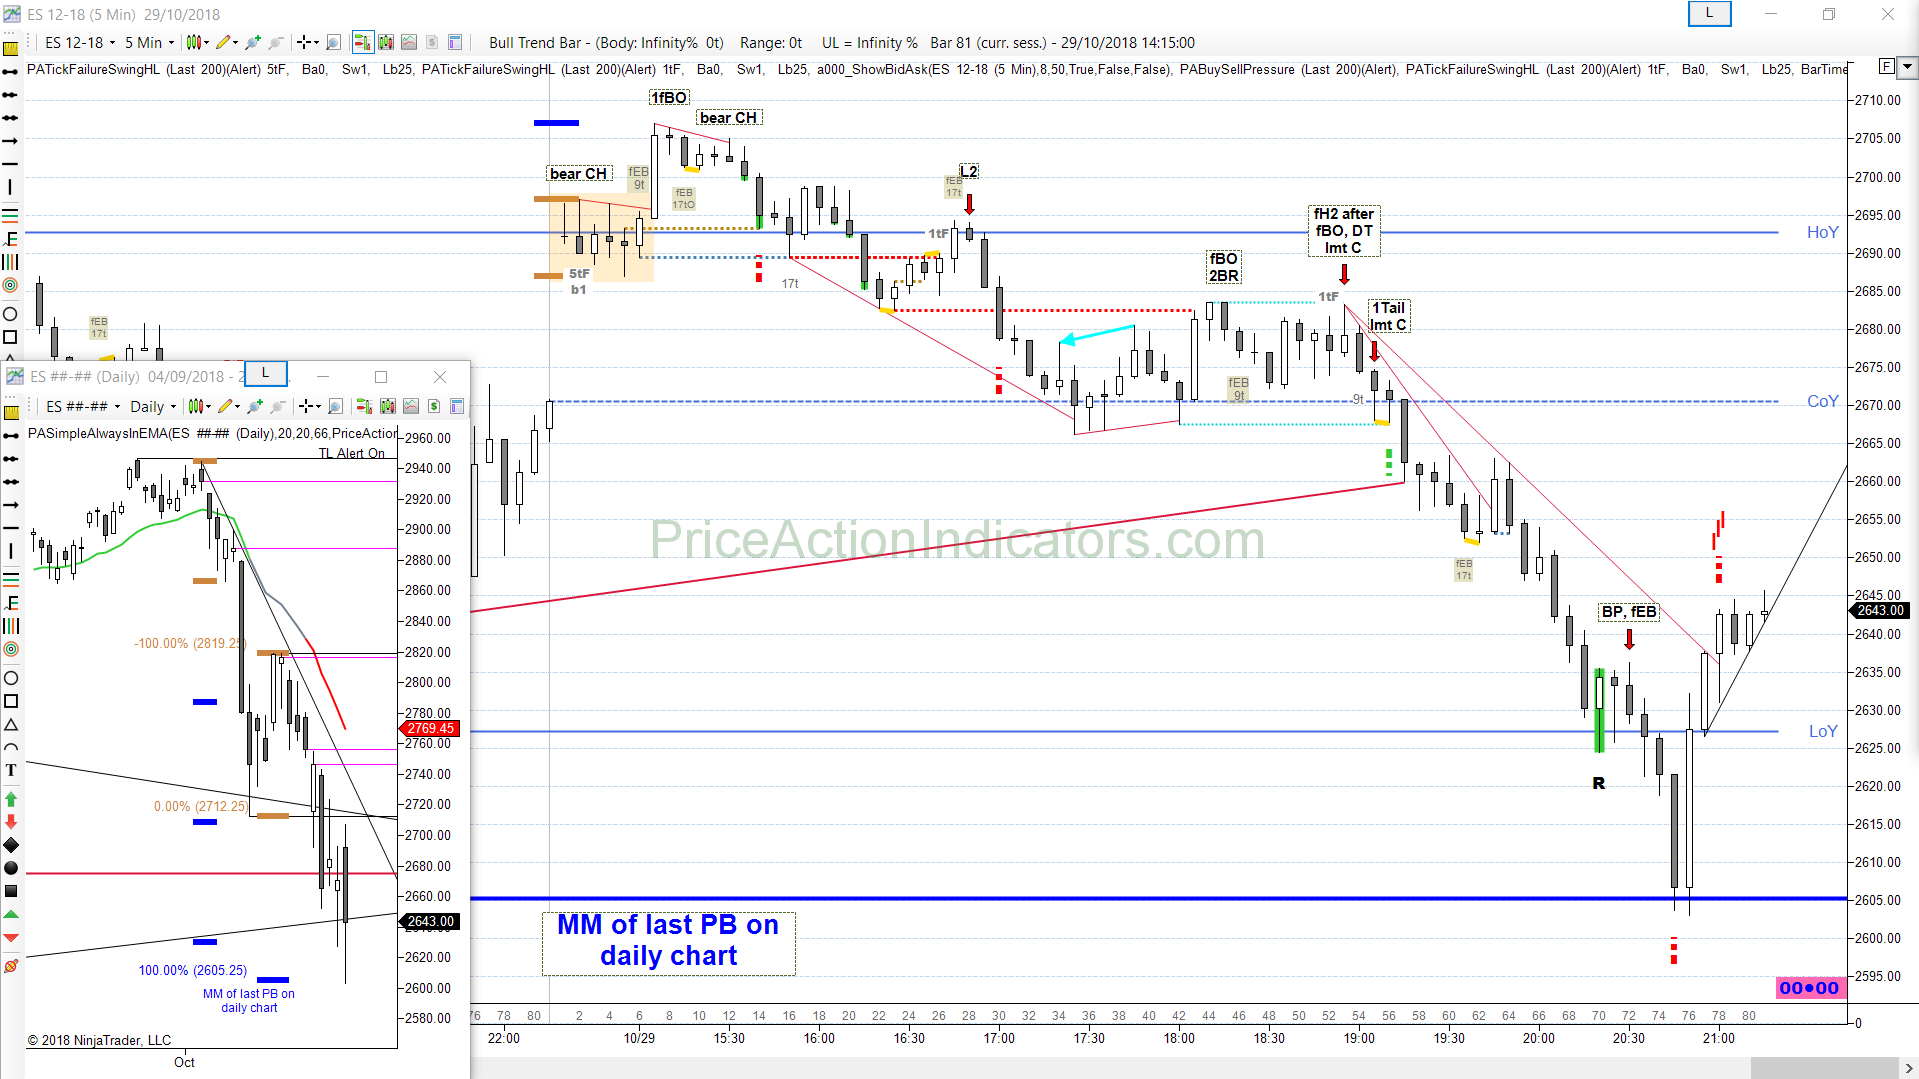
Bull gap, mid range, bear CH, 1fBO, L2, fBO, fH2, DT, 1Tail, BP
daily chart
bears PT at 1xMM of the last PB (a classics risk/reward based trade)
you short the BO (stop entry) of the extreme of the trend and place your stop loss above the last LH, then PT at 1xMM of your risk
in a bear trend this trade has a probability of > 50% so you have a positive traders equation
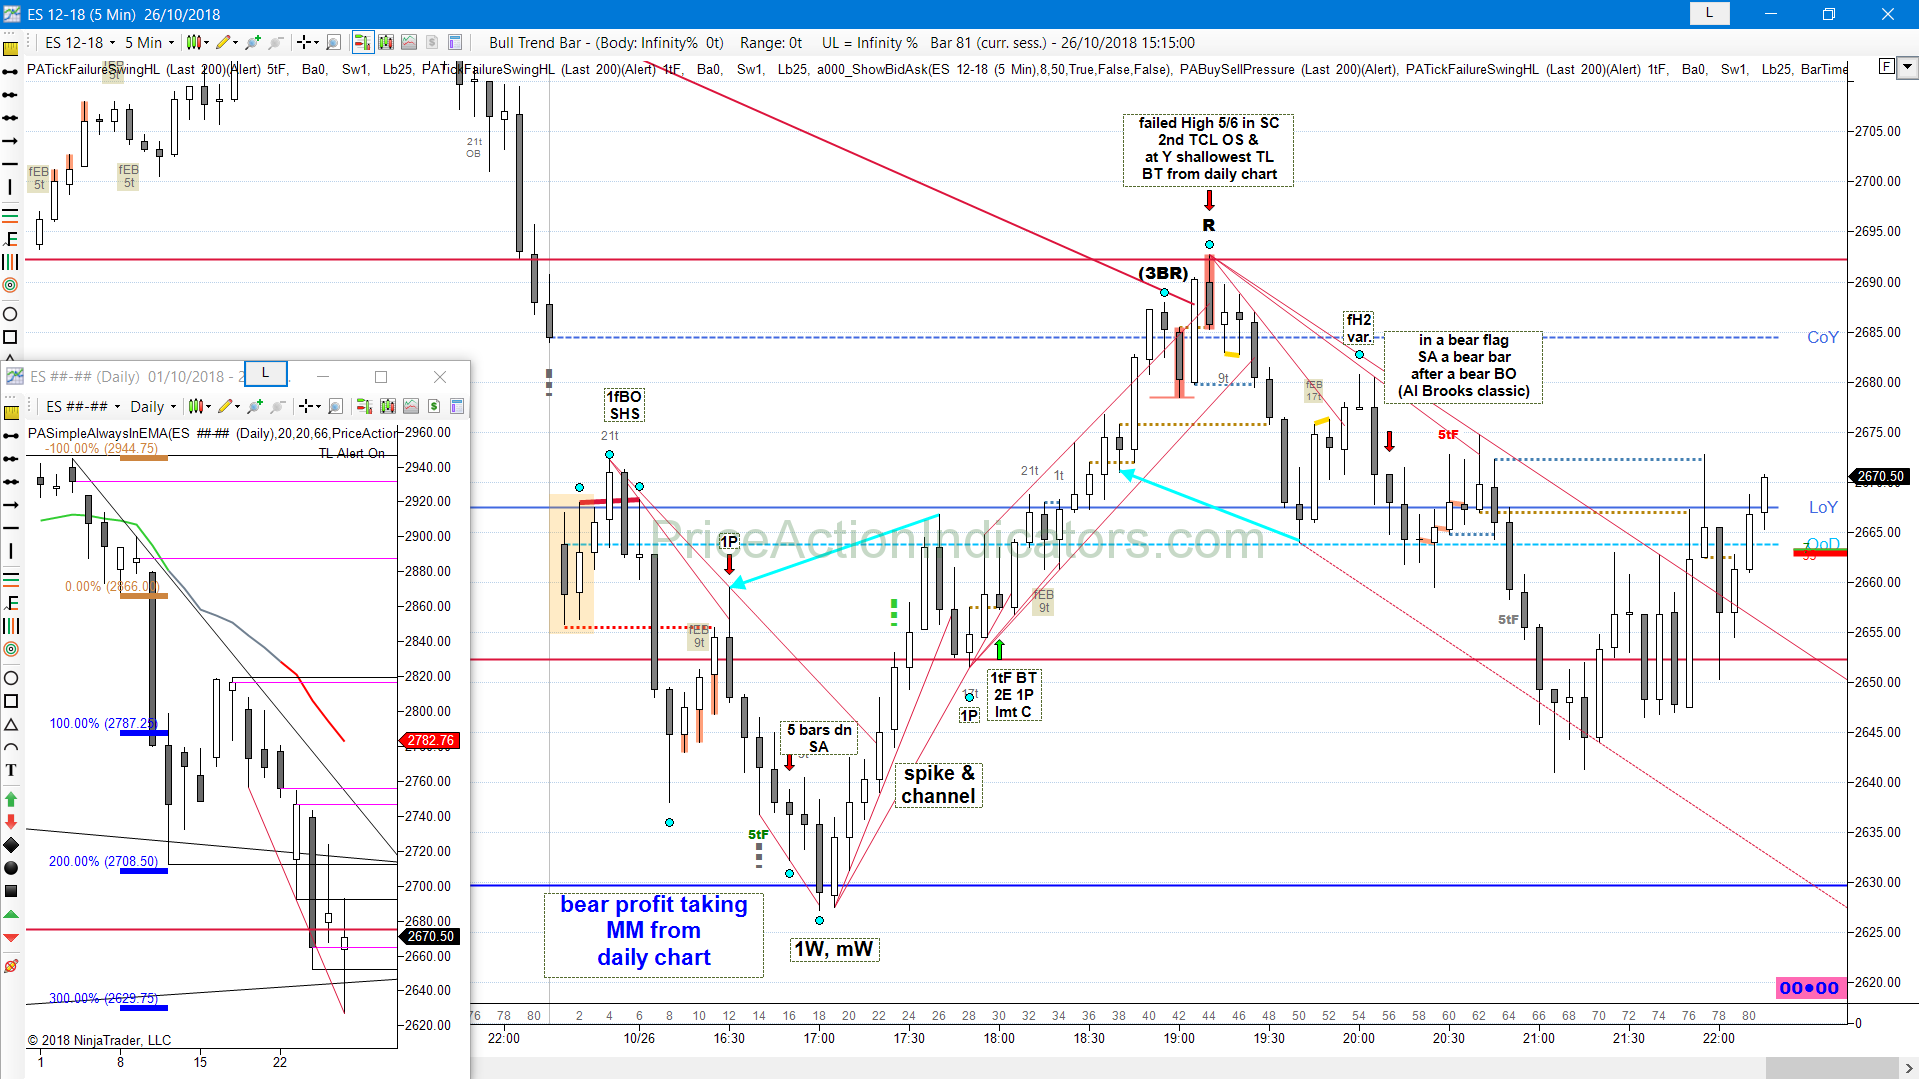
Bear gap, below LOY, OR, 1fBO, SHS, 1P, SA, 1W, mW, SC, 1P, 1tF BT, fH5, fH6, TCL OS, fH2
daily chart
another attempt by the bulls to form a RVB, but it has a weak close and body
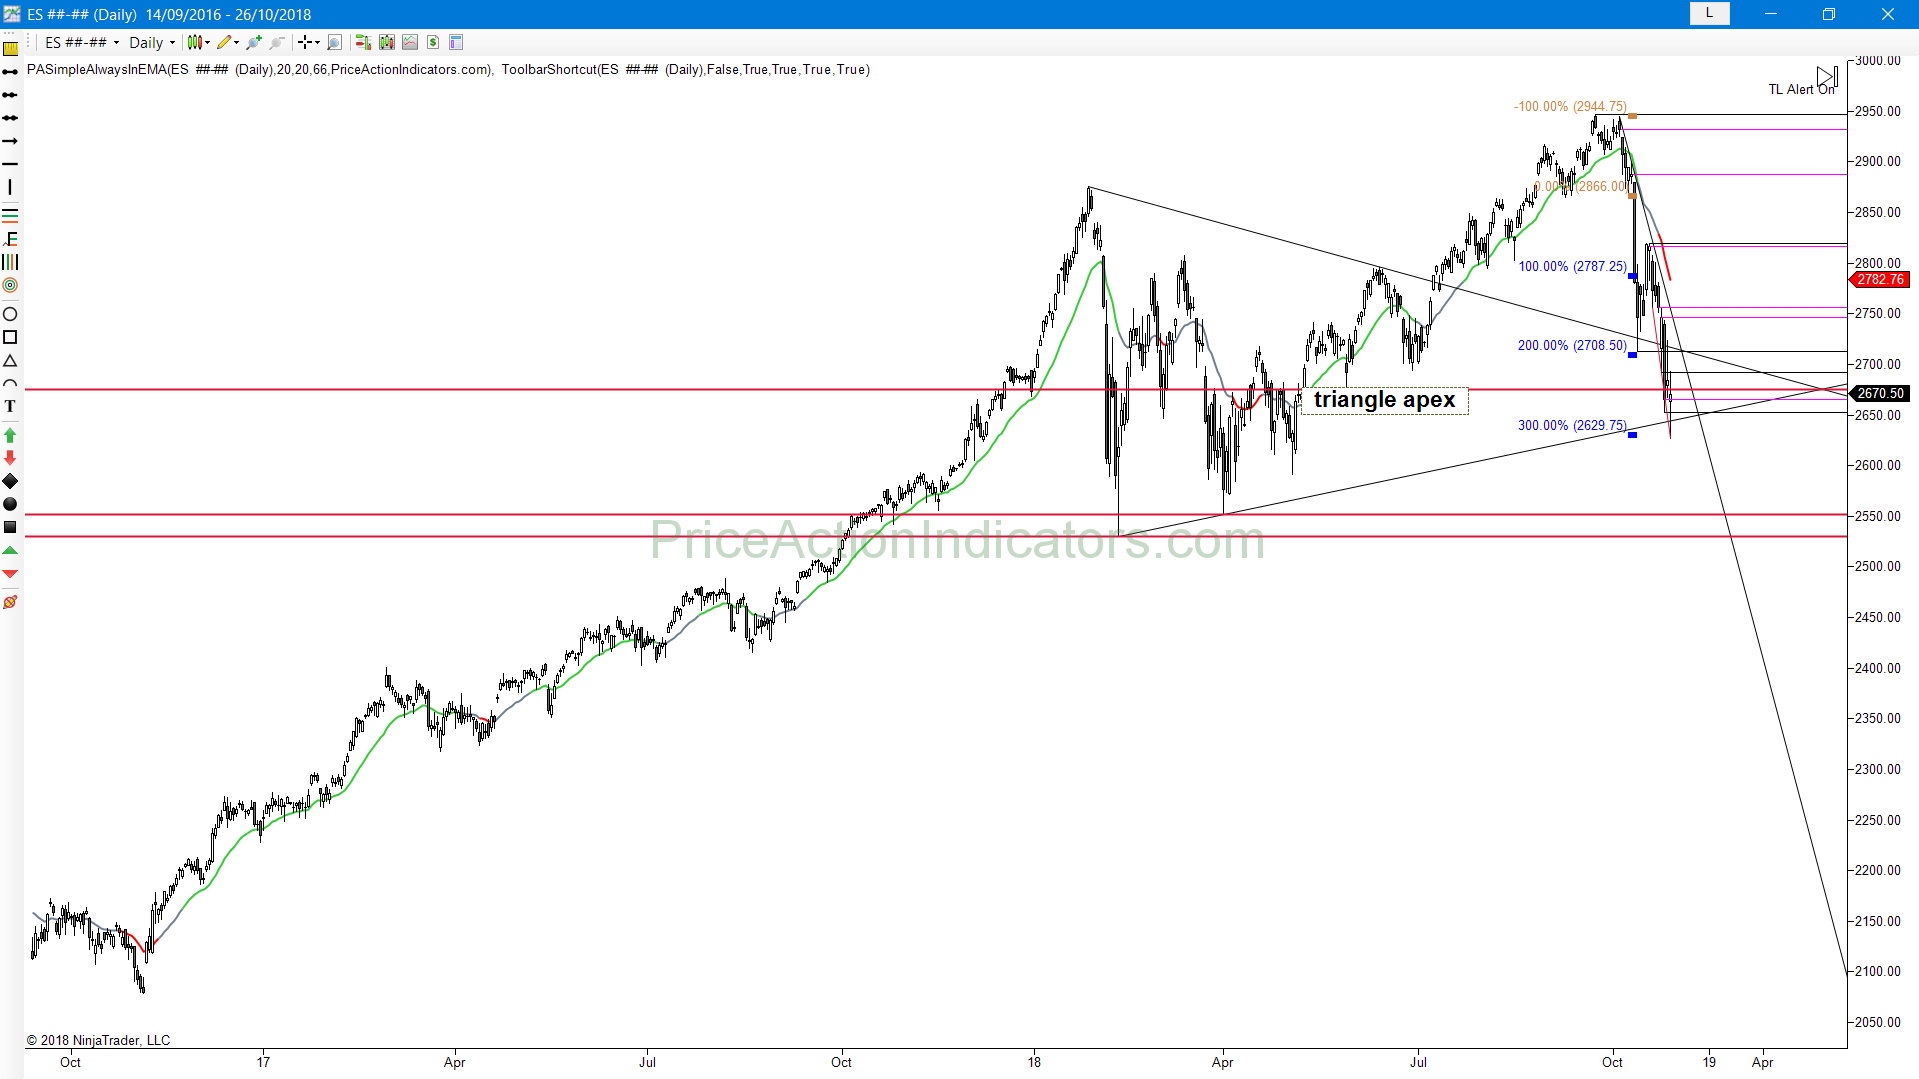
test of the TRI TL
bears PT at 3xMM of their initial risk from the BO trade three weeks ago
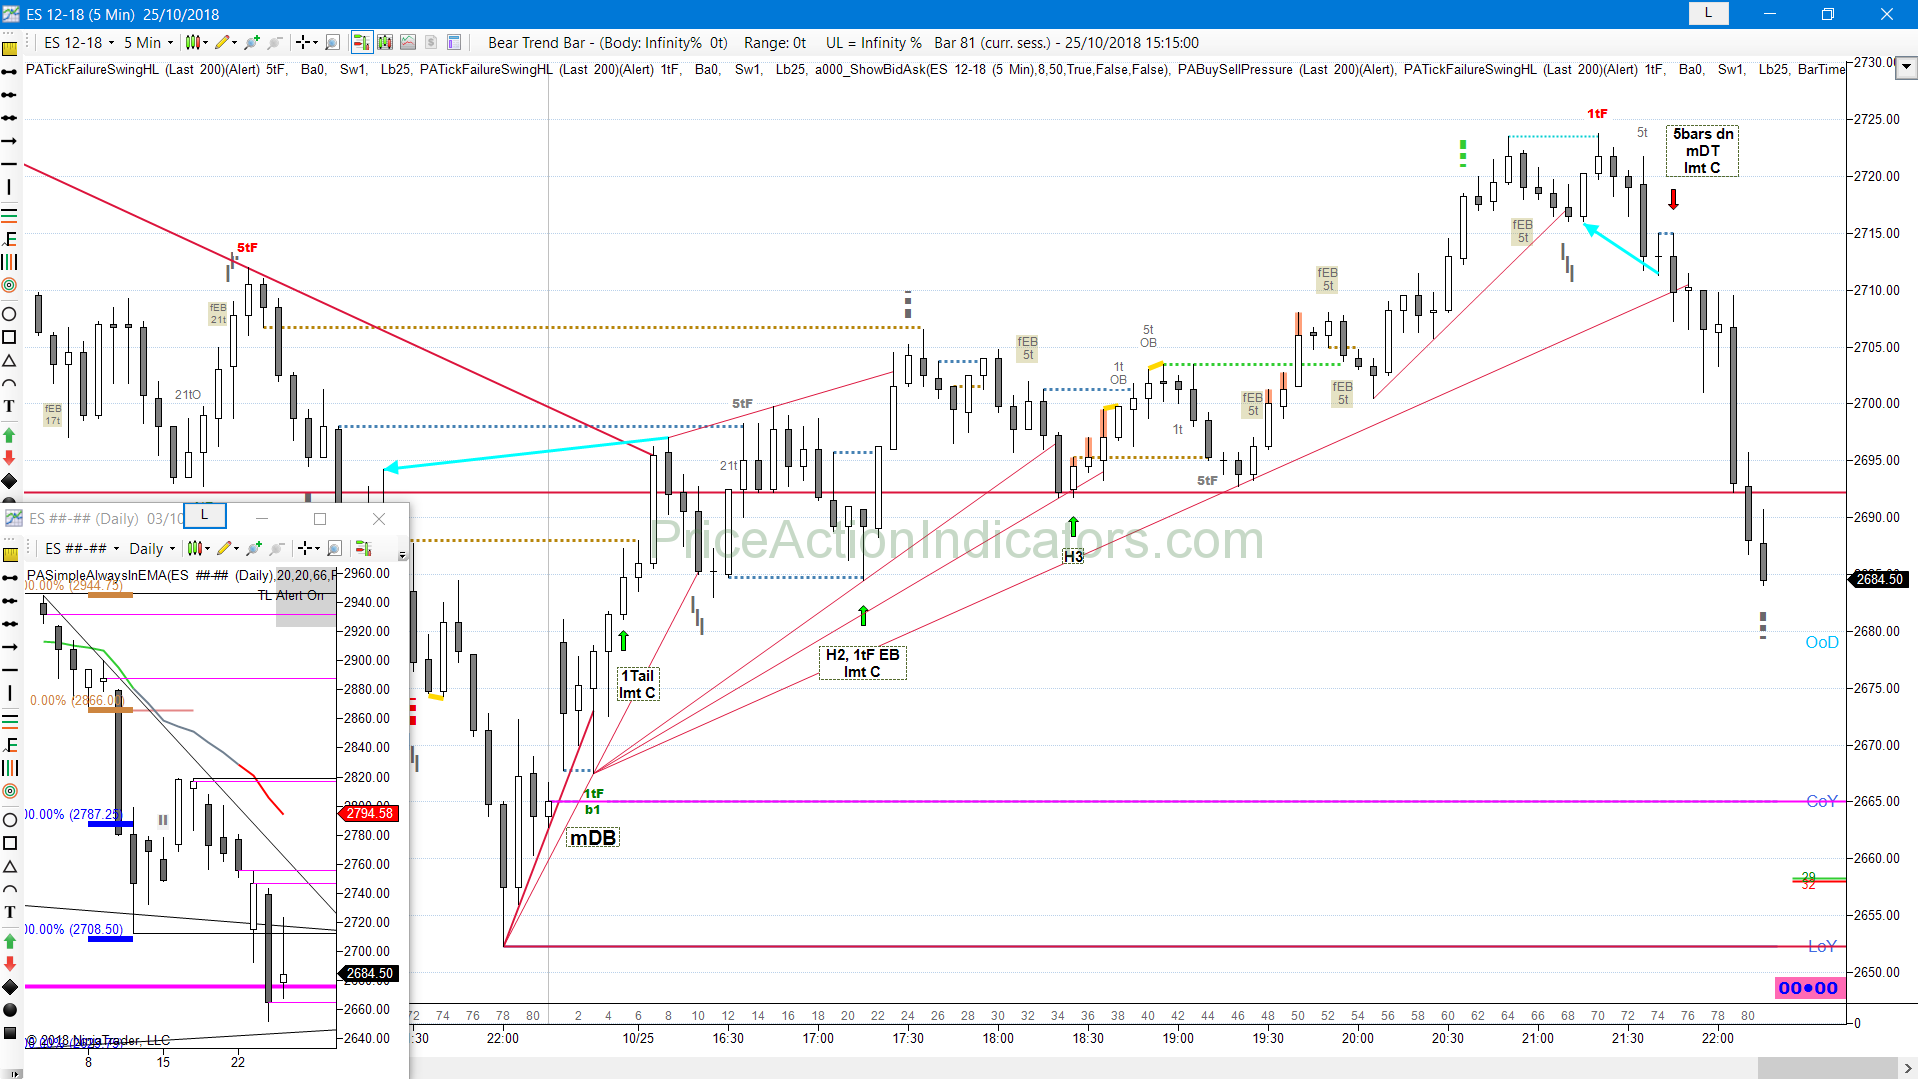
Continuation, mDB, 1Tail, H2, 1tF EB, H3, bull CH, mDT
daily chart
some bulls see an overlapped BO bar and kinda fL3, a lmt C buy
some PT at the O of the bull RVB from two days ago
bears short higher at the BO point