Skip to content

Price Action Indicators

for NinjaTrader® – Forget Squiggly Lines!

  • Home
  • Indicators
    • Reversal Signal Bars
      • Signal Bars & Patterns
      • Entry Strategies
      • How to Trade
      • Automated Trading
      • More Charts
    • Buy Sell Pressure
      • What do the signals mean?
      • Automated Trading
      • More Charts
    • S/R Day Trading S/R Pro
    • S/R Breakout Failure
      • Scale-In Trading Approach
      • Automated Trading
      • More Charts
    • S/R Breakout Test
      • Automated Trading
      • More Charts
    • S/R Double Bottom/Top
      • Automated Trading
    • S/R Opening Range
    • Signal Bar – Breakout Failure
      • Automated Trading
    • Bloodhound Templates
  • E-mini Blog
  • NinjaTrader®
  • Download
  • Free Resources
  • Service
    • Contact Us
    • Newsletter
    • FAQ
    • Privacy Policy
    • Datenschutzerklärung
    • Terms and Conditions
    • Disclaimer
    • Licence Agreement
    • Return Policy
    • Impressum
    • About

Category: Price Action Setups

Posted on 14. October 202010. November 2020

Use Volume for better Signals

For some time now, I’m experimenting with volume to improve the entry signals of the Price Action Indicators.

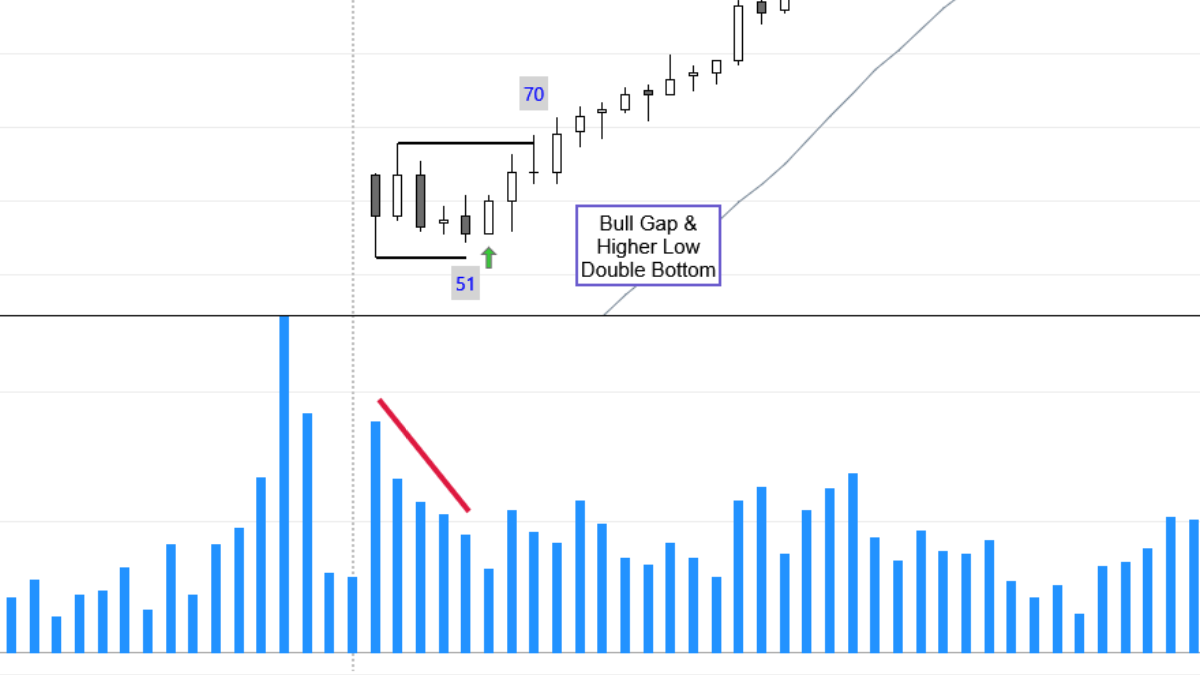
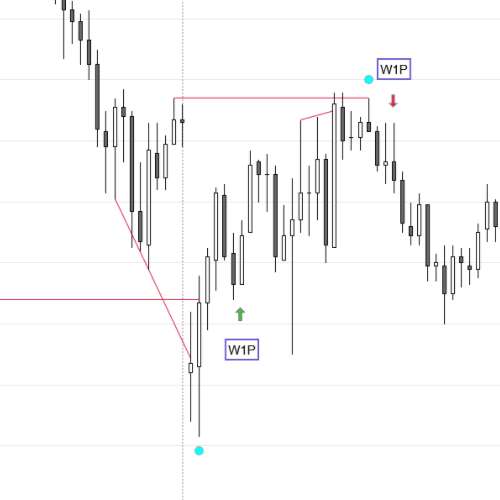
Decreasing or less volume, when approaching an old support or resistance shows a lack of interest from professional money to participate at these areas and prices are more likely to reverse.

Continue reading “Use Volume for better Signals”

Posted on 29. July 202024. April 2021

Trade the 1st Pullback after a Wedge – the W1P!

A Wedge reversal (three or four pushes each with a new extreme) forming at the top or bottom of a trend is probably the most successful setup for a swing trade.

The most crucial prerequisite for a Wedge reversal is a clear trend channel line overshoot and in particular a second overshoot.

Other strengtheners / requirements are: Continue reading “Trade the 1st Pullback after a Wedge – the W1P!”

Posted on 21. January 202021. January 2020

What to do with “Barb Wire”?

“Barb Wire” is a special kind of a tight trading range, where the price action is confined to a narrow range made up of small bars, many of which are dojis (large tails and small bodies). Continue reading “What to do with “Barb Wire”?”

Posted on 24. September 201925. October 2019

How to Trade Reversal Signals

Entry Order

Once a Reversal Signal shows up on the chart place a stop entry buy order one tick above the bar or pattern (for bull). The closest logical stop goes below the bar or pattern – a bar/pattern stop.

Continue reading


Posted on 28. August 201922. September 2019

Inside Bars

Inside bars (by definition) are completely overlapped by the prior bar and must be considered to be a small trading range. This usually makes them poor Signal Bars, unless they occur with trend or meet a couple more criteria. Continue reading “Inside Bars”

Posts navigation

Page 1 Page 2 Next page

Categories

  • Announcement (28)
  • E-mini Day Trading Charts (1,152)
  • Price Action Basics (24)
  • Price Action Setups (10)
March 2023
M T W T F S S
 12345
6789101112
13141516171819
20212223242526
2728293031  
« Feb    

About the Charts

Price Action Basics

Links

Tags

  • 1CHBO (249)
  • 1fBO (117)
  • 1IB (56)
  • 1P (268)
  • 1Tail (53)
  • 1tF BT (90)
  • 1W (80)
  • above HOY (199)
  • bear CH (197)
  • Bear gap (255)
  • below LOY (121)
  • BP (153)
  • BT (418)
  • bull CH (187)
  • bull gap (348)
  • bull SC (57)
  • Continuation (503)
  • CXT (190)
  • DB (452)
  • DP (172)
  • DT (394)
  • fBO (406)
  • fEB (54)
  • FF (60)
  • fH2 (201)
  • fL2 (231)
  • FOMC report (48)
  • H2 (286)
  • HL MTR (144)
  • L2 (253)
  • LH MTR (65)
  • mDB (304)
  • mDT (311)
  • mid range (268)
  • mW (433)
  • Opening Range (196)
  • SC (128)
  • shallowest trend lines from yesterday (48)
  • SX (66)
  • T1B (119)
  • TRI (104)
  • W (587)
  • W1P (300)
  • WfBO (315)
  • XT (224)

Many thanks and congrats for the great work
you're doing with the blog. Cheers
Francesco

Archives

  • March 2023
  • February 2023
  • January 2023
  • December 2022
  • November 2022
  • October 2022
  • September 2022
  • August 2022
  • July 2022
  • June 2022
  • May 2022
  • April 2022
  • March 2022
  • February 2022
  • January 2022
  • December 2021
  • November 2021
  • October 2021
  • September 2021
  • August 2021
  • July 2021
  • June 2021
  • May 2021
  • April 2021
  • March 2021
  • February 2021
  • January 2021
  • December 2020
  • November 2020
  • October 2020
  • September 2020
  • August 2020
  • July 2020
  • June 2020
  • May 2020
  • April 2020
  • March 2020
  • February 2020
  • January 2020
  • December 2019
  • November 2019
  • October 2019
  • September 2019
  • August 2019
  • July 2019
  • June 2019
  • May 2019
  • April 2019
  • March 2019
  • February 2019
  • January 2019
  • December 2018
  • November 2018
  • October 2018
  • September 2018
  • August 2018
  • July 2018
  • June 2018
  • May 2018
Hypothetical Performance Disclosure:
Hypothetical performance results have many inherent limitations, some of which are described below. no representation is being made that any account will or is likely to achieve profits or losses similar to those shown; in fact, there are frequently sharp differences between hypothetical performance results and the actual results subsequently achieved by any particular trading program. One of the limitations of hypothetical performance results is that they are generally prepared with the benefit of hindsight. In addition, hypothetical trading does not involve financial risk, and no hypothetical trading record can completely account for the impact of financial risk of actual trading. for example, the ability to withstand losses or to adhere to a particular trading program in spite of trading losses are material points which can also adversely affect actual trading results. There are numerous other factors related to the markets in general or to the implementation of any specific trading program which cannot be fully accounted for in the preparation of hypothetical performance results and all which can adversely affect trading results.

Risk Disclosure:
Futures and Forex trading contains substantial risk and is not for every investor. An investor could potentially lose all or more than the initial investment. Risk capital is money that can be lost without jeopardizing ones’ financial security or life style. Only risk capital should be used for trading and only those with sufficient risk capital should consider trading. Past performance is not necessarily indicative of future results.

Testimonials appearing on this website may not be representative of other clients or customers and are not a guarantee of future performance or success.
Impressum / Datenschutz / Privacy Policy / Contact Us

COPYRIGHT © 2023 Deutschmann Trading UG (haftungsbeschränkt)

Want to hear more from us? - Check out our Newsletter

* indicates required

Please select all the ways you would like to hear from Deutschmann Trading UG:

You can unsubscribe at any time by clicking the link in the footer of our emails. For information about our privacy practices, please read our privacy policy.

We use Mailchimp as our marketing platform. By clicking below to subscribe, you acknowledge that your information will be transferred to Mailchimp for processing.
Learn more about Mailchimp's privacy practices here.


Subscribe to What's New    Follow us on Twitter