Bull gap, mid range, shallowest trend lines from yesterday, BT, 1P, bull CH, CXT, XT
FOMC report
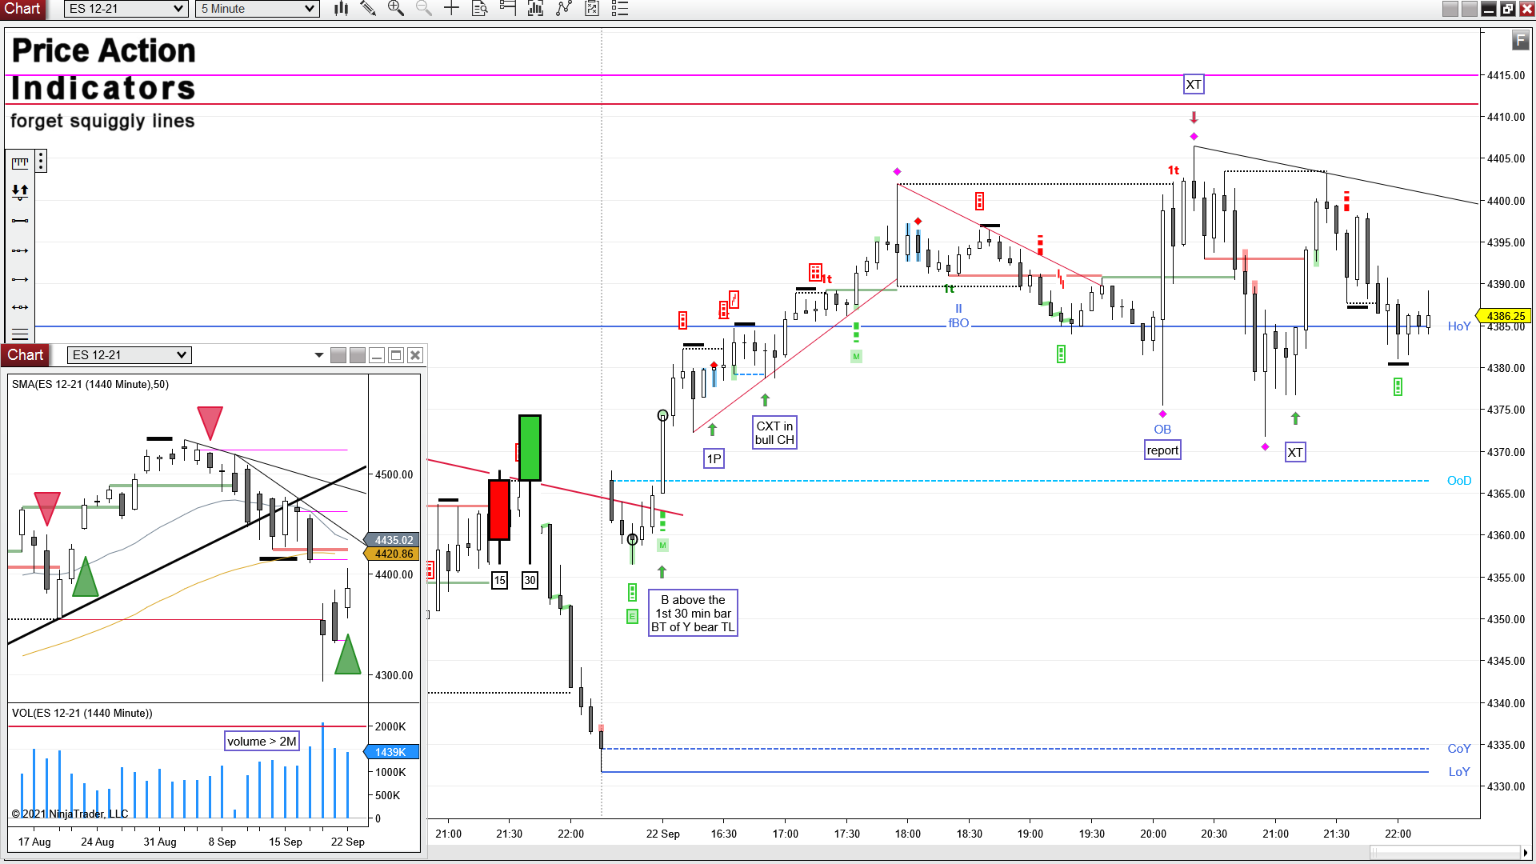
daily chart
Always In Long (AIL) since today
Yesterday’s Breakout Pullback short triggered on the wrong side

for NinjaTrader® – Forget Squiggly Lines!
Bull gap, mid range, shallowest trend lines from yesterday, BT, 1P, bull CH, CXT, XT
FOMC report
daily chart
Always In Long (AIL) since today
Yesterday’s Breakout Pullback short triggered on the wrong side
Bear gap, mid range, Opening Range, 2fBO, FF, fL2, fBO, mDT, LH MTR, DT, DP, DB, mDB
the LOD was at a MM of yesterday’s PM trading range
the HOD was at the shallowest bear trend line from yesterday
The Buy Sell Pressure indicator had three nice signals.
Two were showing buying pressure (increasing overlap in a bear move and decreasing overlap in a bull move) before a buy signal bar.
One showed selling pressure (shrinking bull bodies in a bull move) on the mDT, which was the HOD.
E-mini S&P 500 Future 5 min chart (trend lines, arrows and boxed text drawn by hand)

daily chart
Always In Long (AIL) since 10/10
Bull Inside Bar
Bear gap, mid range, T1B, 1Tail, mDT, bear CH, HL MTR, 1P, H2, WfBO, fH2, 1P, shallowest trend lines from yesterday
the low of the 1st 15 min bar was support before lunch

daily chart
Always In Long (AIL) since 08/29
failed Entry Bar for the bear OIO
Breakout Pullback of the August tight trading range
Continuation, fBO, fH2, BP, bear CH, DT, shallowest trend lines from yesterday
Continuation = Yesterday’s bear CH or TR continued
small TR day
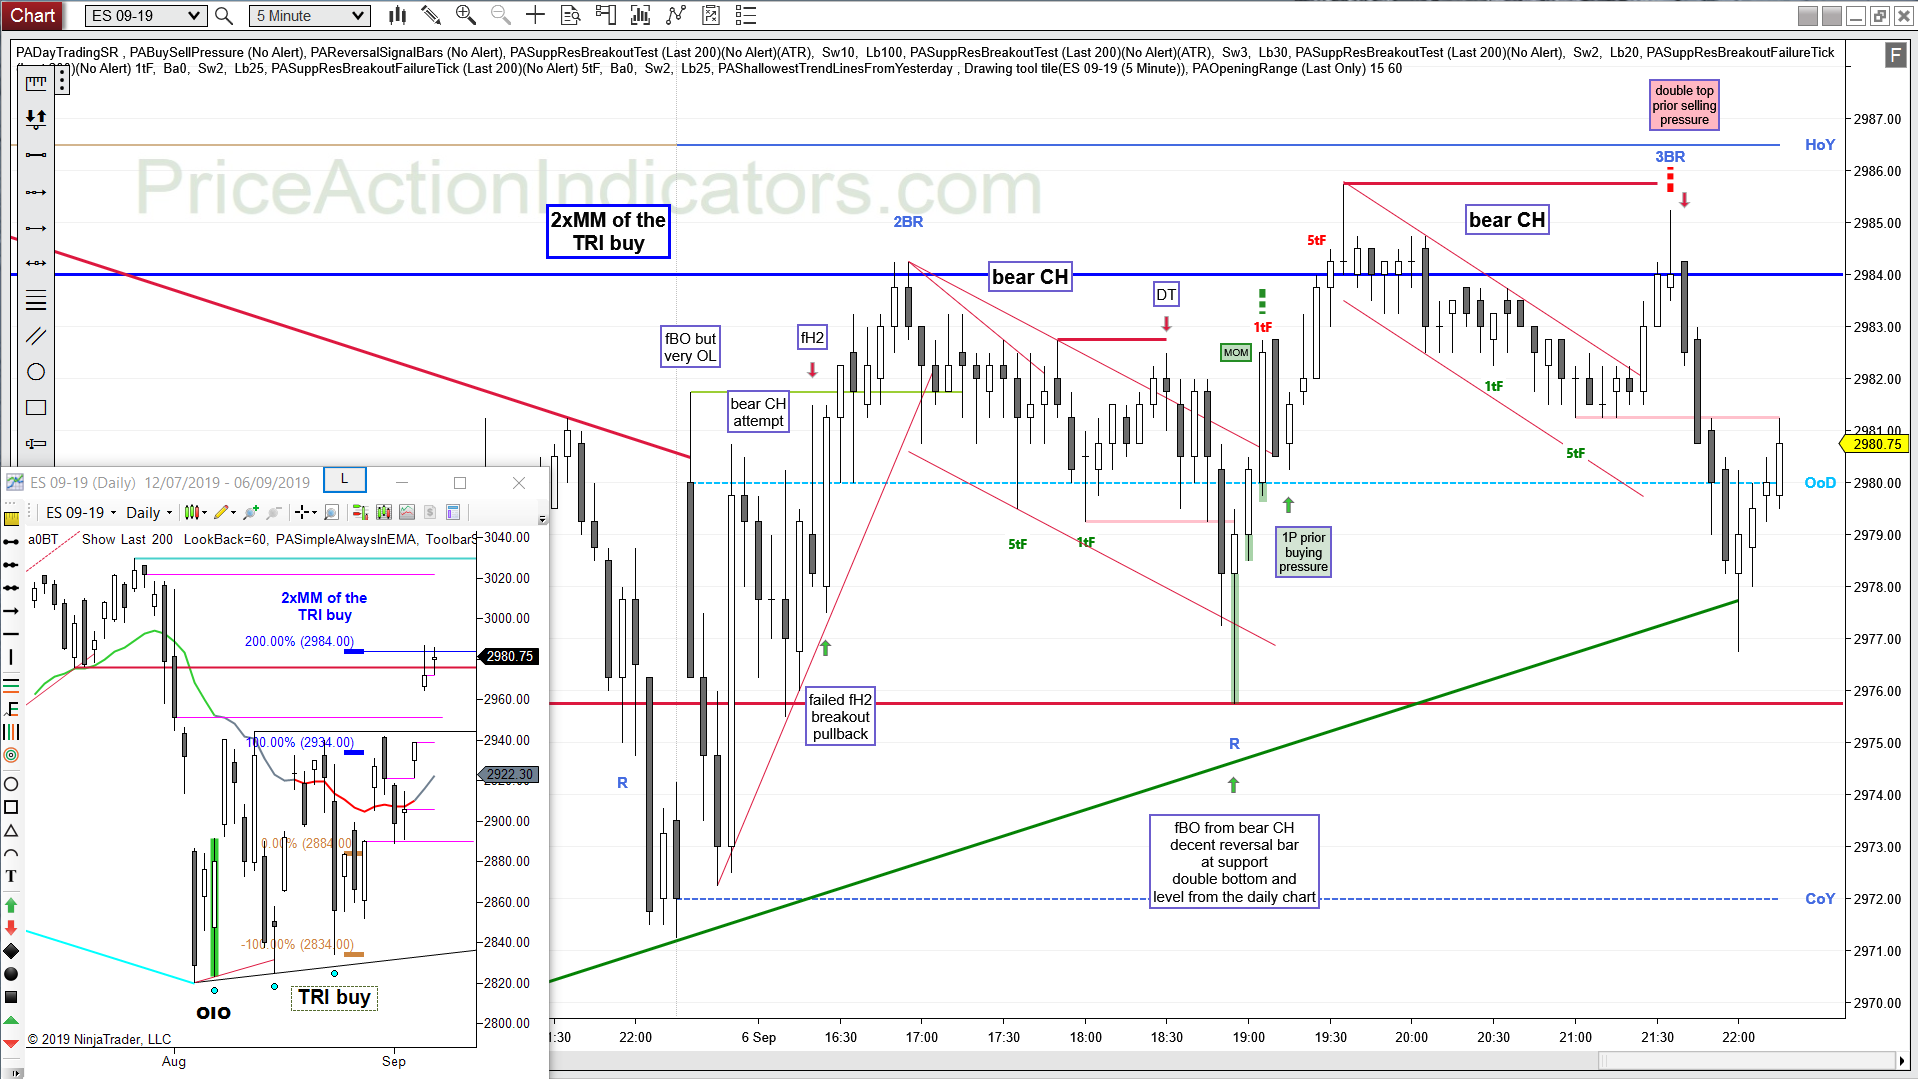
daily chart
Always In Long (AIL) since 08/29
bull inside bar, more profit taking by the bears at 2984 (see daily inset)
bulls kept the gap with Y close open -> BGP
Continuation, Opening Range, shallowest trend lines from yesterday, fBO, DT, DP, DB, L2, WfBO, TCLOS, mDB, BP, BT
TR day, but nice range

daily chart
Always In Short (AIS) since 08/14
Double Bottom with the low of last week, an okay Signal Bar for the bulls
probably buyers above