E-mini ES daily chart #ES_F

Always In Long (AIL) since 01/04

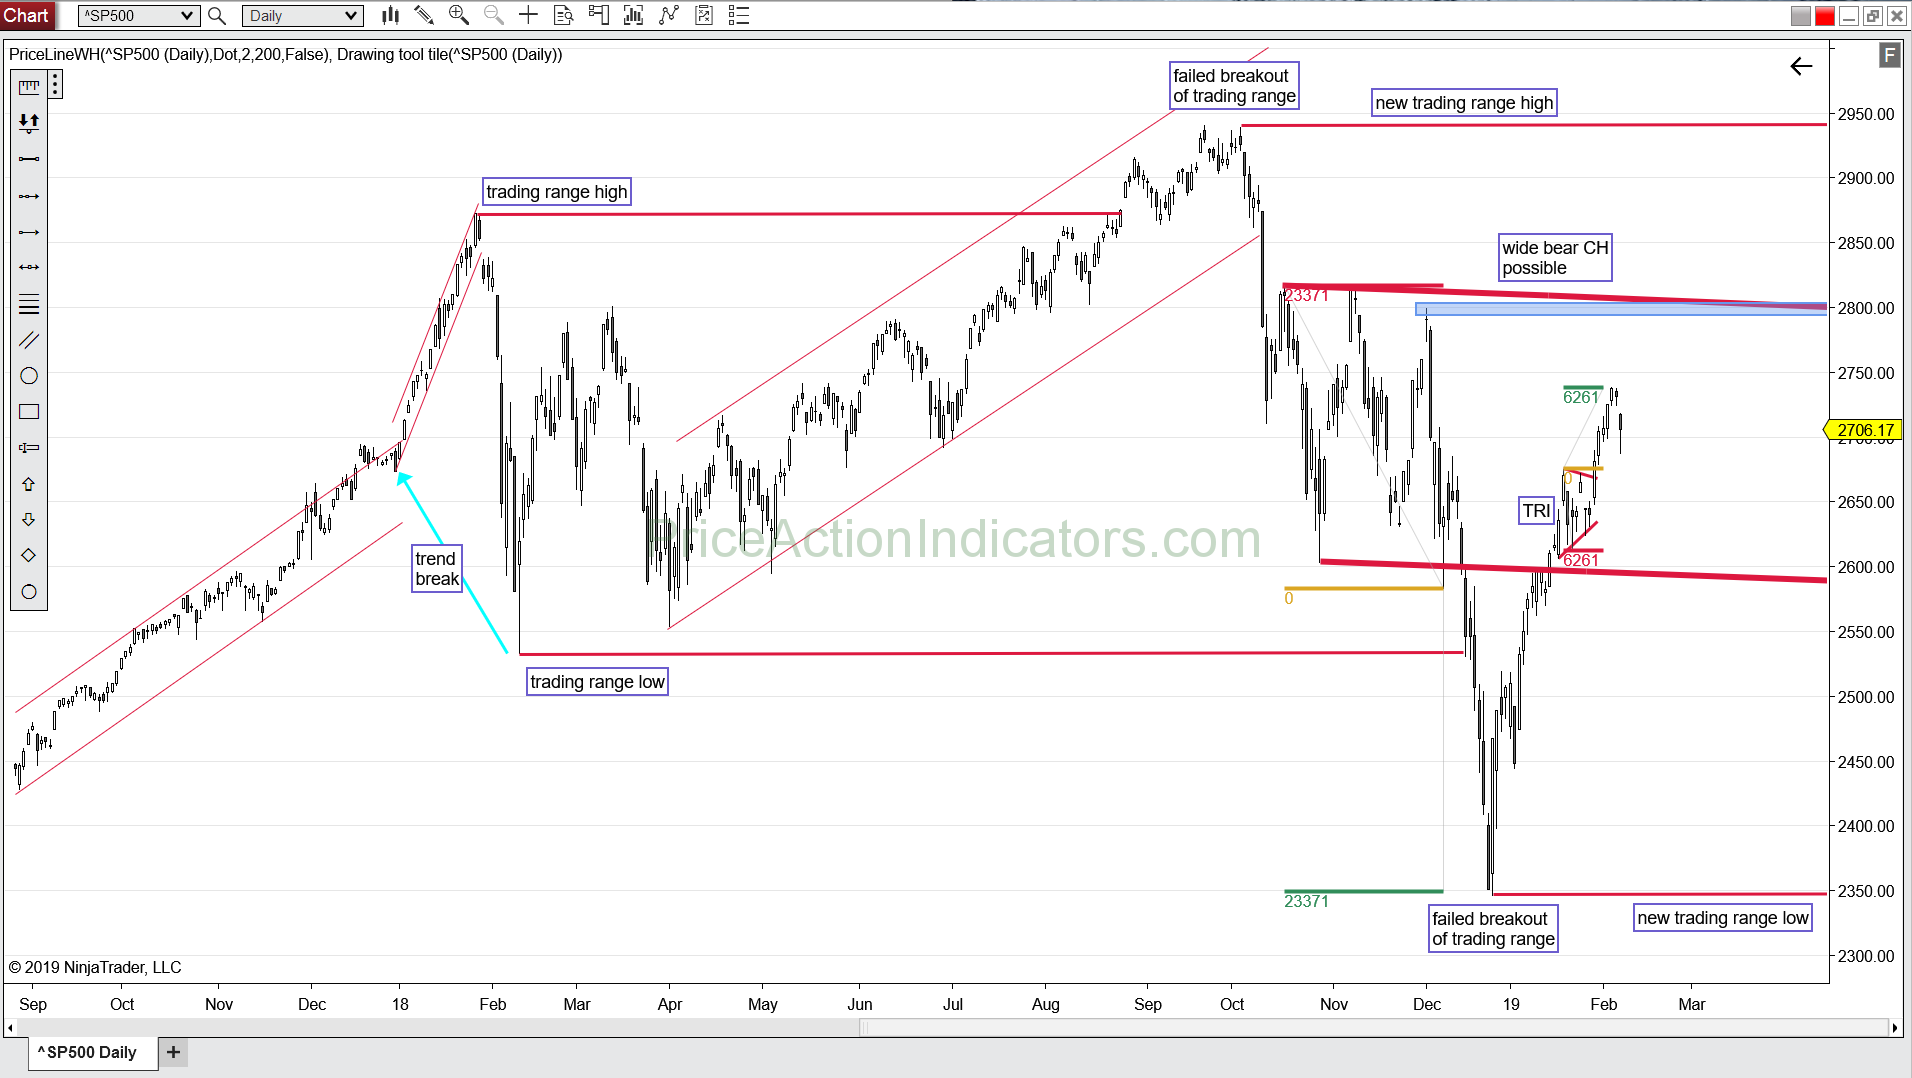
bears still might see a shallow wide bear channel below 2800, this wide channel can also be the channel part of a spike & channel trend pattern (the spike was the strong breakout from the double top at the all-time high)

bulls have a strong move up from the failed breakout of last year’s trading range low, but this might be only a “mini” trend within the large trading range

price formed a triangle a couple of days ago, which might act as a final flag (a trend termination pattern) in that “mini” bull trend

E-mini ES 2019/02/07 #ES_F

Bear gap, below LOY, bear MC, 1CHBO, 1Tail, SC, L2, L3, DB, fBO, fH2, HL MTR, BT
point landing at the open of the week (OOW)

daily chart
Always In Long (AIL) since 01/04
the mDT triggered, bears got a weak Entry Bar (EB)
bulls bought at the 38% Fibonacci retrace of the last bull leg

E-mini ES 2019/02/06 #ES_F

Continuation, W, DB, fH2, DT, fL2, fH4, fH5

daily chart
Always In Long (AIL) since 01/04
we overshot the 62% Fibonacci retrace (2719.75) (see yesterday’s post) by exactly 18 points ;-), might be bears scaling in, bulls still could keep the gap at 2719.75 open

but bears have a micro double top (mDT) now, today closed as a small bear body
the triangle (TRI) from a couple of days ago could act as a Final Flag (FF)

E-mini ES 2019/02/05 #ES_F

Bull gap, above HOY, bull CH, 1CHBO, 1W, mW, fH2, LH MTR, fBO, TCL OS
some double top price action, a small trading range day

daily chart
Always In Long (AIL) since 01/04
bulls have a 2nd closed above the 62% retrace of last year’s sell-off (2720), follow through bar for the bulls
bears are still at the skiing resort 😉