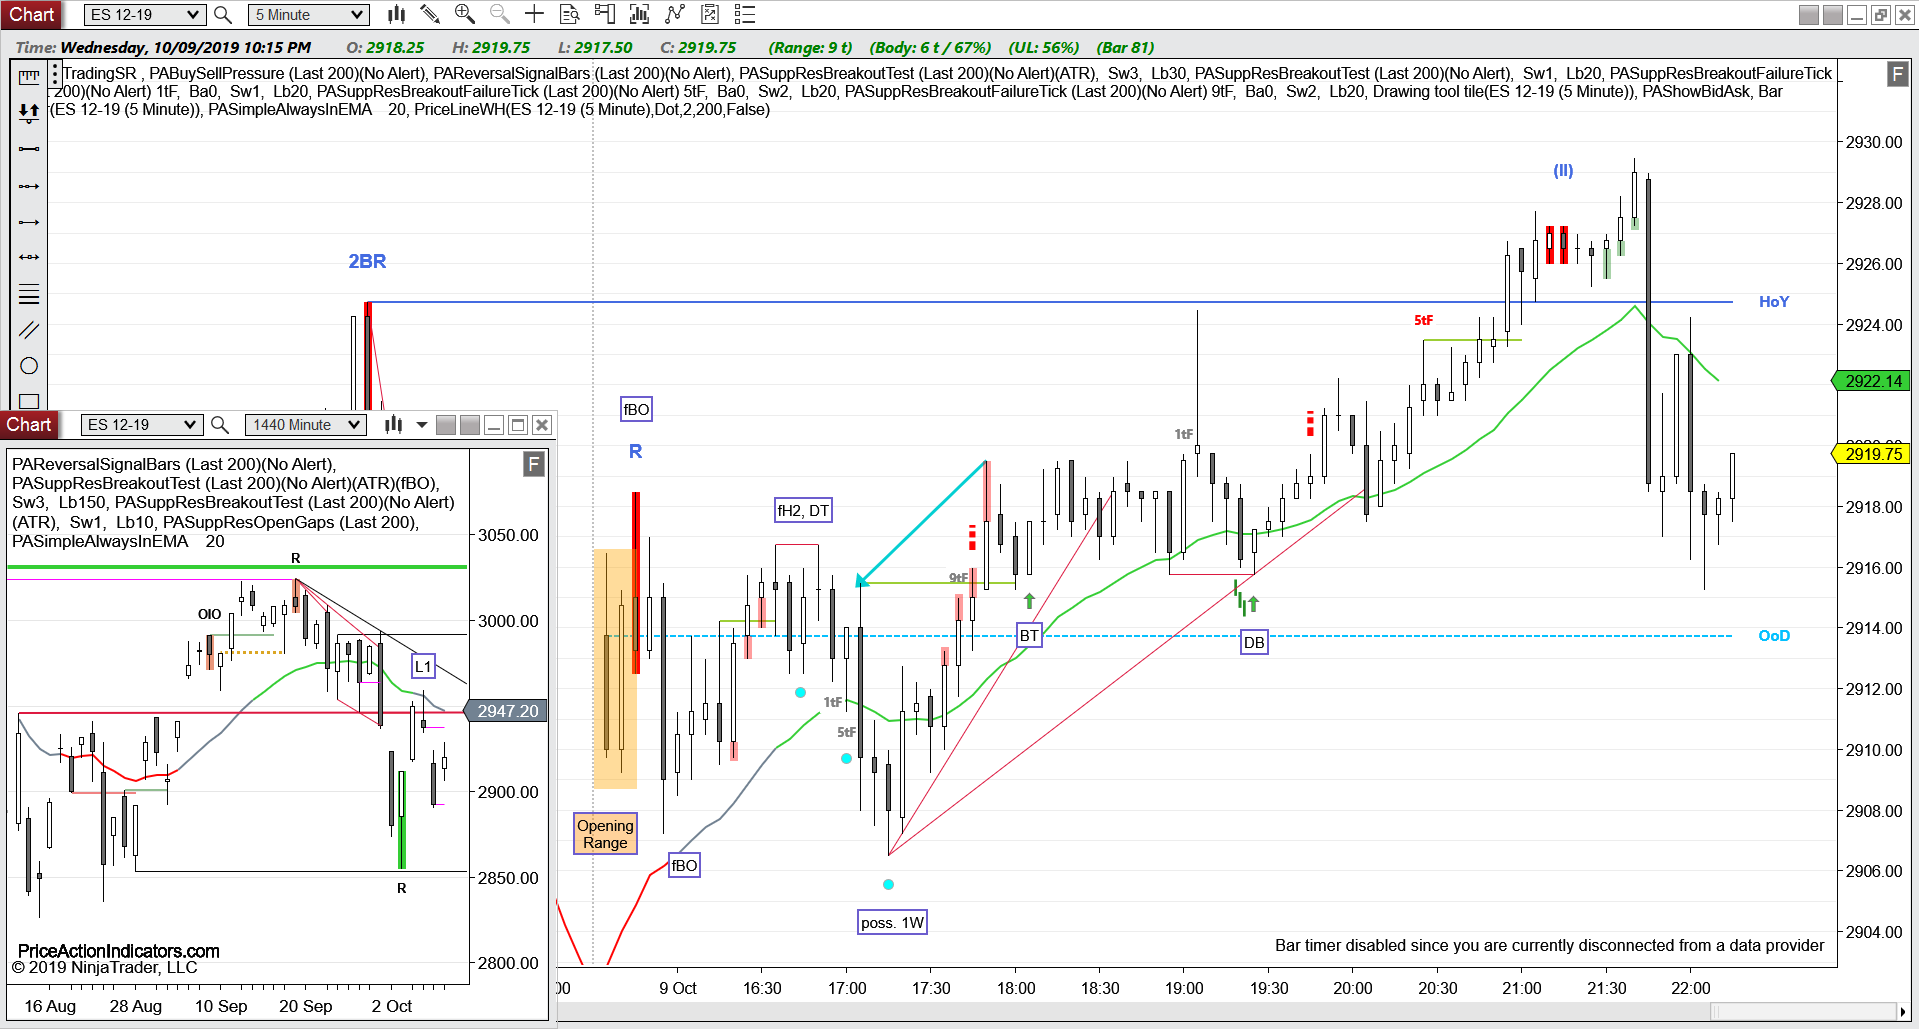
Bull gap, above HOY, T1B, SC, 1P, BX, H2, DB, BP, L5
bull trend day, a CH often becomes a leg in a TR
after the L5 we took out the start of the bull CH
The Reversal Signal Bars indicator gave a 2BR reversal signal pattern at the HOD. The 2nd trend channel line overshoot (TCL OS) was a nice strengthener.
E-mini S&P 500 Future 5 min chart (trend lines, arrows and boxed text drawn by hand)
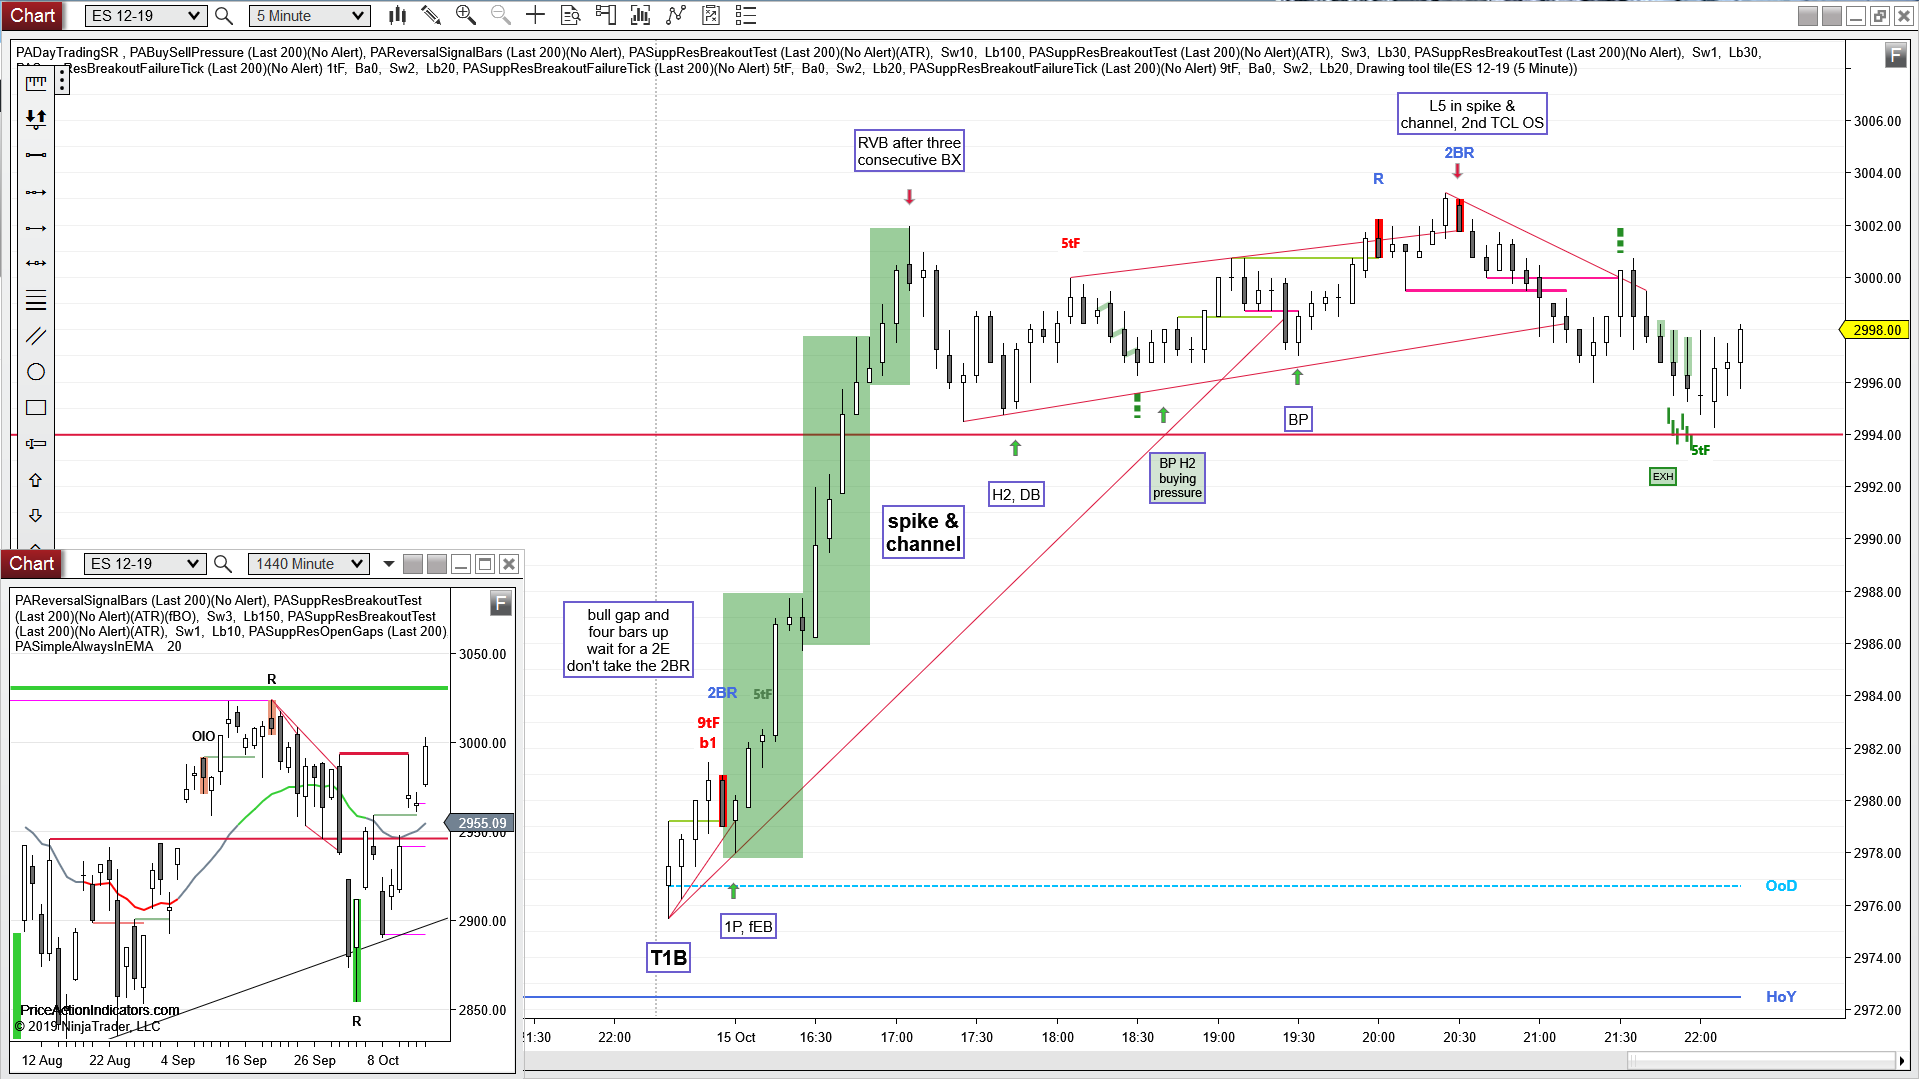
daily chart
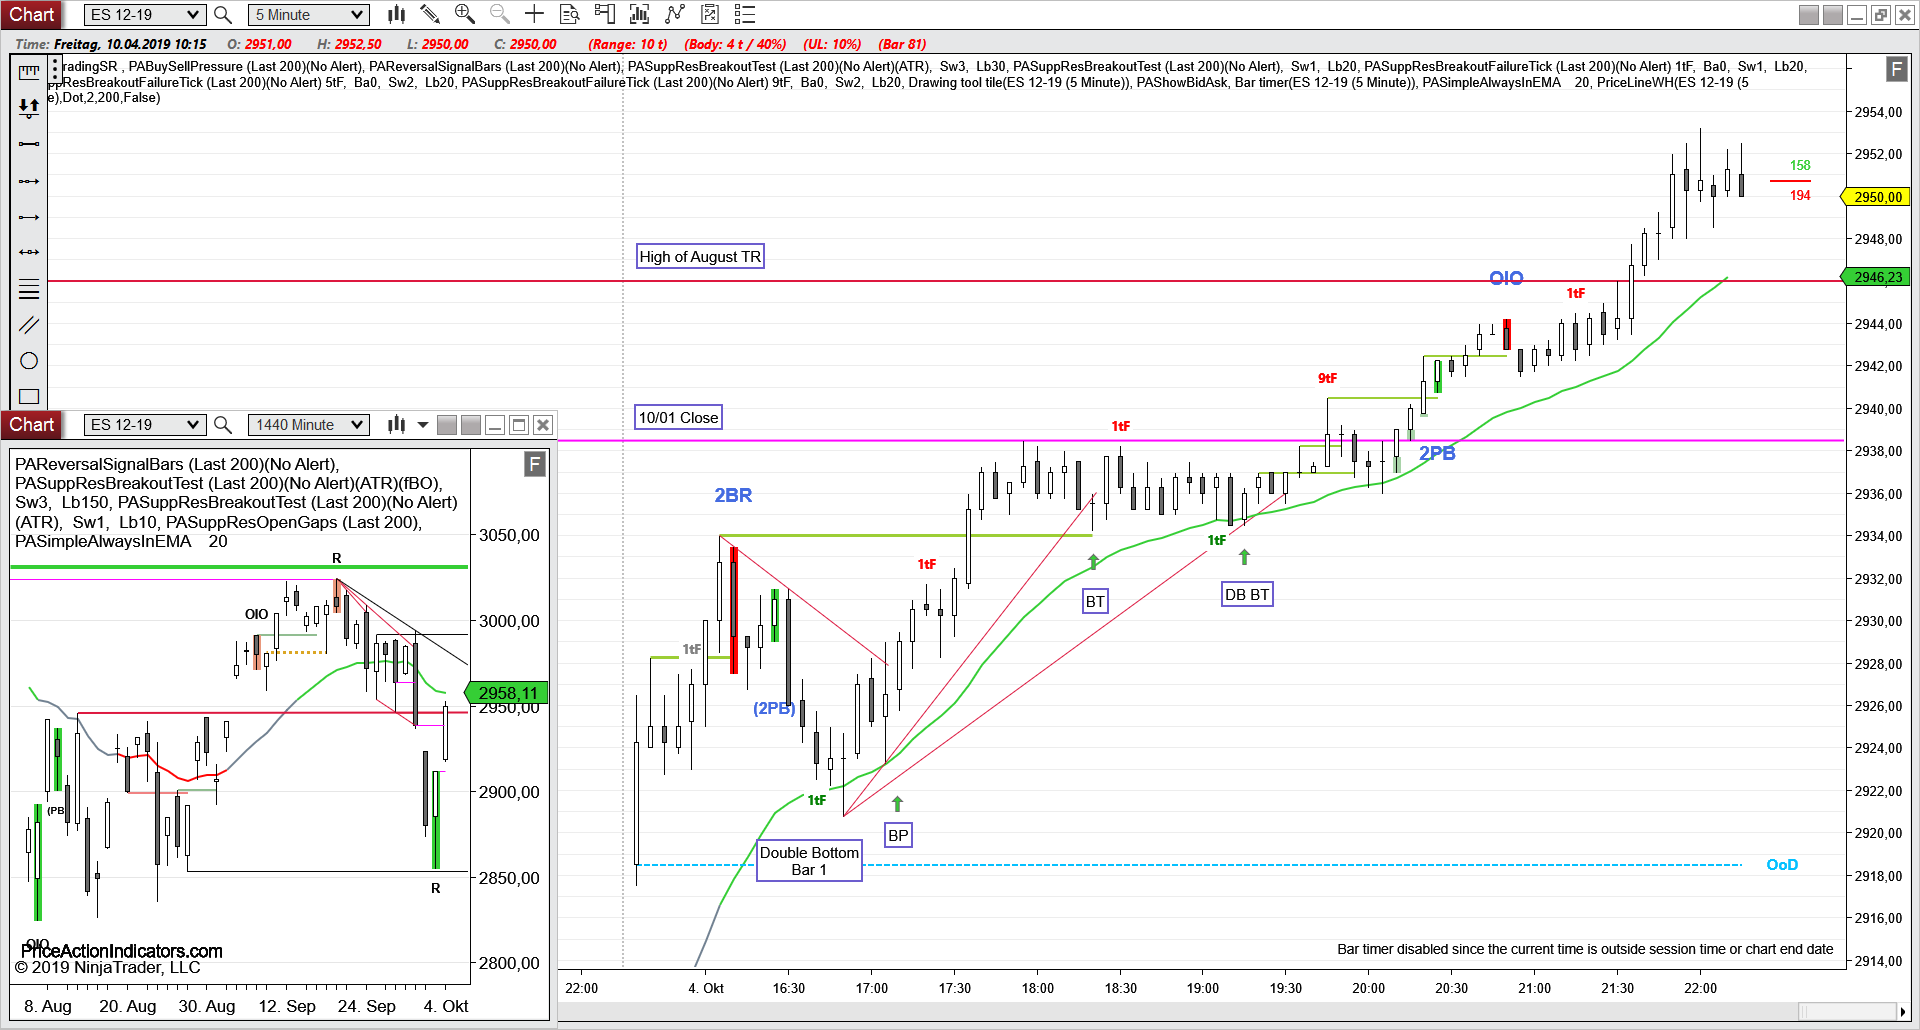
Always In Long (AIL) since 10/10
Buyers above yesterday’s failed bear Entry Bar
third push from the Reversal Bar (R) a couple of days ago