Continuation, fBO, bull MC, DT, DP, HL MTR, L2
E-mini S&P 500 Future 5 min chart (trend lines, arrows and boxed text drawn by hand)
daily chart
Always In Long (AIL) since 12/06
weak EB for yesterday’s mDT

for NinjaTrader® – Forget Squiggly Lines!
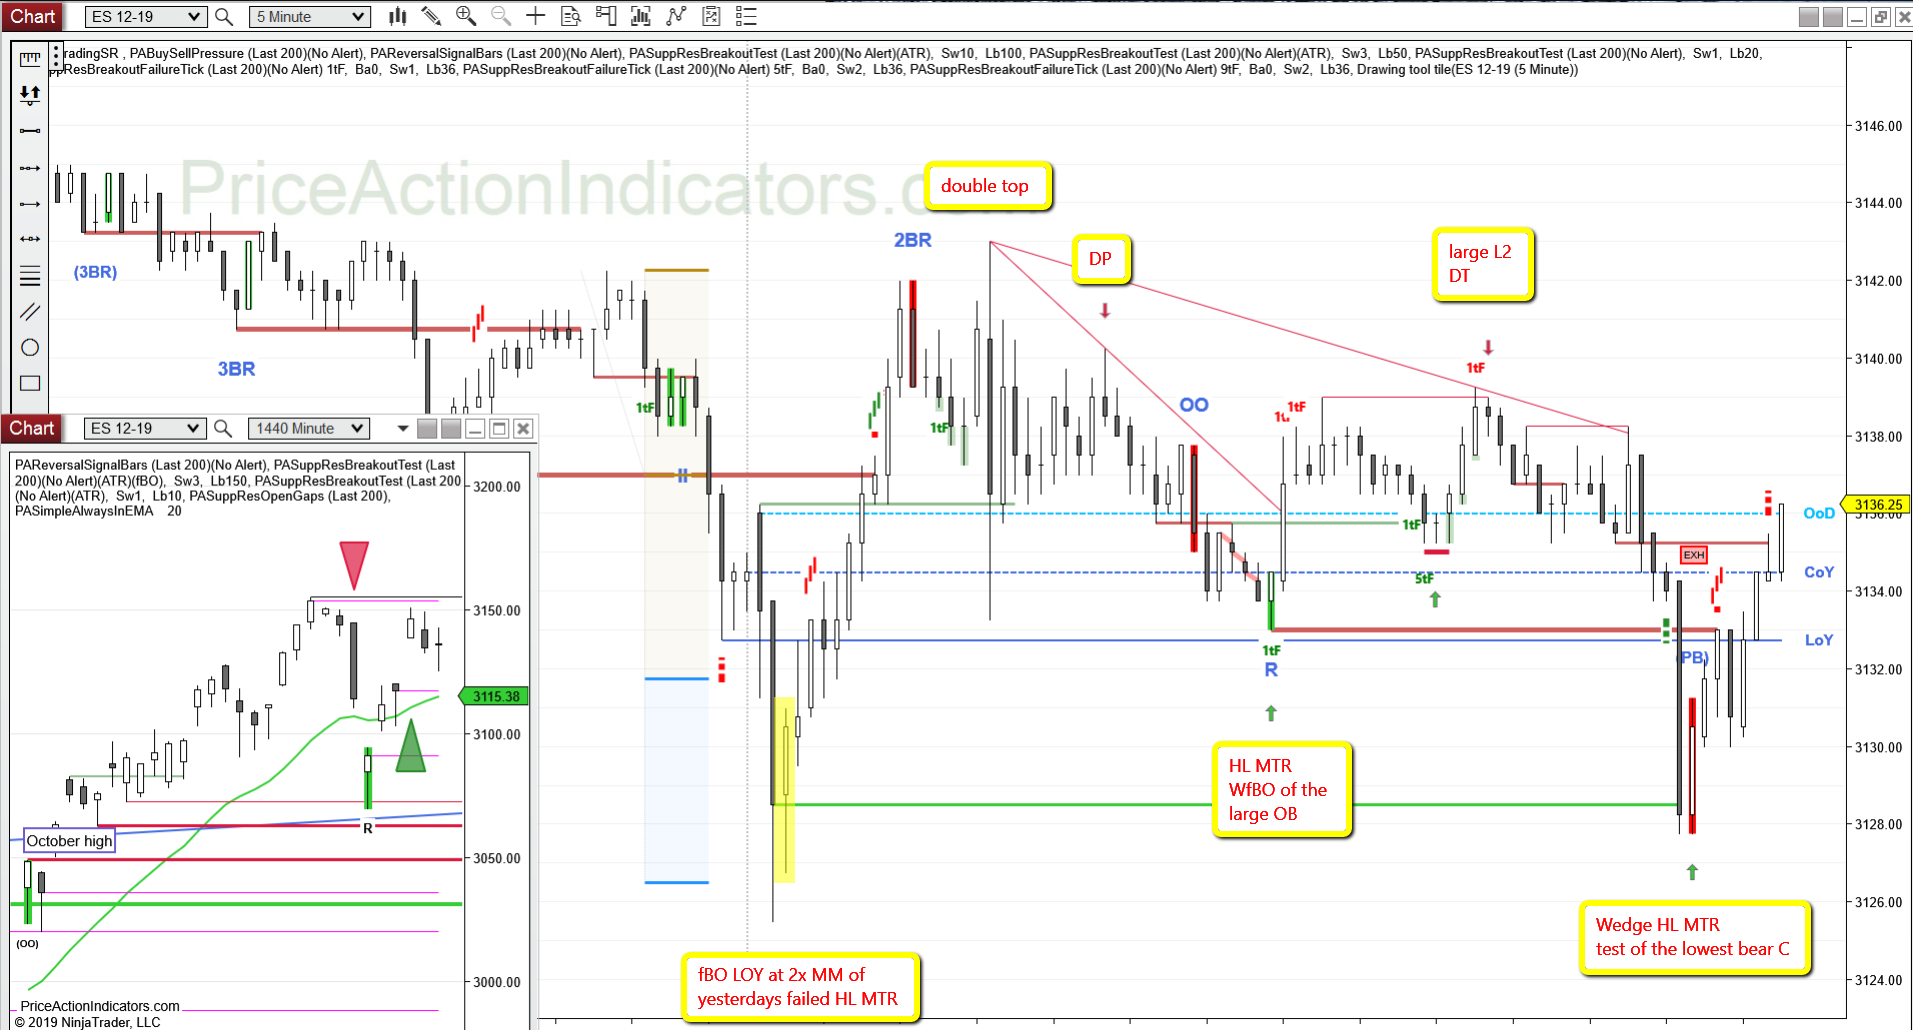
Continuation, fBO, bull MC, DT, DP, HL MTR, L2
E-mini S&P 500 Future 5 min chart (trend lines, arrows and boxed text drawn by hand)
weak EB for yesterday’s mDT
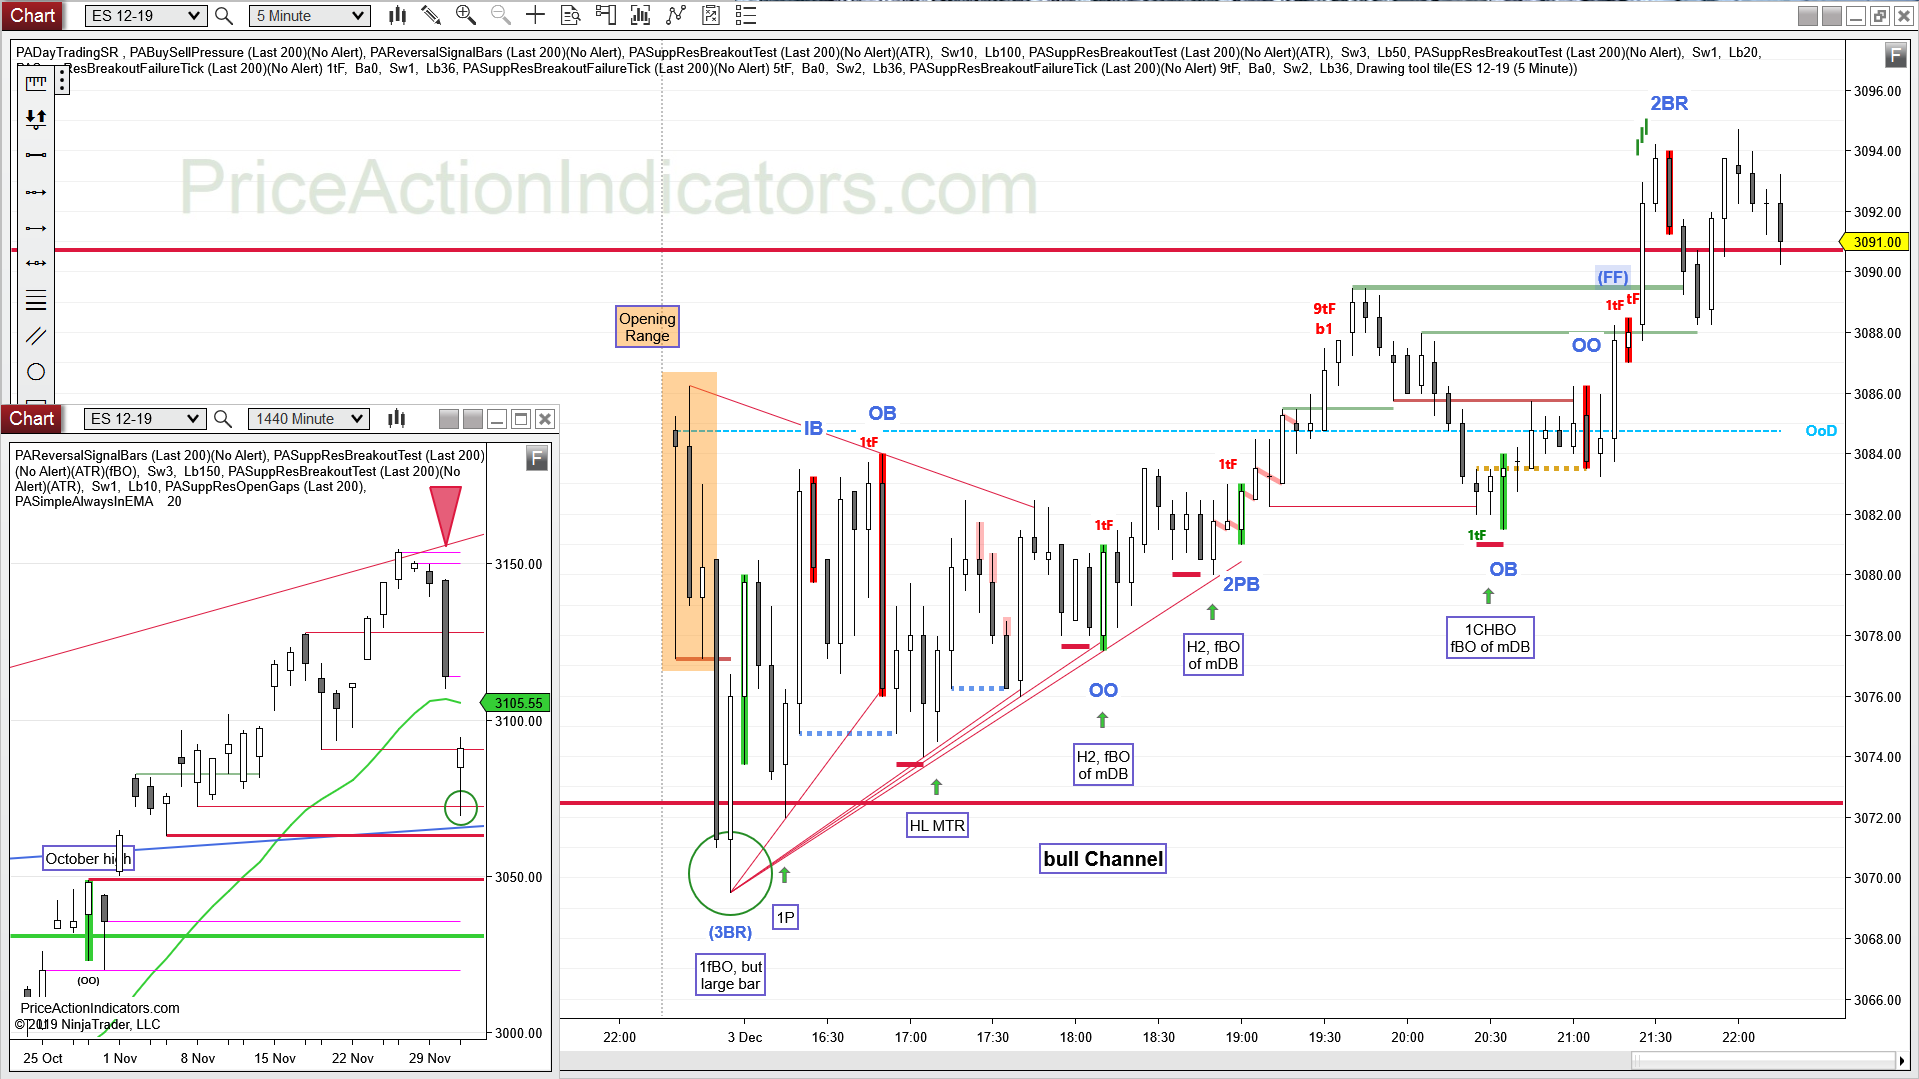
Bear gap, below LOY, Opening Range, 1fBO, 1P, HL MTR, H2, mDB, 1CHBO, bull CH
triangle & bull channel
The 1P had a couple of good strengtheners:
E-mini S&P 500 Future 5 min chart (trend lines, arrows and boxed text drawn by hand)
Bull RVB, failed BO and no FT bar for yesterday’s bear BO bar
bulls managed to close 1t above the prior BO level (11/20 HL)
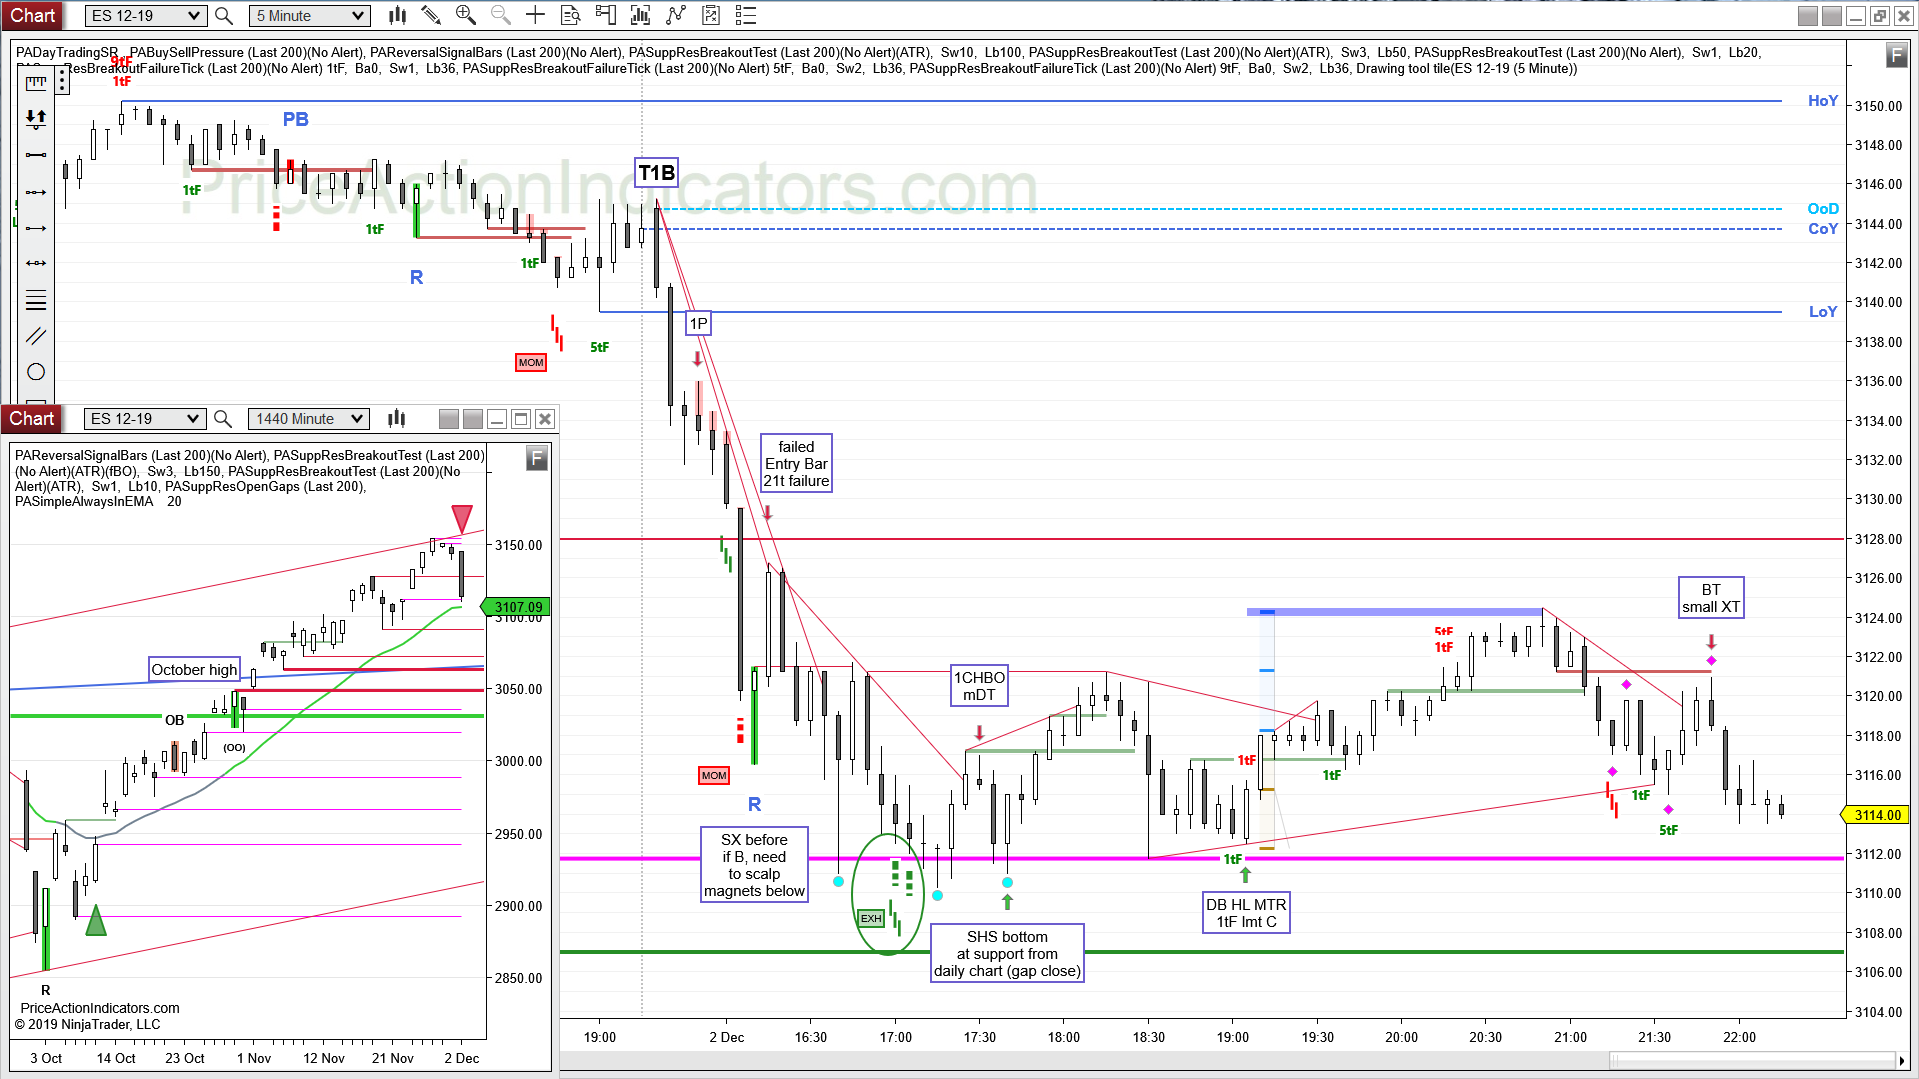
Continuation, T1B, 1P, fEB, SC, 1CHBO, inv. SHS, DB, HL MTR, XT, BT
bear spike and channel
the 1st B on the RVB at bar 8 occurs right after a sell climax (the largest bear bar of the day), a reasonable buy despite 7 bars down before
but watch out for a failure of the bulls and exit your long, if that happens, here we got a 21 tick failure and a close just below the bear TL on the EB for that RVB
bulls exit at the close of the EB and bears S that lmt C
E-mini S&P 500 Future 5 min chart (trend lines, arrows and boxed text drawn by hand)
Bear BO, gap close, probably get FT down
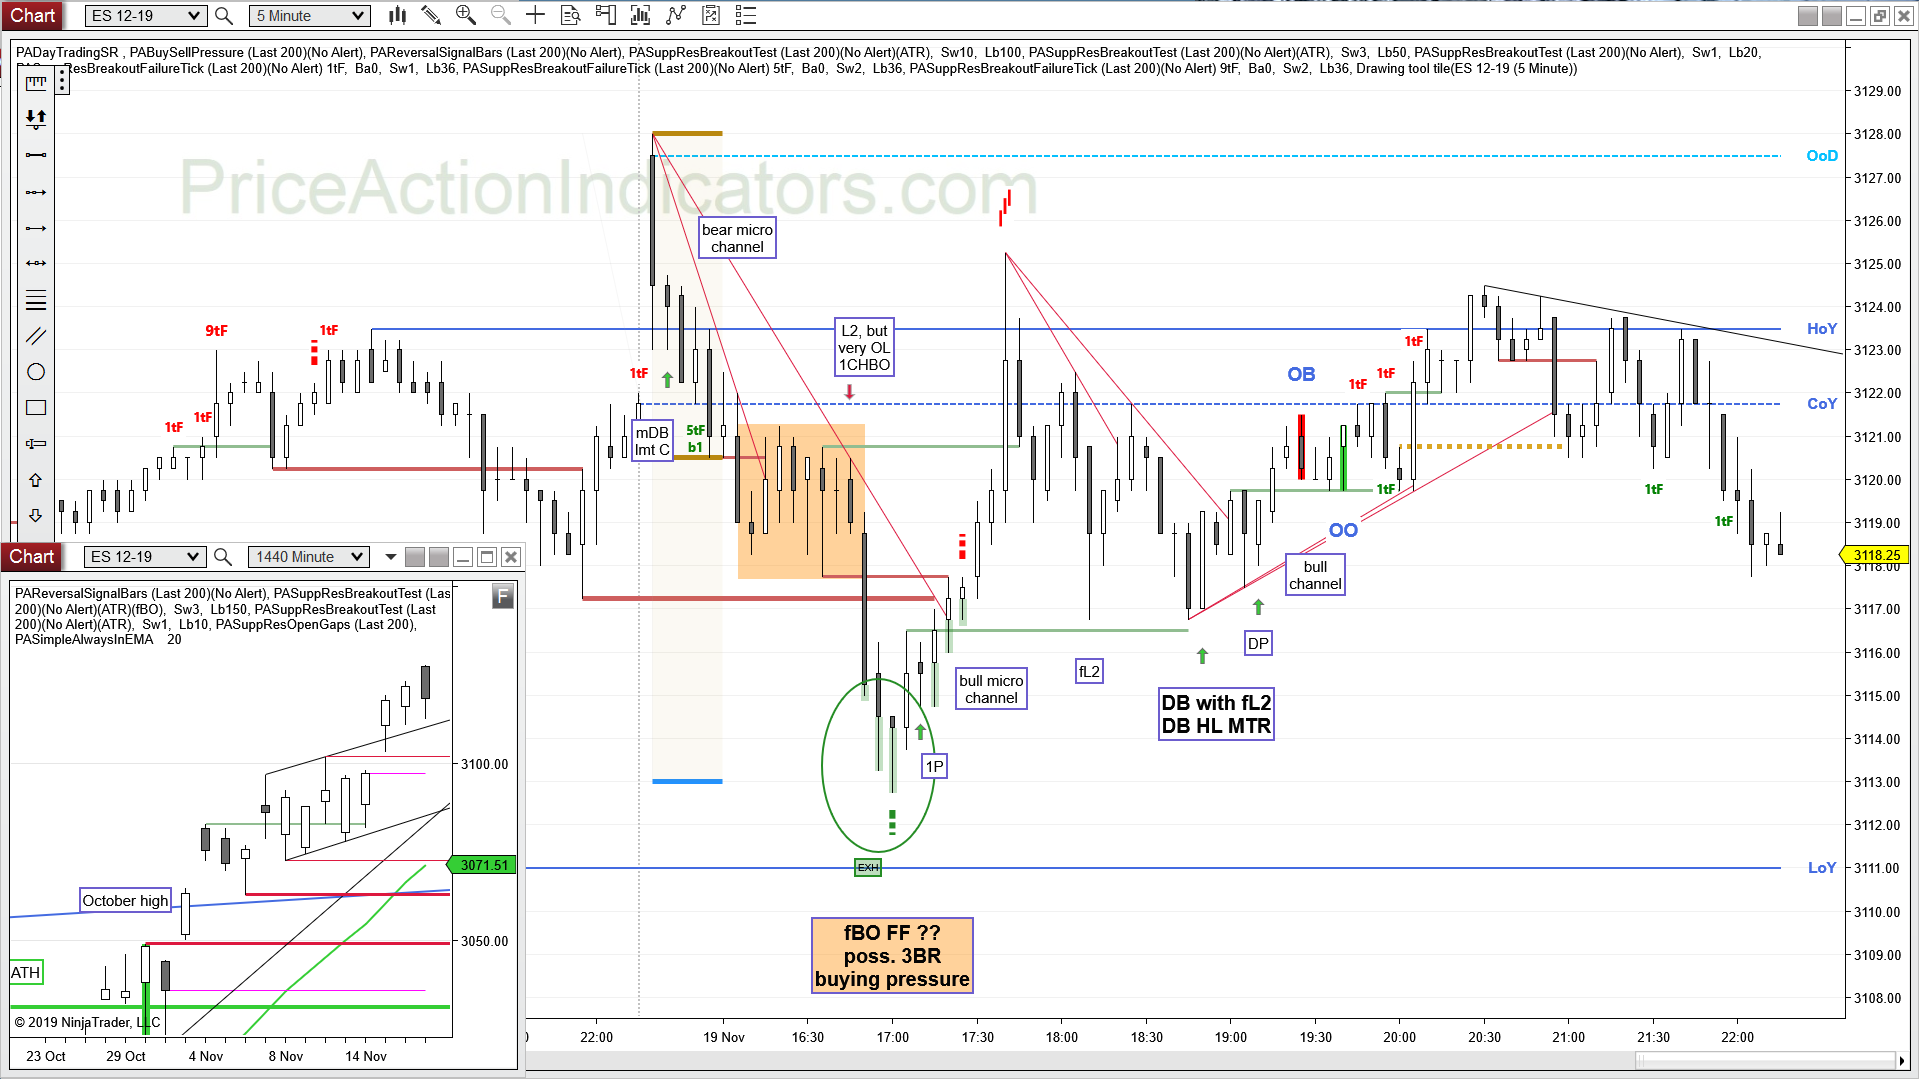
Continuation, mDB, bear MC, L2, 1CHBO, FF, fBO, bull MC, DB, HL MTR, fL2, bull CH
despite the good buying pressure (shrinking bear bodies with increasing lower tails) at the LOD, the move off of the DB HL MTR was only a weak bull CH and didn’t make it to the target, which would have been the high of the bull MC (the prominent LH)
E-mini S&P 500 Future 5 min chart (trend lines, arrows and boxed text drawn by hand)
1st bear close after seven bull bodies, not a short yet
we’re still “Always In Long” on the daily chart
Continuation, WfBO, HL MTR, fL1, fL2, H2, DB
Buyers at the gap close with Friday (Close of last week)
A lot of Selling Pressure during the spike from the DT with the LH in yesterday’s bear CH, but this was just a sell climax testing support (Close of last week).
E-mini S&P 500 Future 5 min chart (trend lines, arrows and boxed text drawn by hand)

daily chart
Always In Long (AIL) since 10/10
Bull Reversal Signal Bar for a H1 buy
Buyers at the Close of last week