Continuation, fBO, H2, fH3, bear CH, L2, mDB
larger triangle at support
daily chart
Always In Long (AIL) since 08/29
Outside down bar, but with a weak close (also an OIO)
a bear Signal Bar, probably sellers below

for NinjaTrader® – Forget Squiggly Lines!
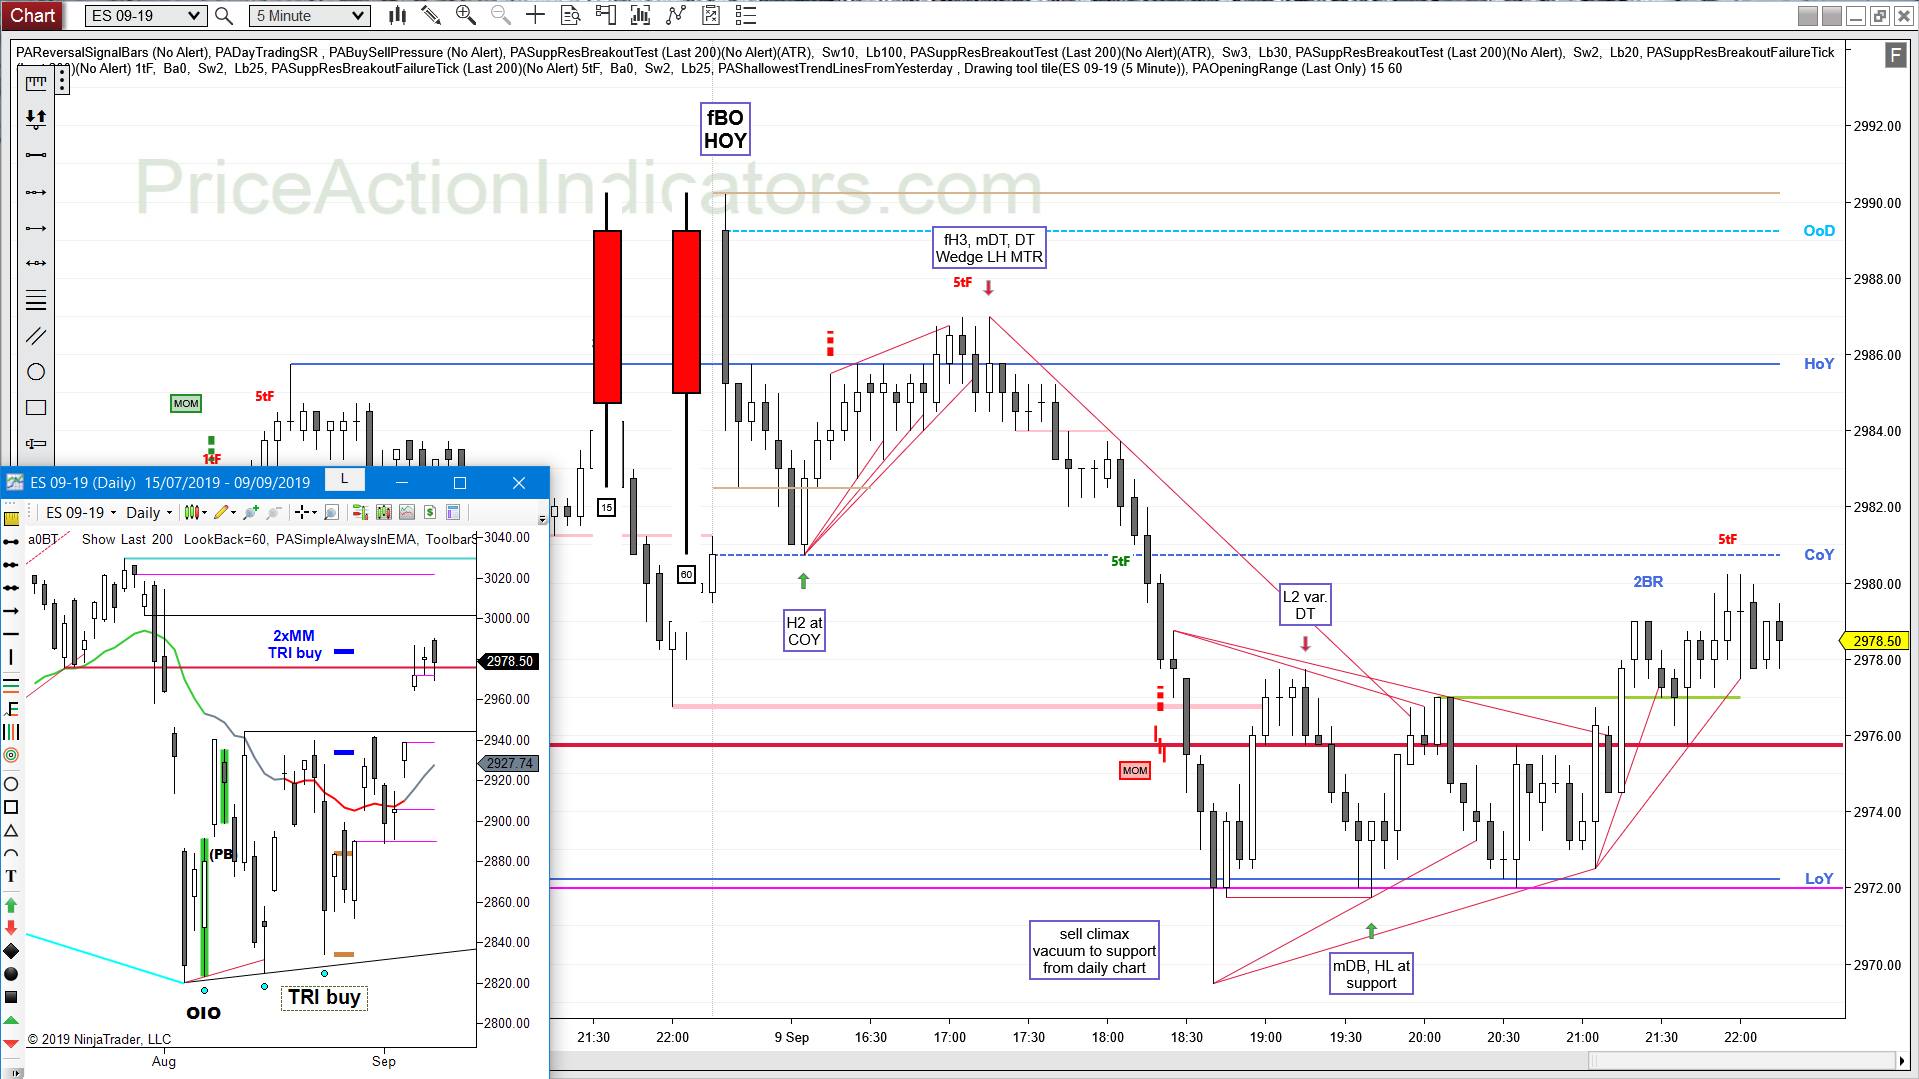
Continuation, fBO, H2, fH3, bear CH, L2, mDB
larger triangle at support
daily chart
Always In Long (AIL) since 08/29
Outside down bar, but with a weak close (also an OIO)
a bear Signal Bar, probably sellers below
Bull gap, above HOY, Opening Range, bear CH, L2, fBO, fL2, H2, DT, triple top, BT, mDB
we opened above the gap from the daily chart, tested that and moved up in a bull CH
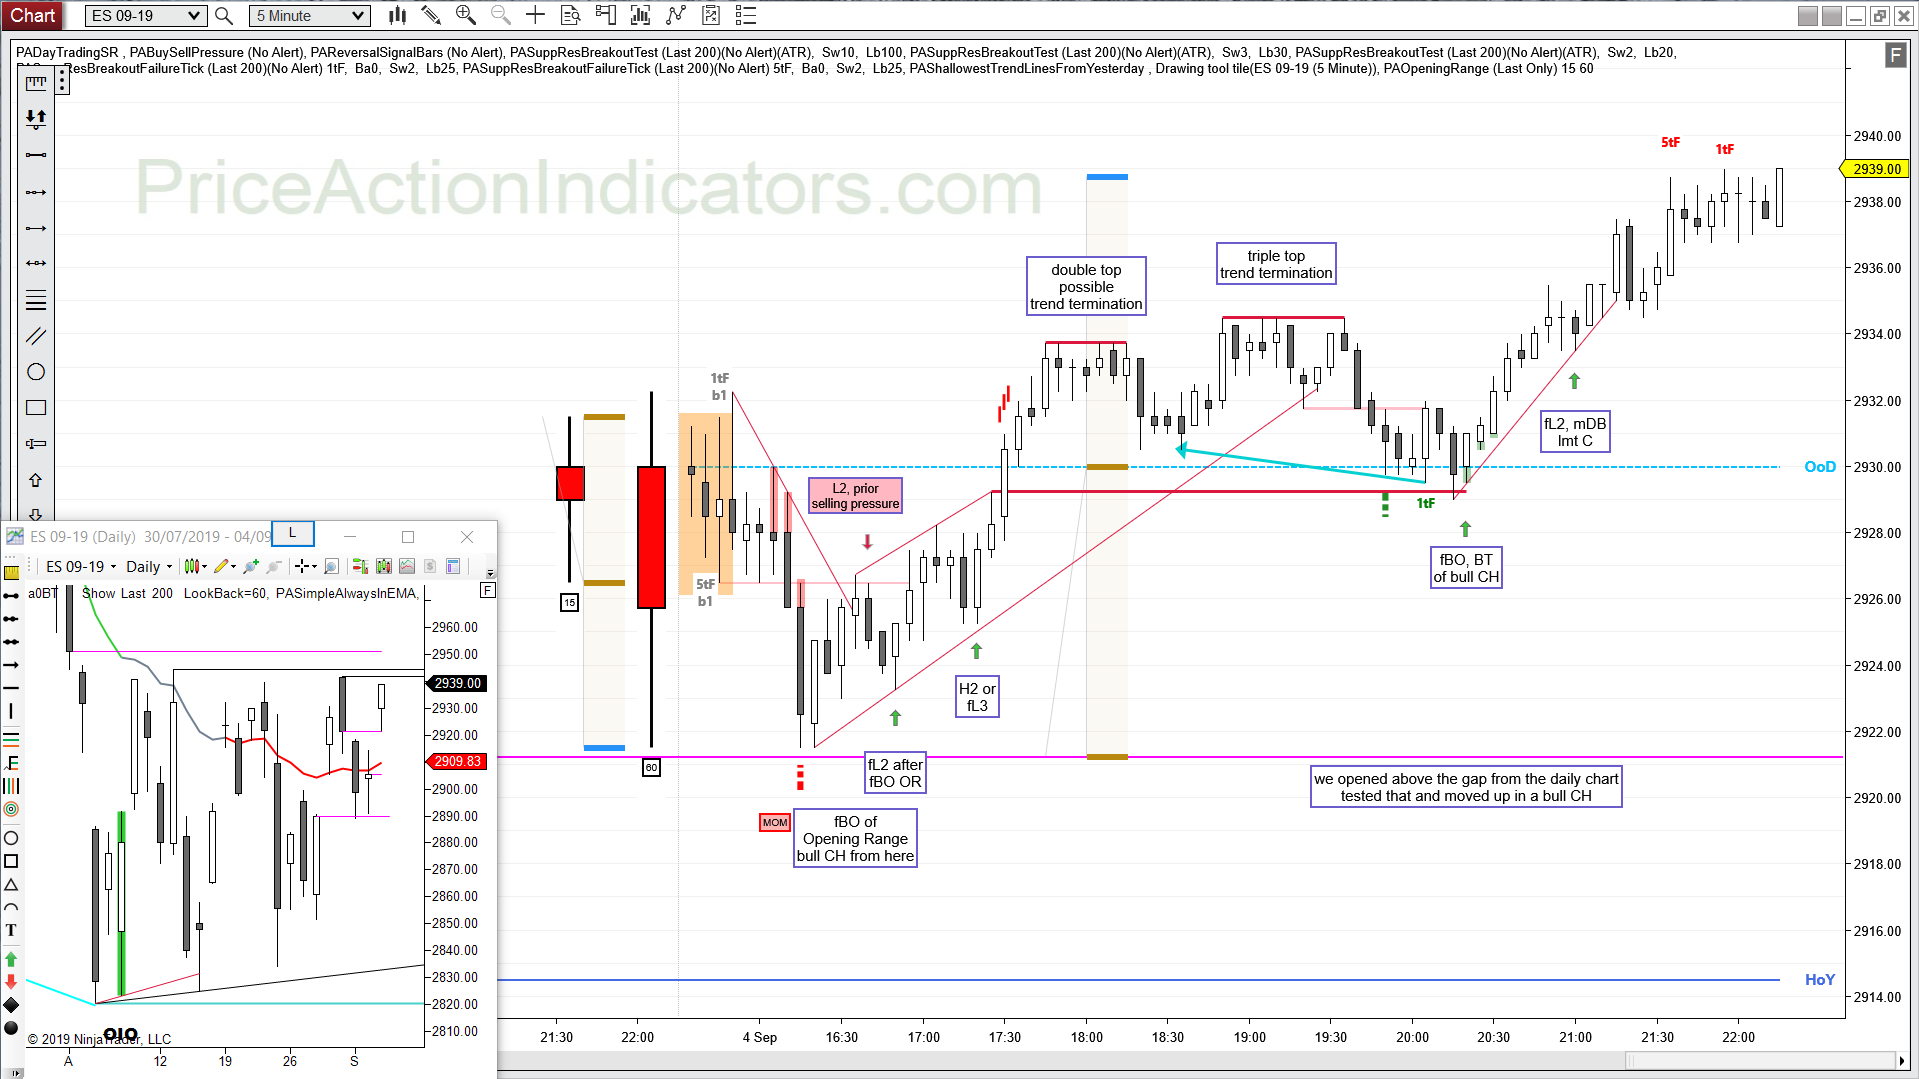
daily chart
Always In Long (AIL) since 08/29
Entry bar for yesterday’s bull Signal Bar
open above 08/30 gap and BT
Bull gap, mid range, Opening Range, bear CH, mDT, L2, L3, TCLOS, DB, 1W, DT, 2E, HL MTR, fBO, mW
again very nice PA around the open

daily chart
Always In Short (AIS) since 08/23
Failed Entry Bar for yesterday’s bull Inside Bar

Bar 1 is the Opening Range
we get a couple of failed breakouts (magenta markers) above and below
the Opening Range becomes larger each time
until the 1st successful breakout (BO + FT) below the 60 min bar
Bear gap, mid range, Opening Range, 1fBO, 1tF EB, BT, 1W, DT, W1P, SC, bear CH, mDT, L2

daily chart
Always In Short (AIS) since today
we closed the gap with the 08/15 close
bear Trend Bar closing near the low of last weeks range
three OL bars on the weekly chart, probably BB
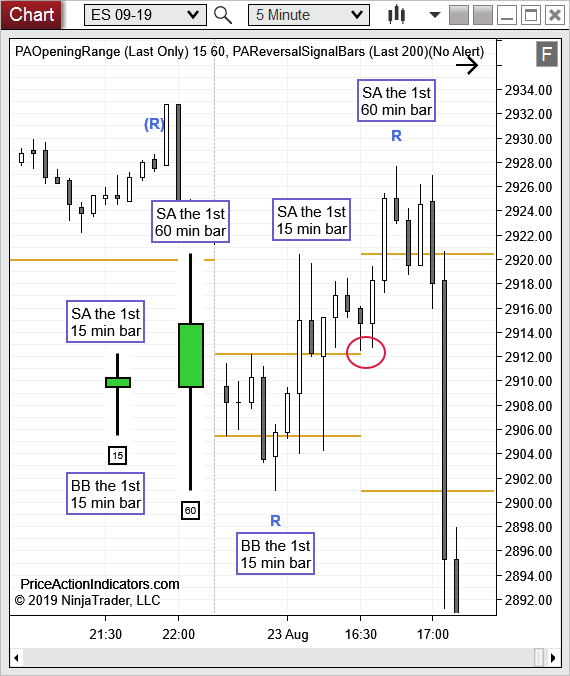
it doesn’t get any better than that on the Opening Range
the 1st 15 min bar of the day is a trading range bar, Buyers Below (BB) and Sellers Above (SA)
then there is a Breakout Test of the High of the Opening Range (red circle)
the 1st 60 min bar of the day is a trading range bar too, Sellers Above (SA)
The Reversal Signal Bars indicator, one of our Price Action Indicators, gave two RVB signals, one below the Opening Range and one at the HOD.
Continuation, fBO, fL2, 1tF BT, HL MTR, DT, mDT, 1P, fH2, 1tF EB, L2, XT, 1CHBO
Bar 5 RVB tries to reverse a bear SC, I wouldn’t consider a buy without the Buying Pressure of increasing lower tails in a bear move
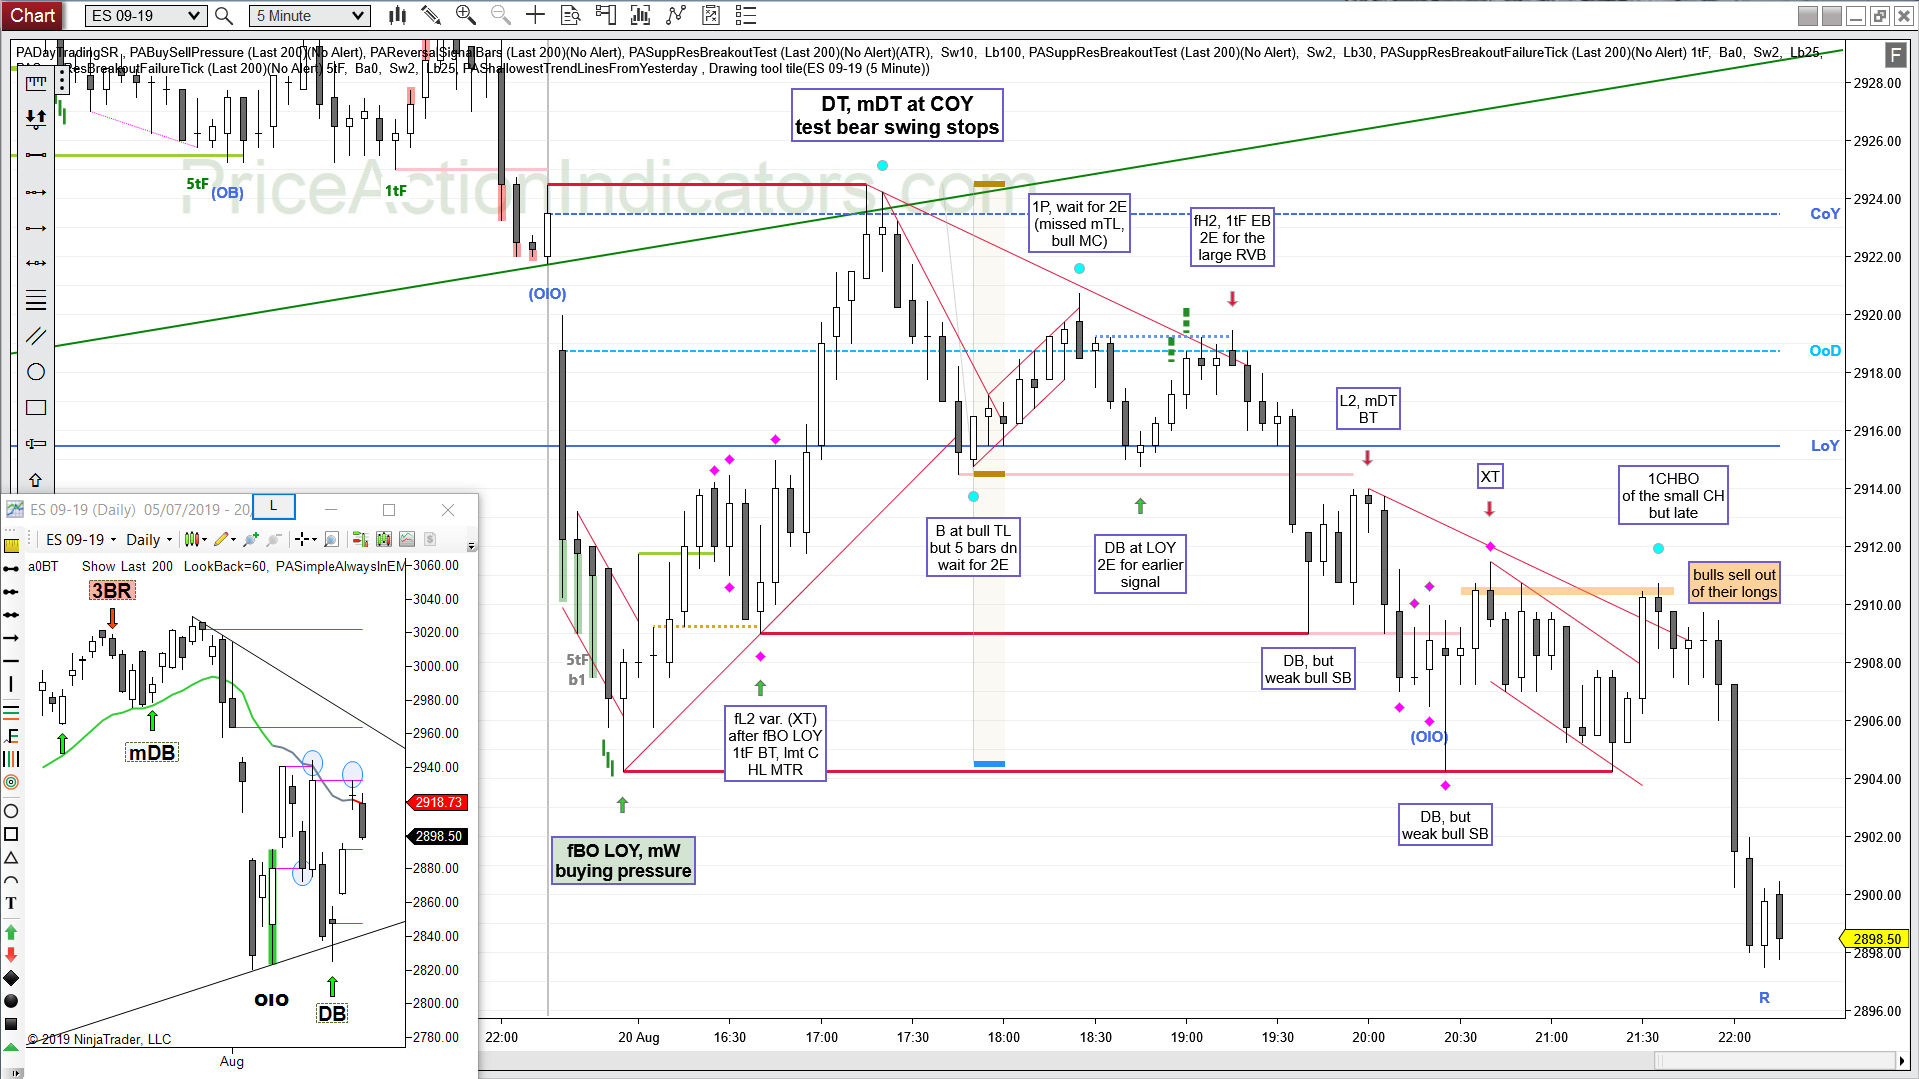
daily chart
Always In Long (AIL) since 08/19
Bear Entry Bar for yesterday’s bear Signal Bar at the daily EMA