and Breakout Test of the September Trading Range High

for NinjaTrader® – Forget Squiggly Lines!
and Breakout Test of the September Trading Range High
As a Day Trader horizontal Support and Resistance from the current and prior day are your main concern.
You can use the “Day Trading Support/Resistance” indicator for NinjaTrader Continue reading “Support & Resistance”
I mentioned that already in my post from 12/13
the 12/12 on the daily chart is a decent Signal Bar (SB) for a Breakout Pullback Stop Entry short (also a test of the open of the year)
the smallest Initial Risk for that trade, that makes sense (for a trader on the daily chart) is the high of the SB, a SB stop Continue reading “risk based Measured Moves and Initial Risk from the daily chart ruling the current PA”
E-mini ES 2018/12/18
today the opening range formed just below a possible profit target of the bears from yesterday, 2 x signal bar range (12/12 breakout pullback short), 2 x the initial risk for a short below that bar is at 2573.50
Continue reading “Broken measured moves often become support/resistance”
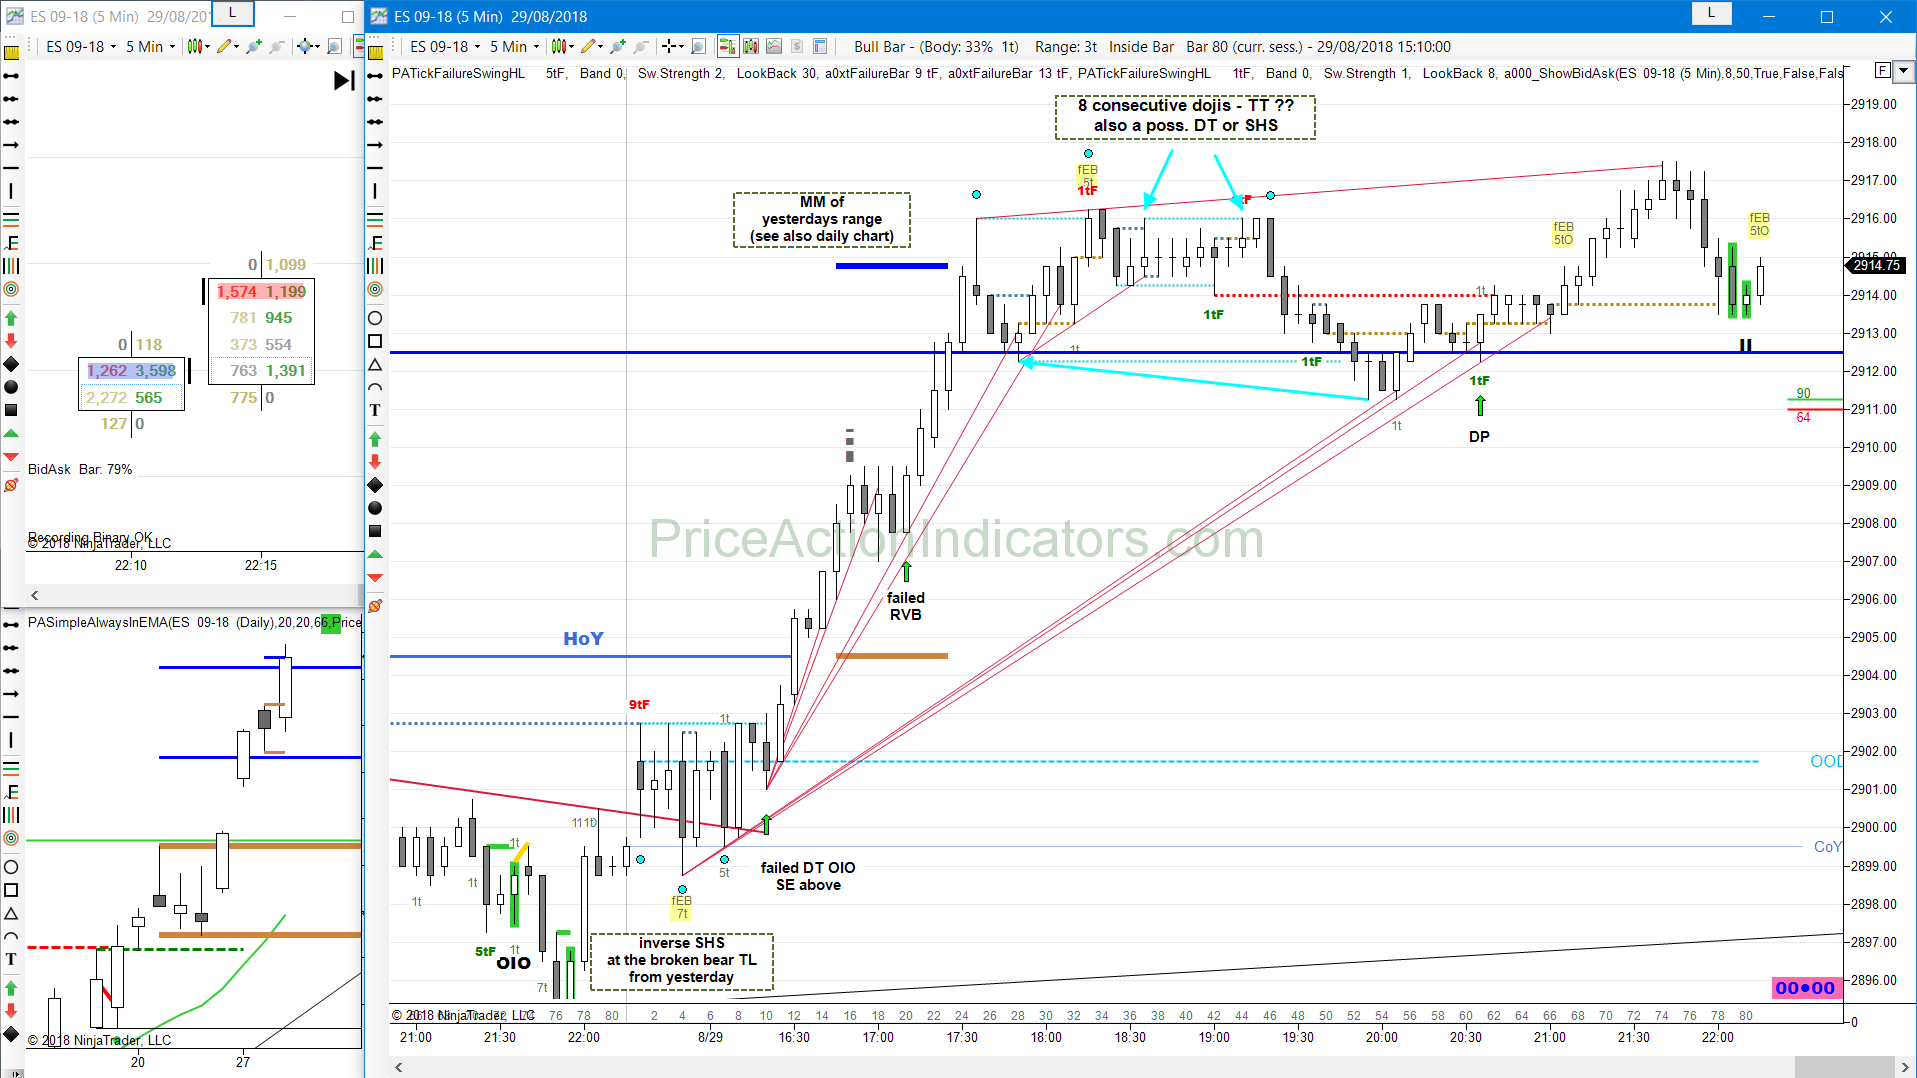
Continuation, SHS, failed DT, failed RVB, MM, DT, inv. SHS, deep PB, mDB, DP, doji TT
bulls tried for SC, but failed
poss. TT by loss of momentum (8 consecutive dojis)
daily chart
Yesterday’s bear body acted as a PB
Brs above using the L of it as a HL and their stop placement
1xMM is then the height of Y range 🙂