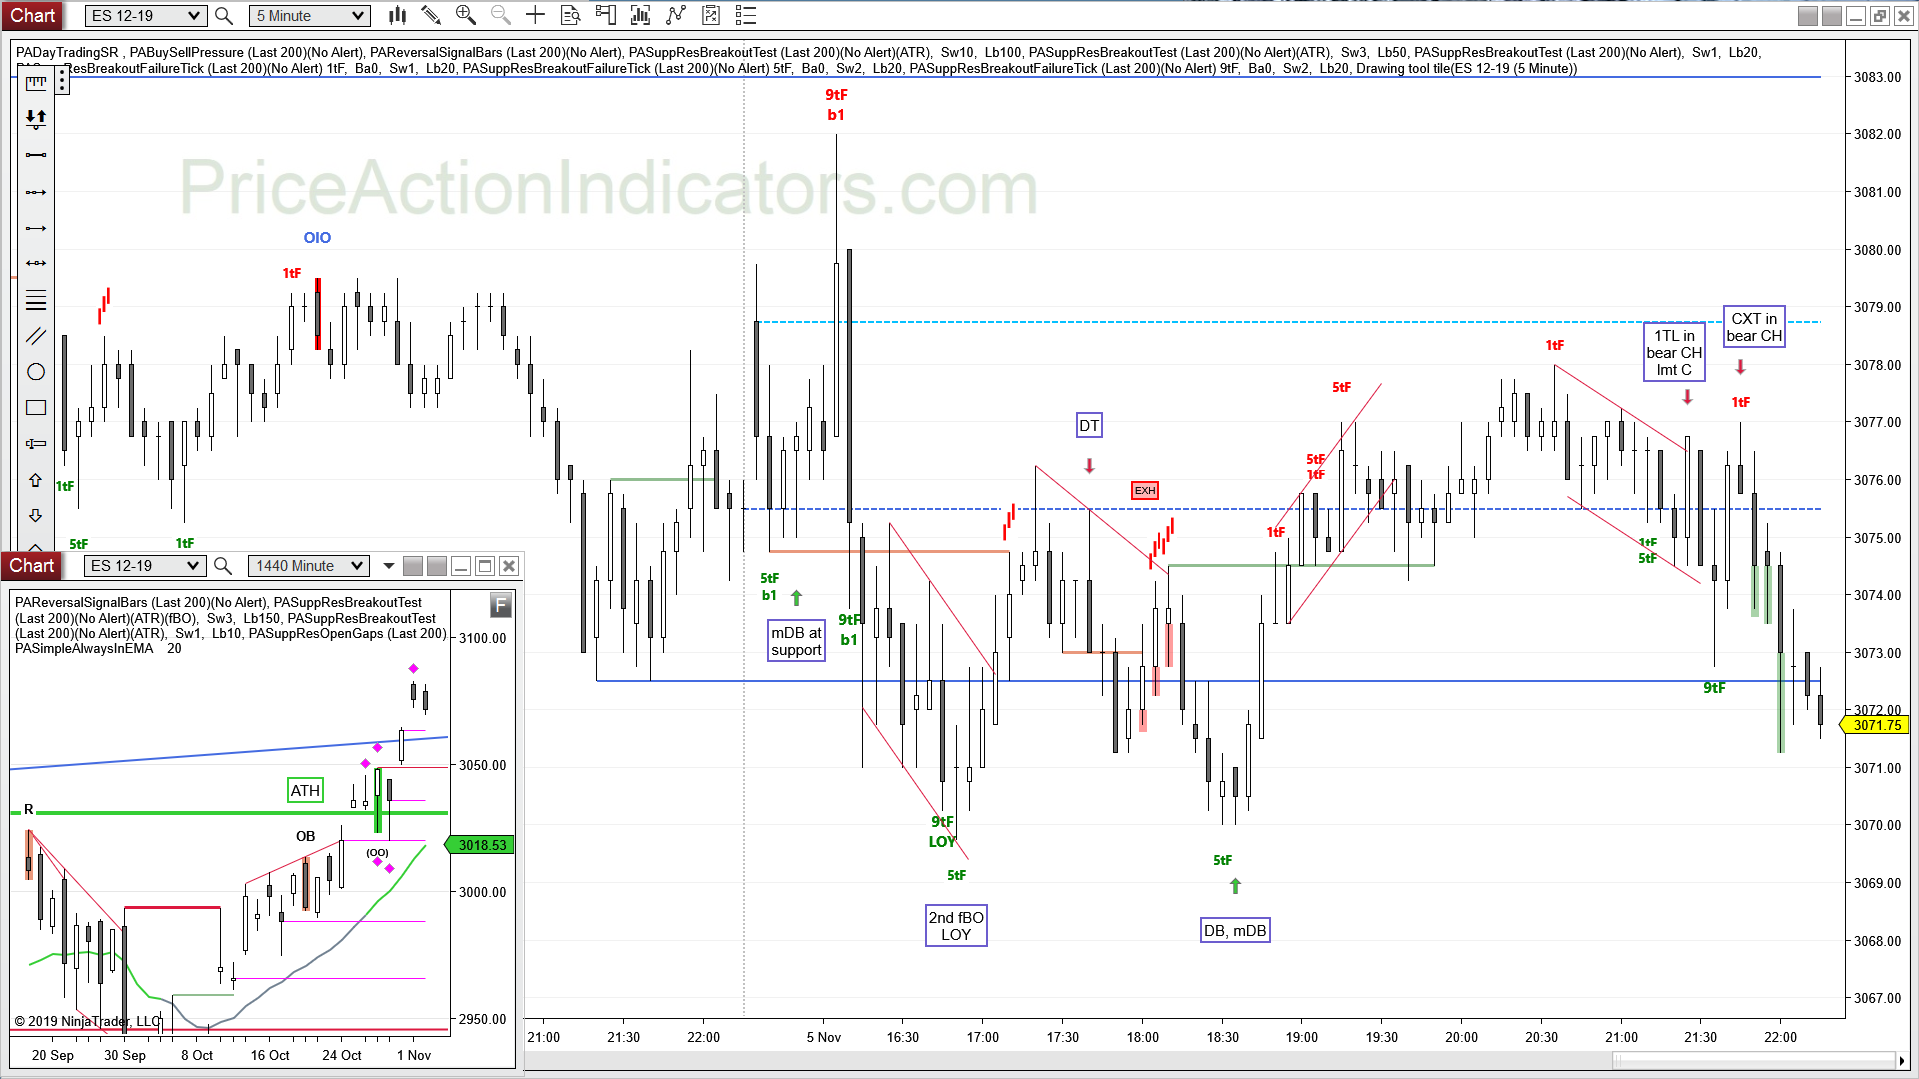
Bull gap, above HOY, mDB, fL2, DT, fBO, LH MTR, fH2, L2
Trading Range day with a late bear BO
Buying Pressure just before a buy Signal Bar (green circle) and Selling Pressure just before a buy Signal Bar (red circle – a hint to wait for a 2E).
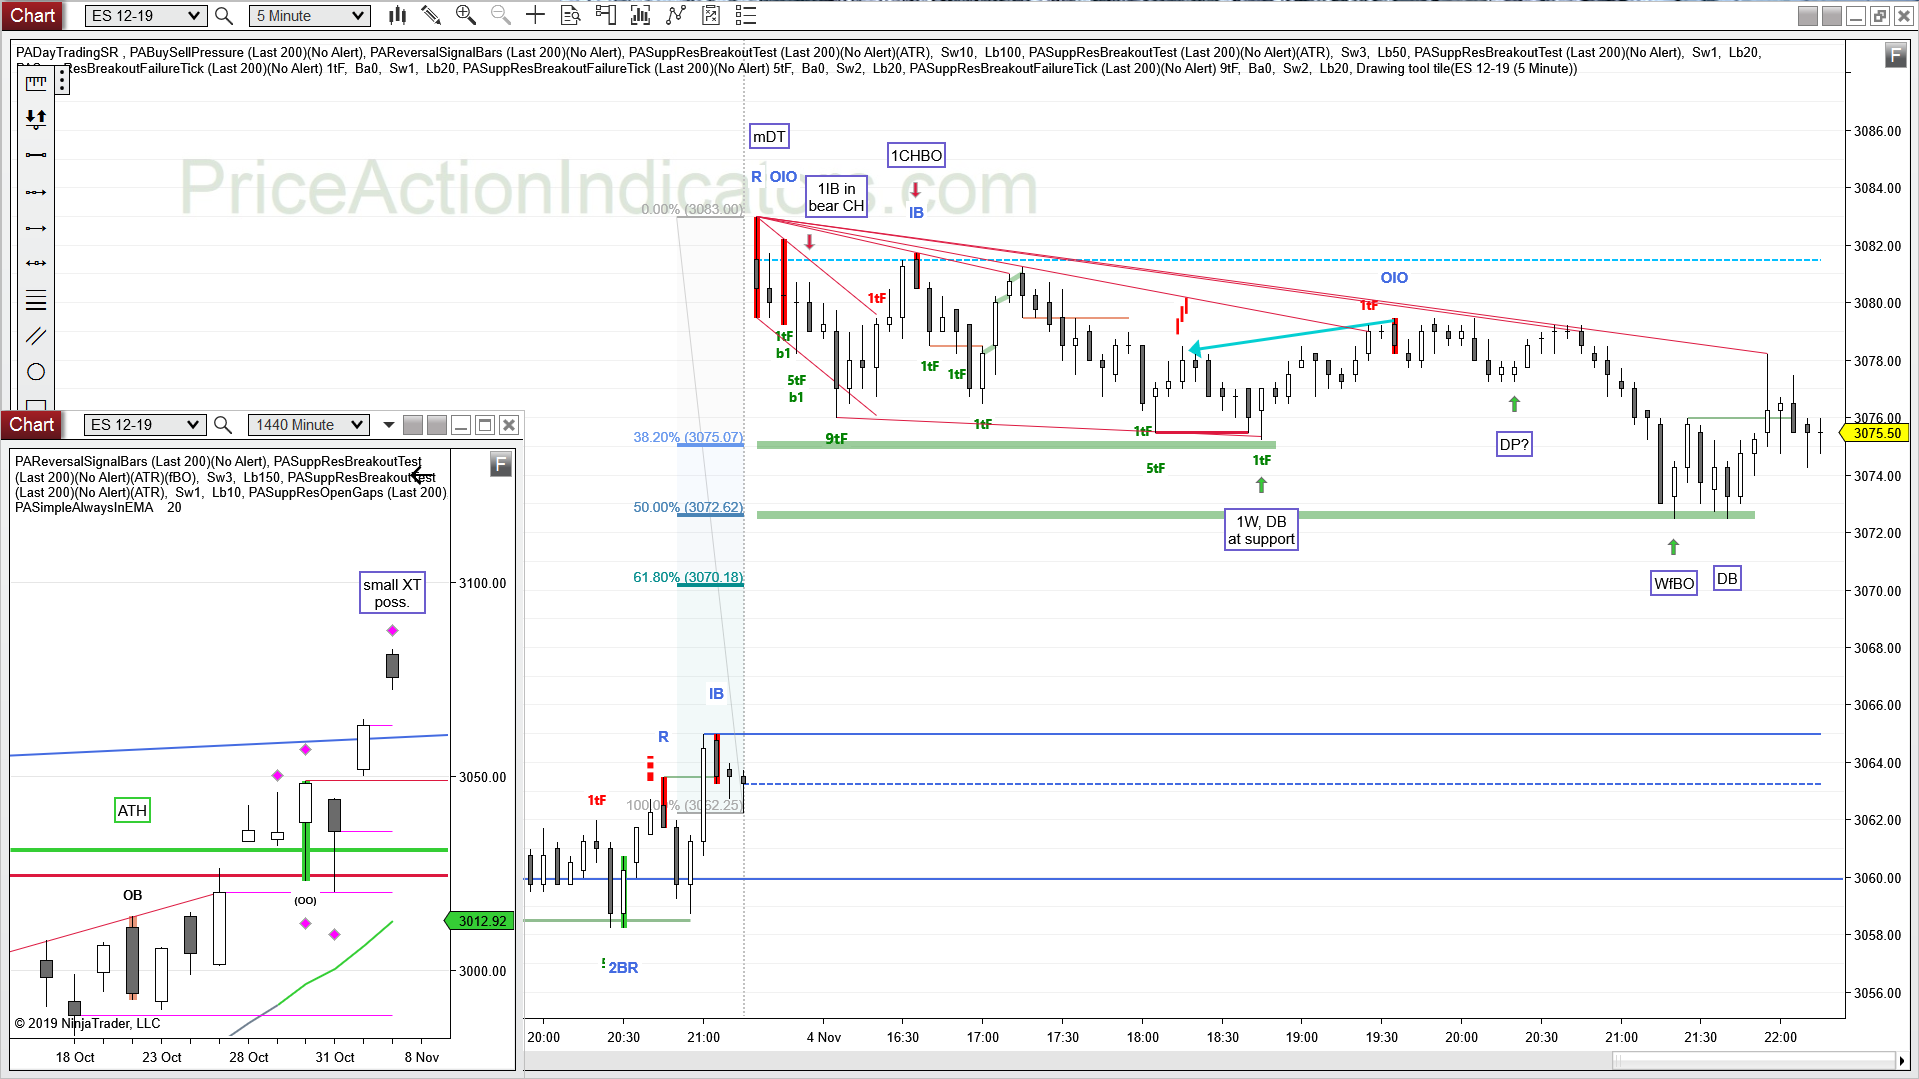
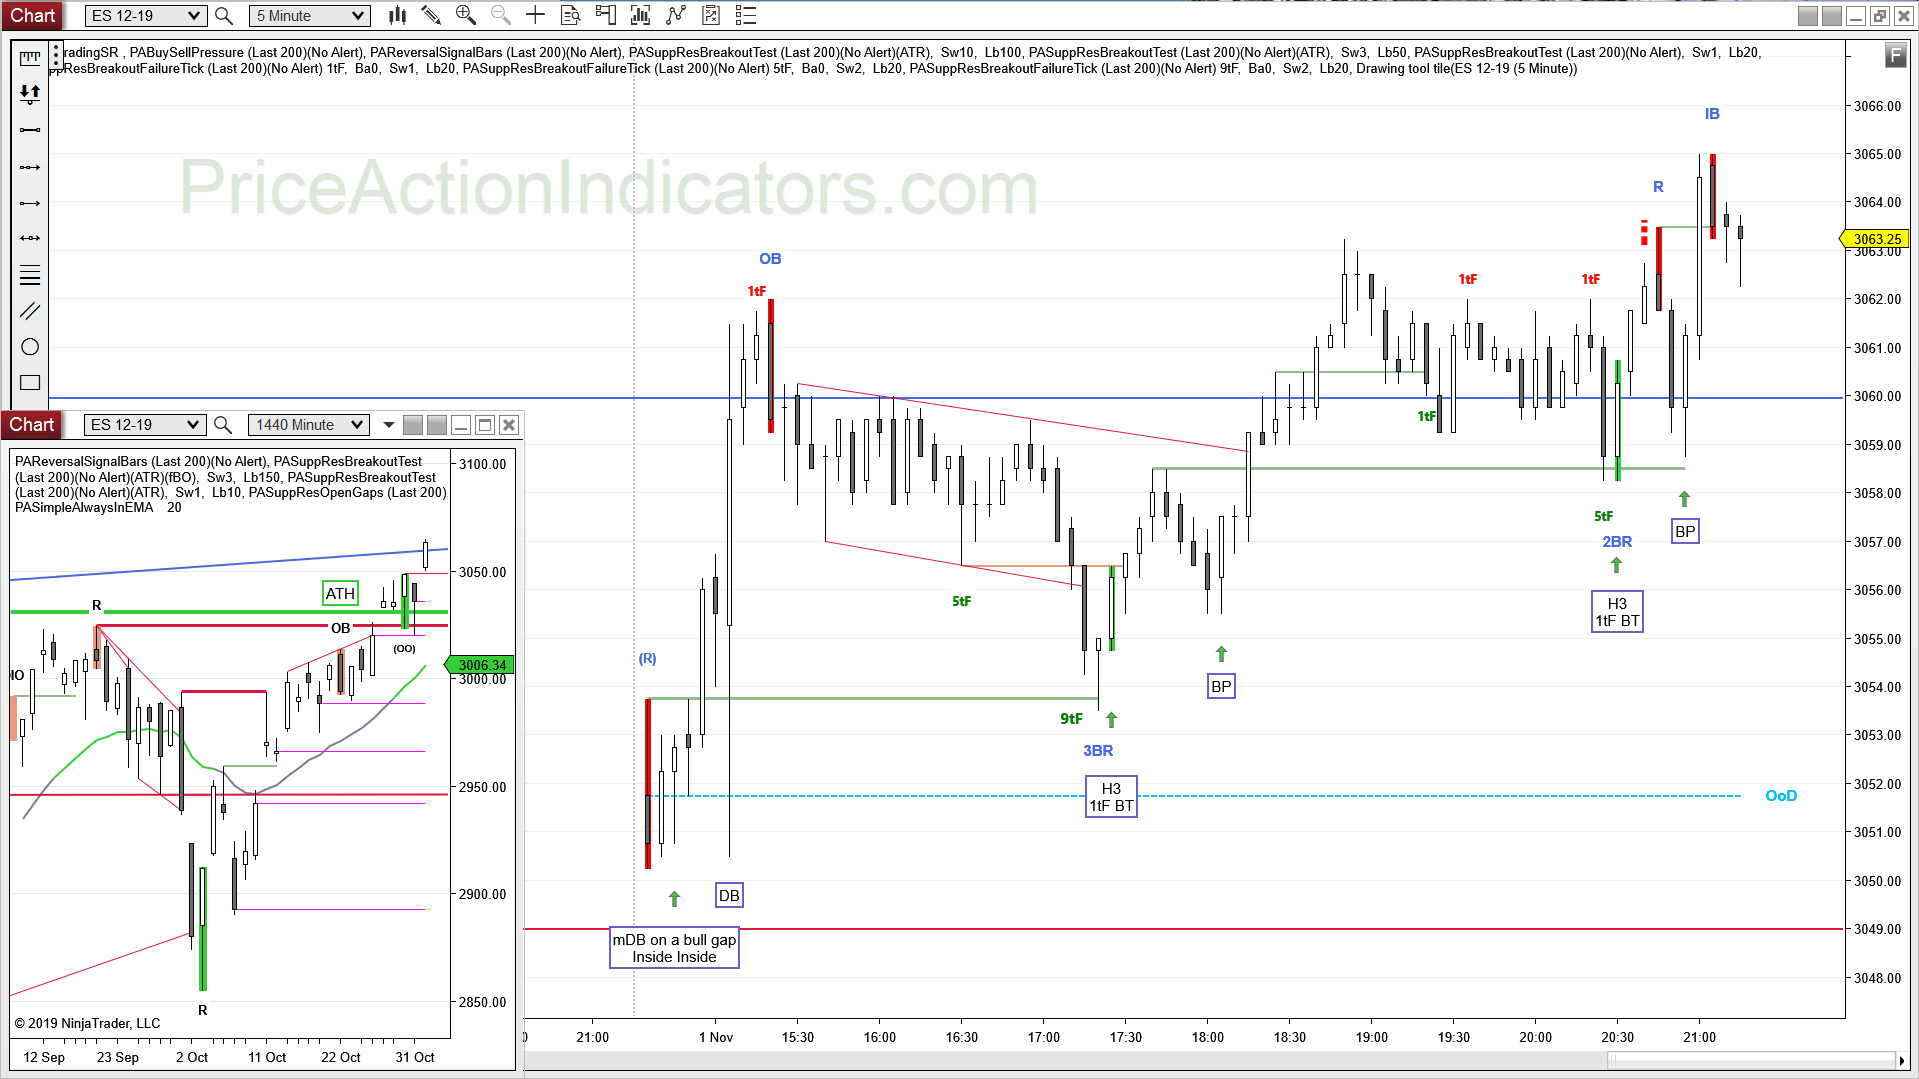
E-mini S&P 500 Future 5 min chart (trend lines, arrows and boxed text drawn by hand)
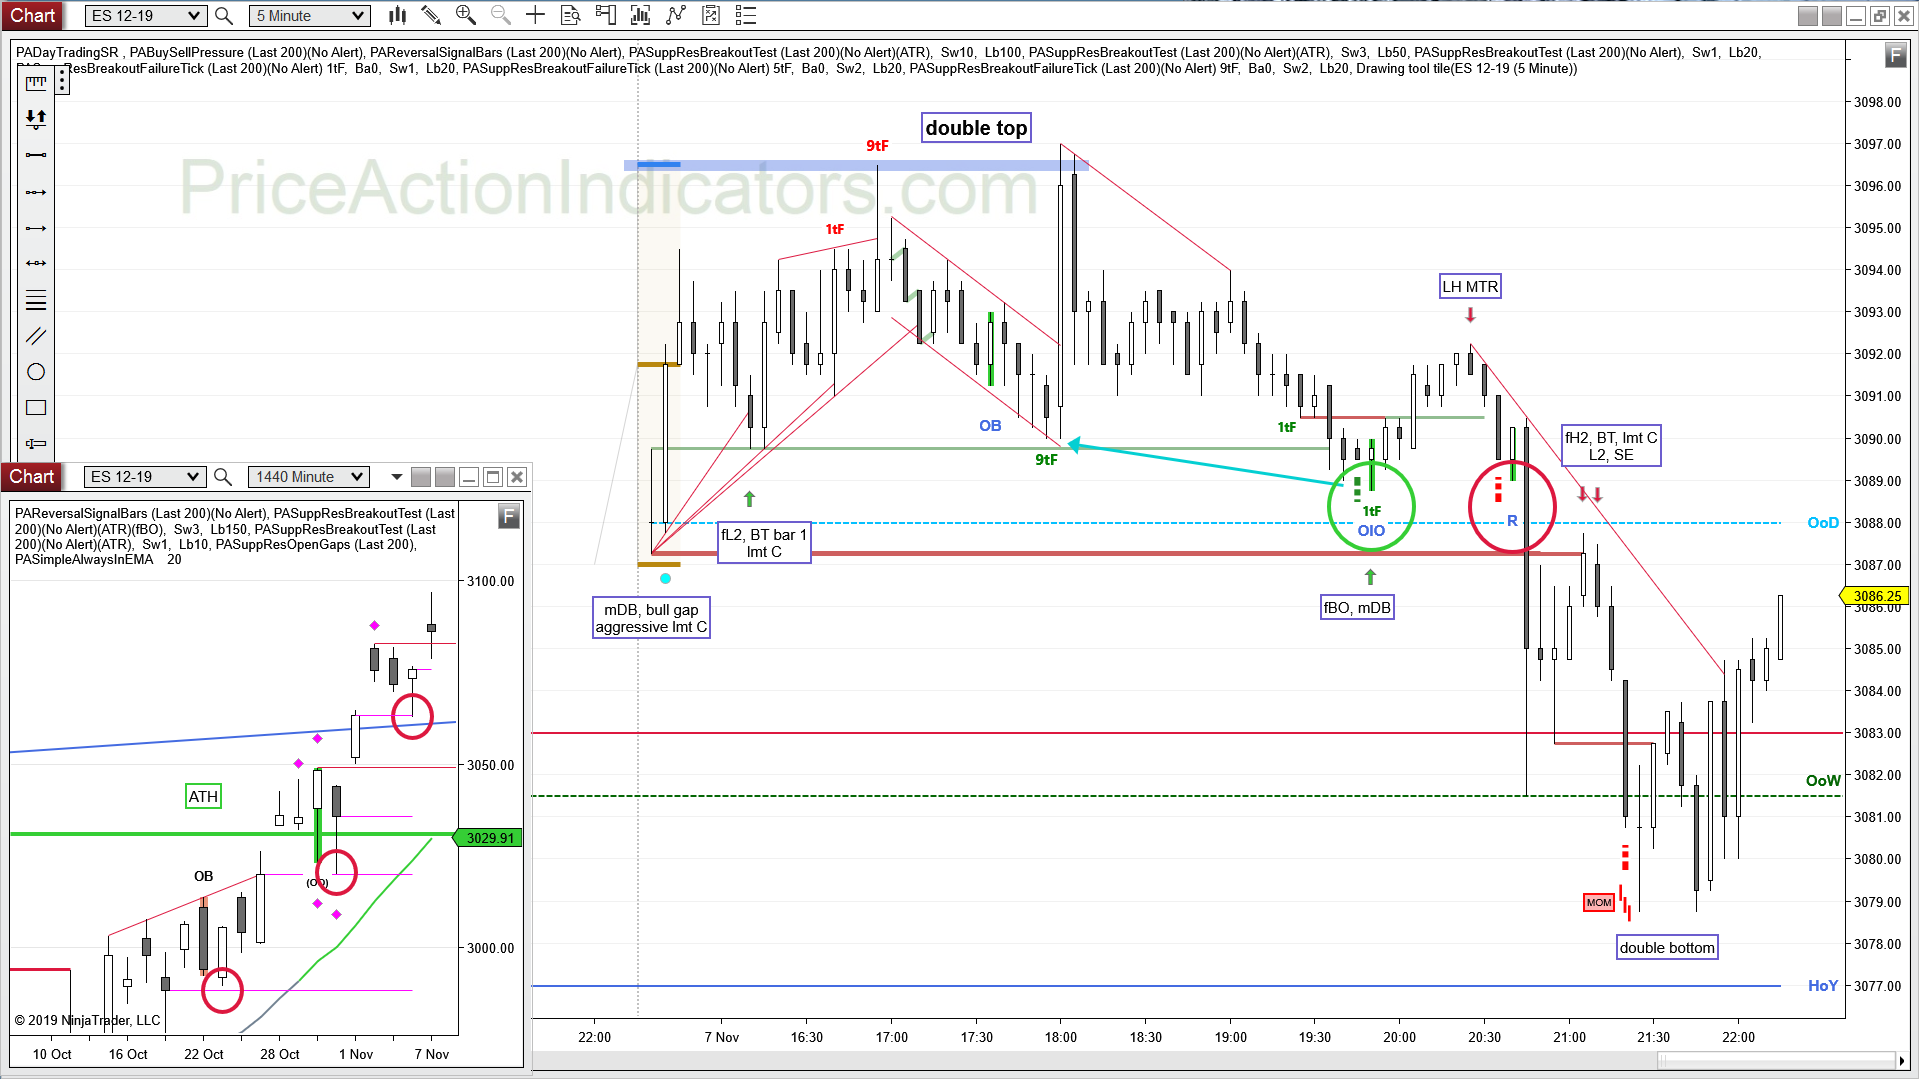
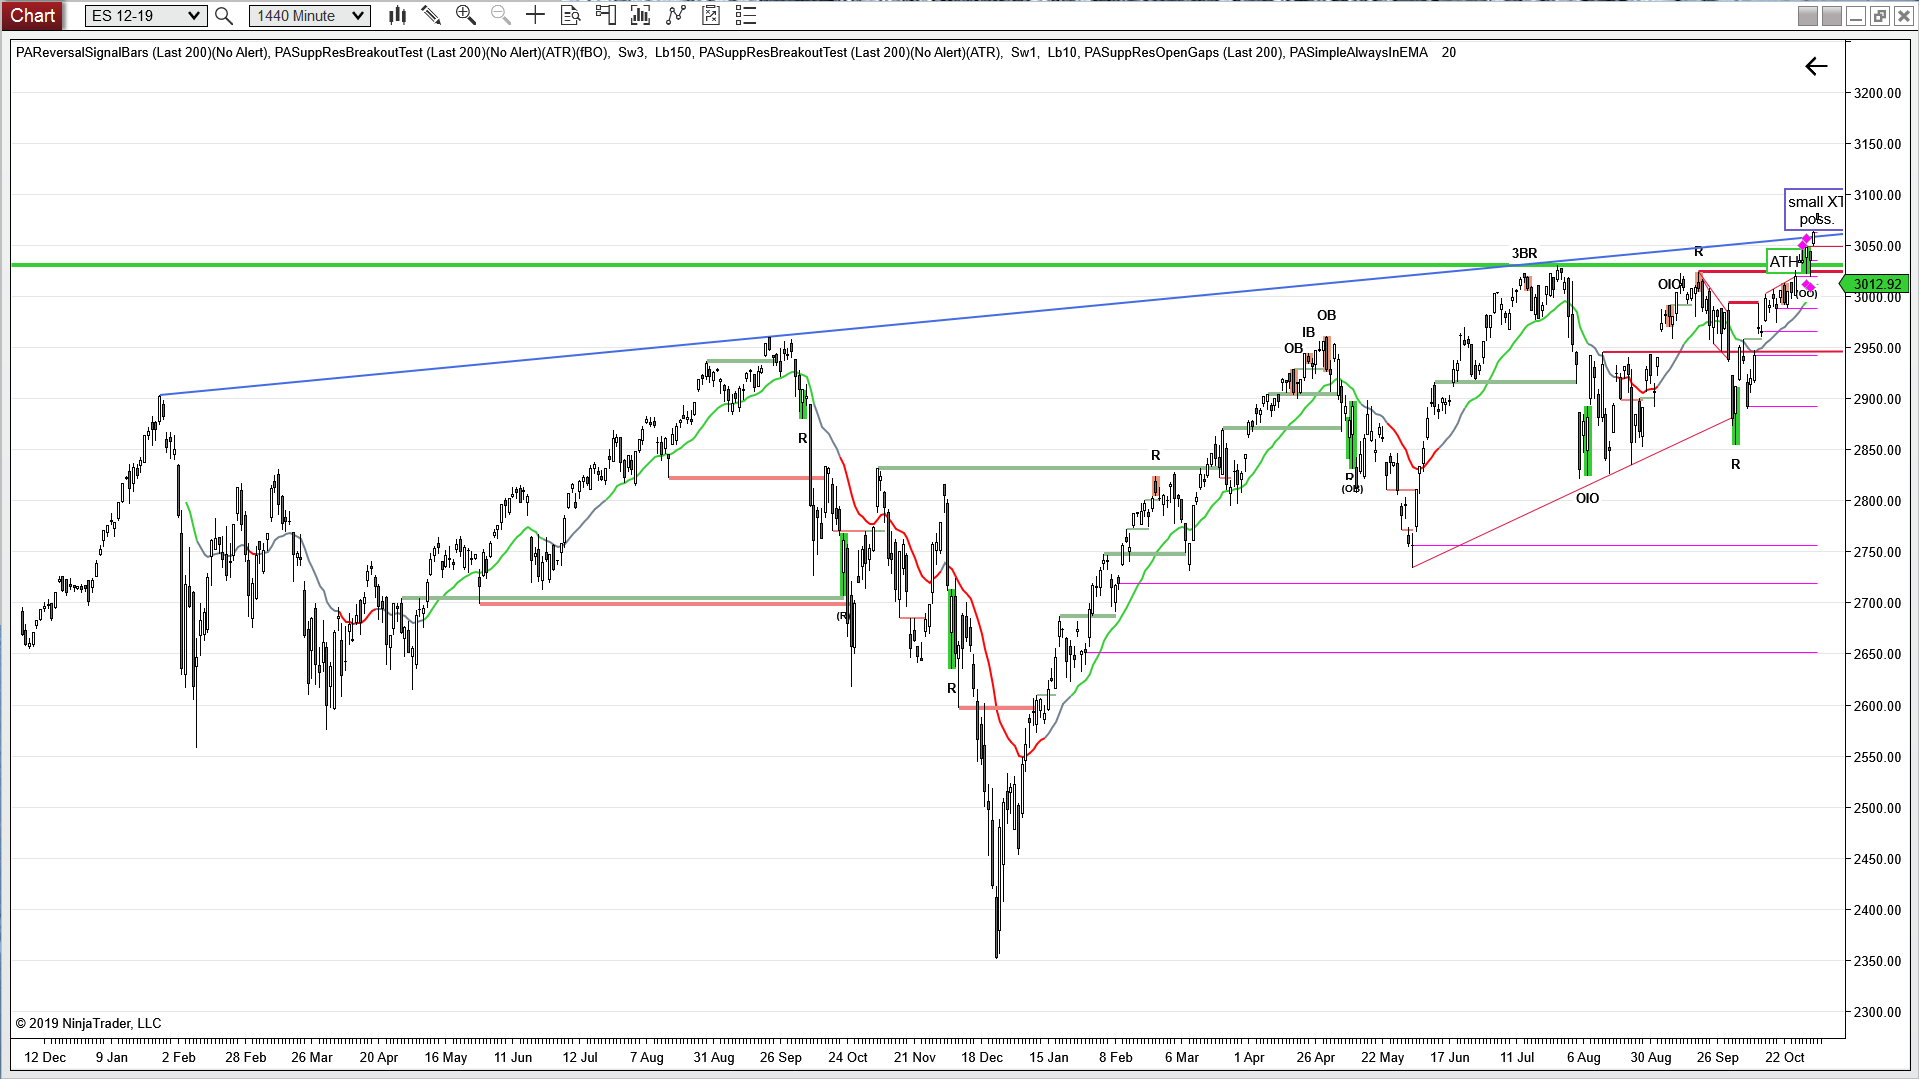
daily chart
Always In Long (AIL) since 10/10
a weak Reversal Signal Bar for the bears