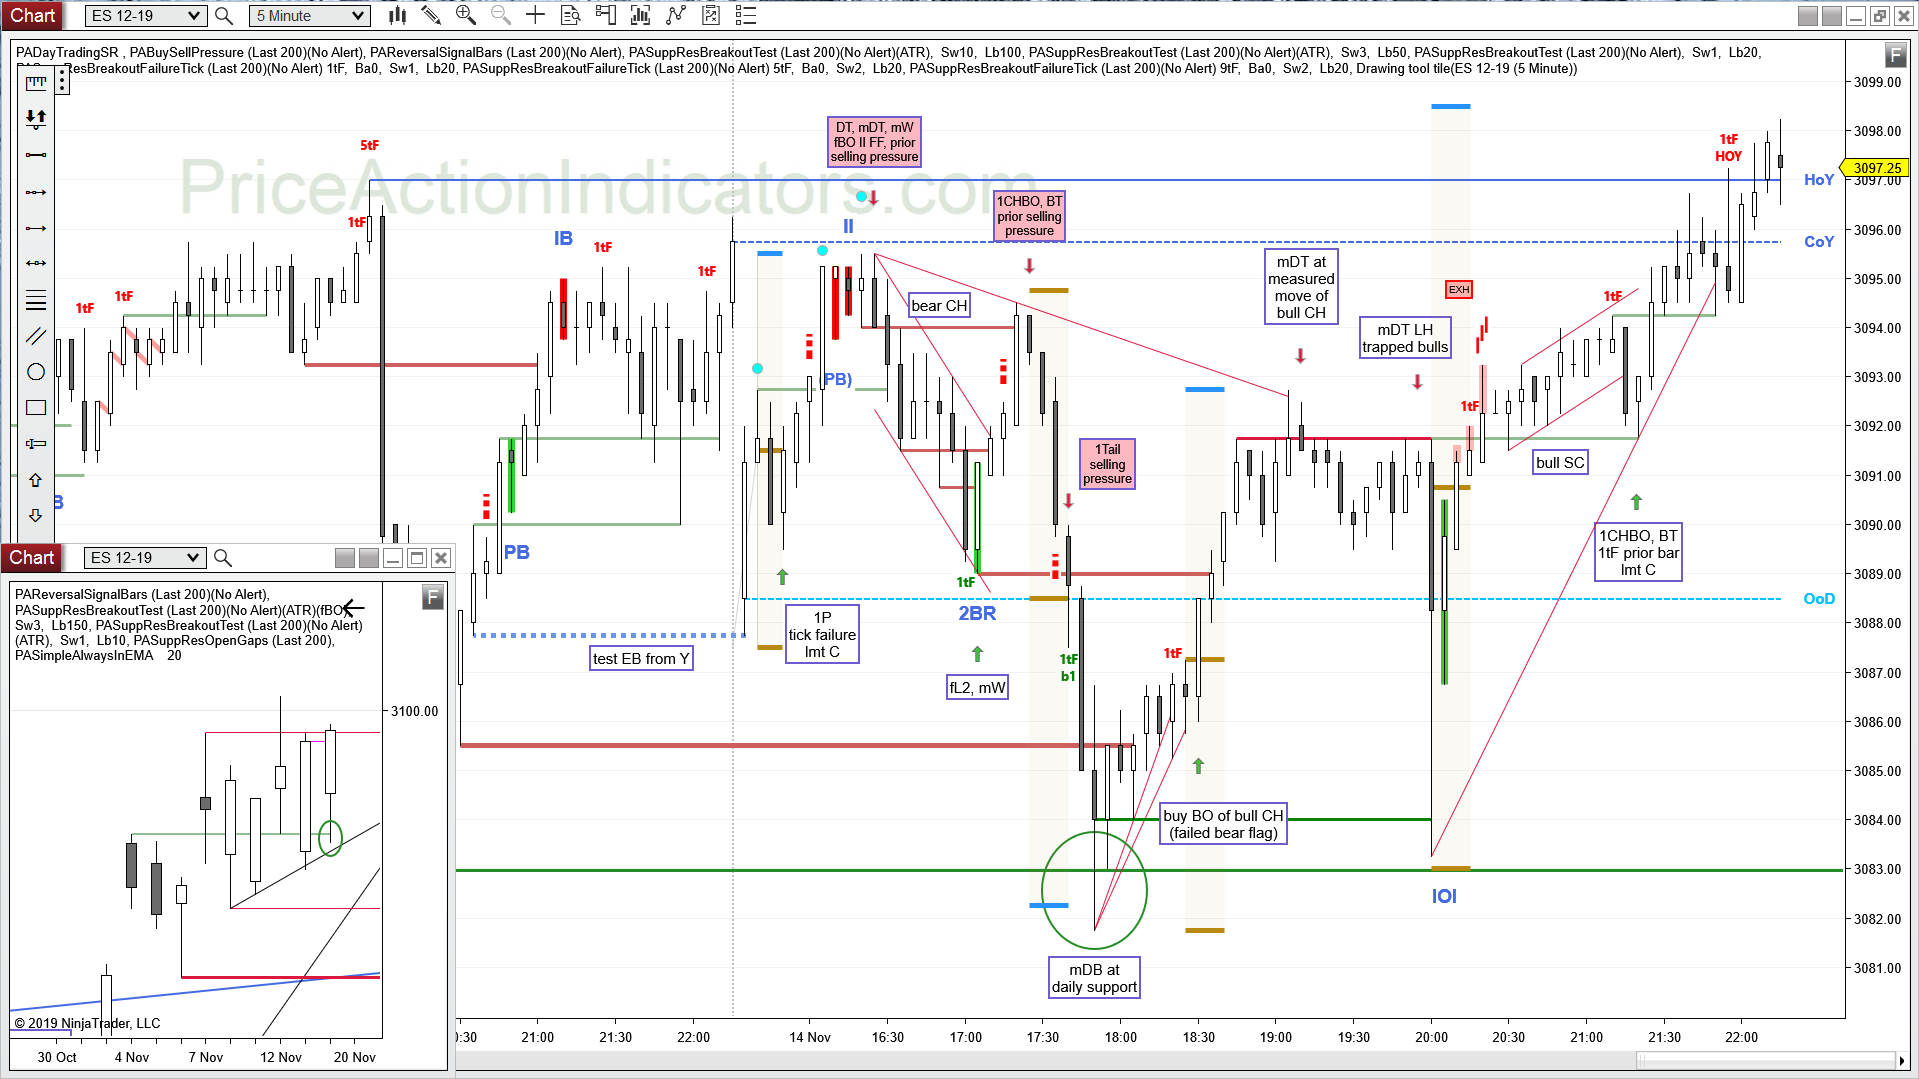
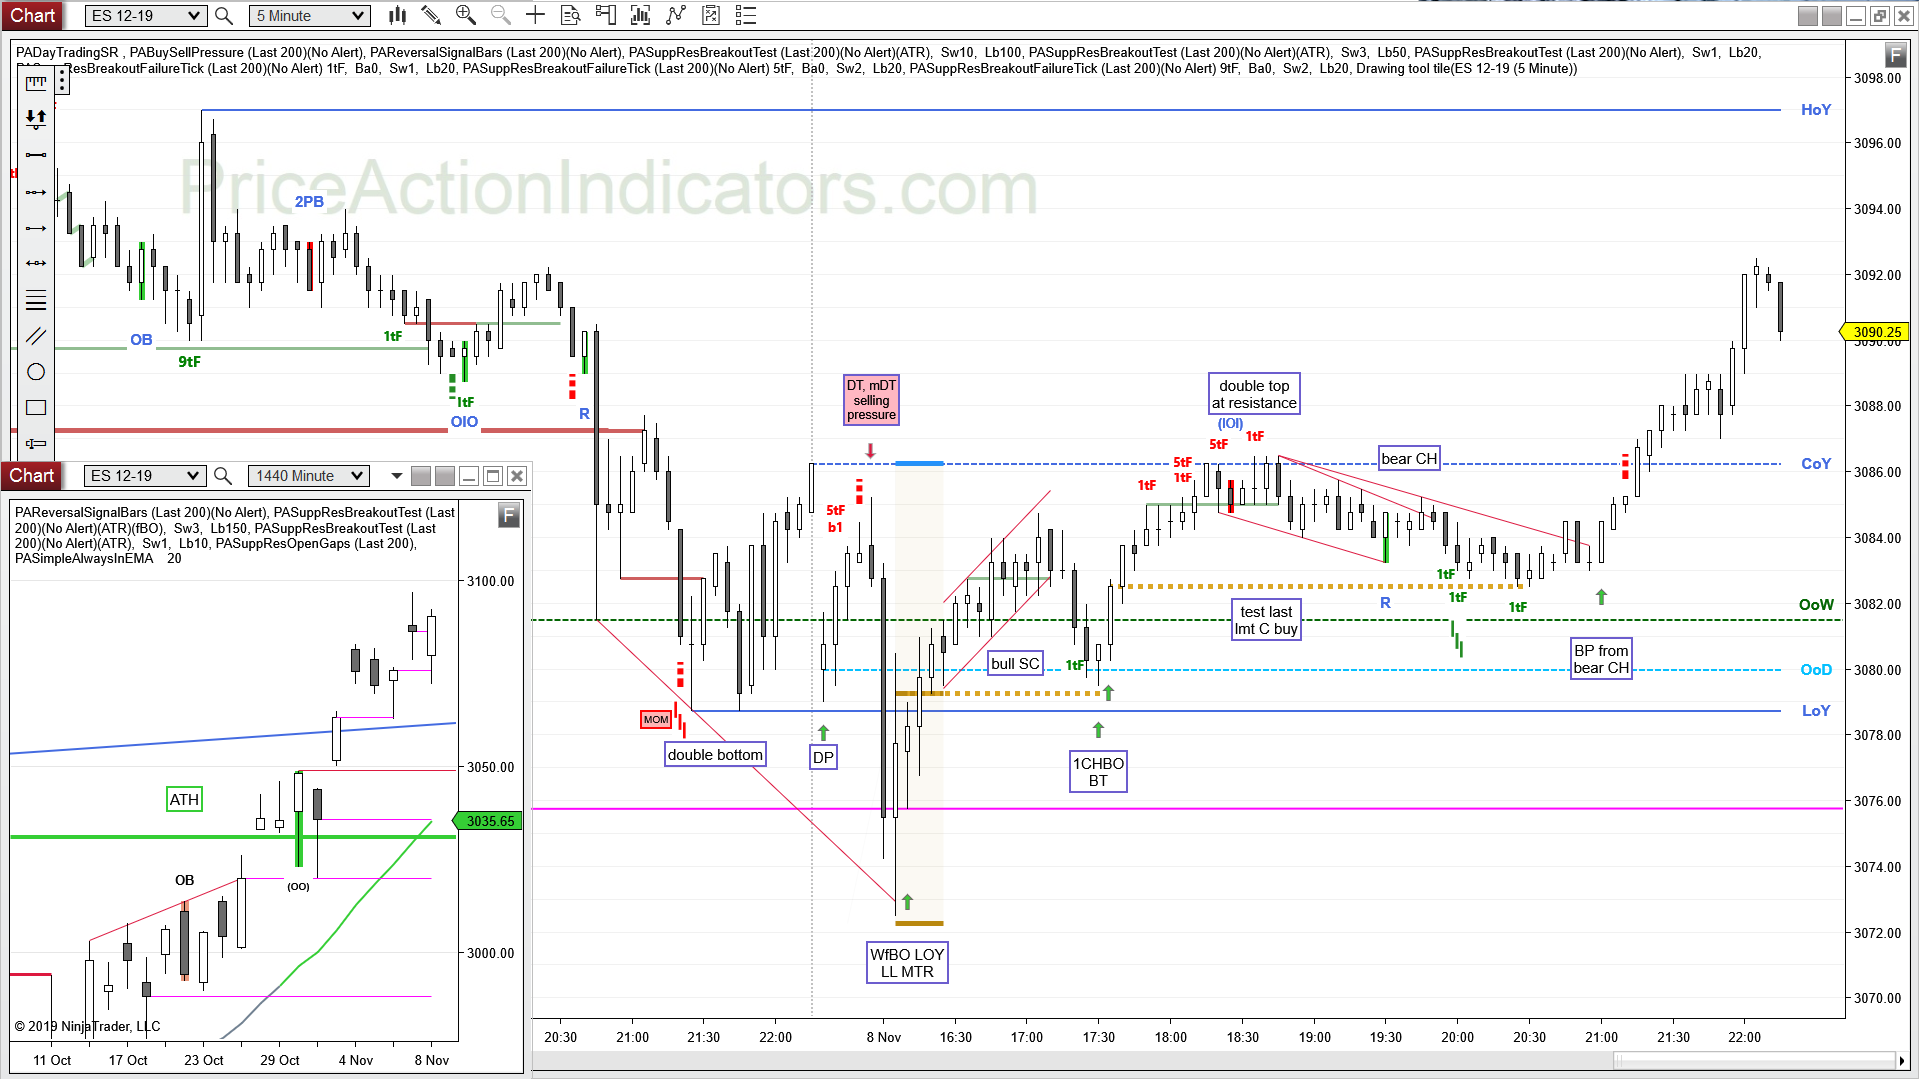
Bear gap, mid range, WfBO, 1P, L2, H2, BP, fBO, mDB
The 1st bar of the day is a large RVB, but the large body (60%) gives it a taste of a large trend bar or TR/CX as well. The risk to buy on a SE above was also more than 6 points. It’s better to wait for a 2E, which came with the 1P a couple of bars later (it was also a test of the OOD).
I didn’t take the L2 short on b11 (despite the shrinking bodies – selling pressure), as I expected the market to go at least to COY. Also after a WfBO LOY I expect a fL2 and at least two pushes up from a decent 1P.
The large OO (the fL2) trapped a lot of bears, which probably tried to scale-in above the L2. We formed a bear RVB after the OO (a poss. L3 and DT with yesterday’s last swing), but that didn’t trigger short, instead it triggered long 1st, which makes it a small TR (SA and BB). More up to COY (magnet).
I also marked up a couple of bull signal bars and the targets based on the initial risk for a possible SE and a bar stop below.
E-mini S&P 500 Future 5 min chart (trend lines, arrows and boxed text drawn by hand)
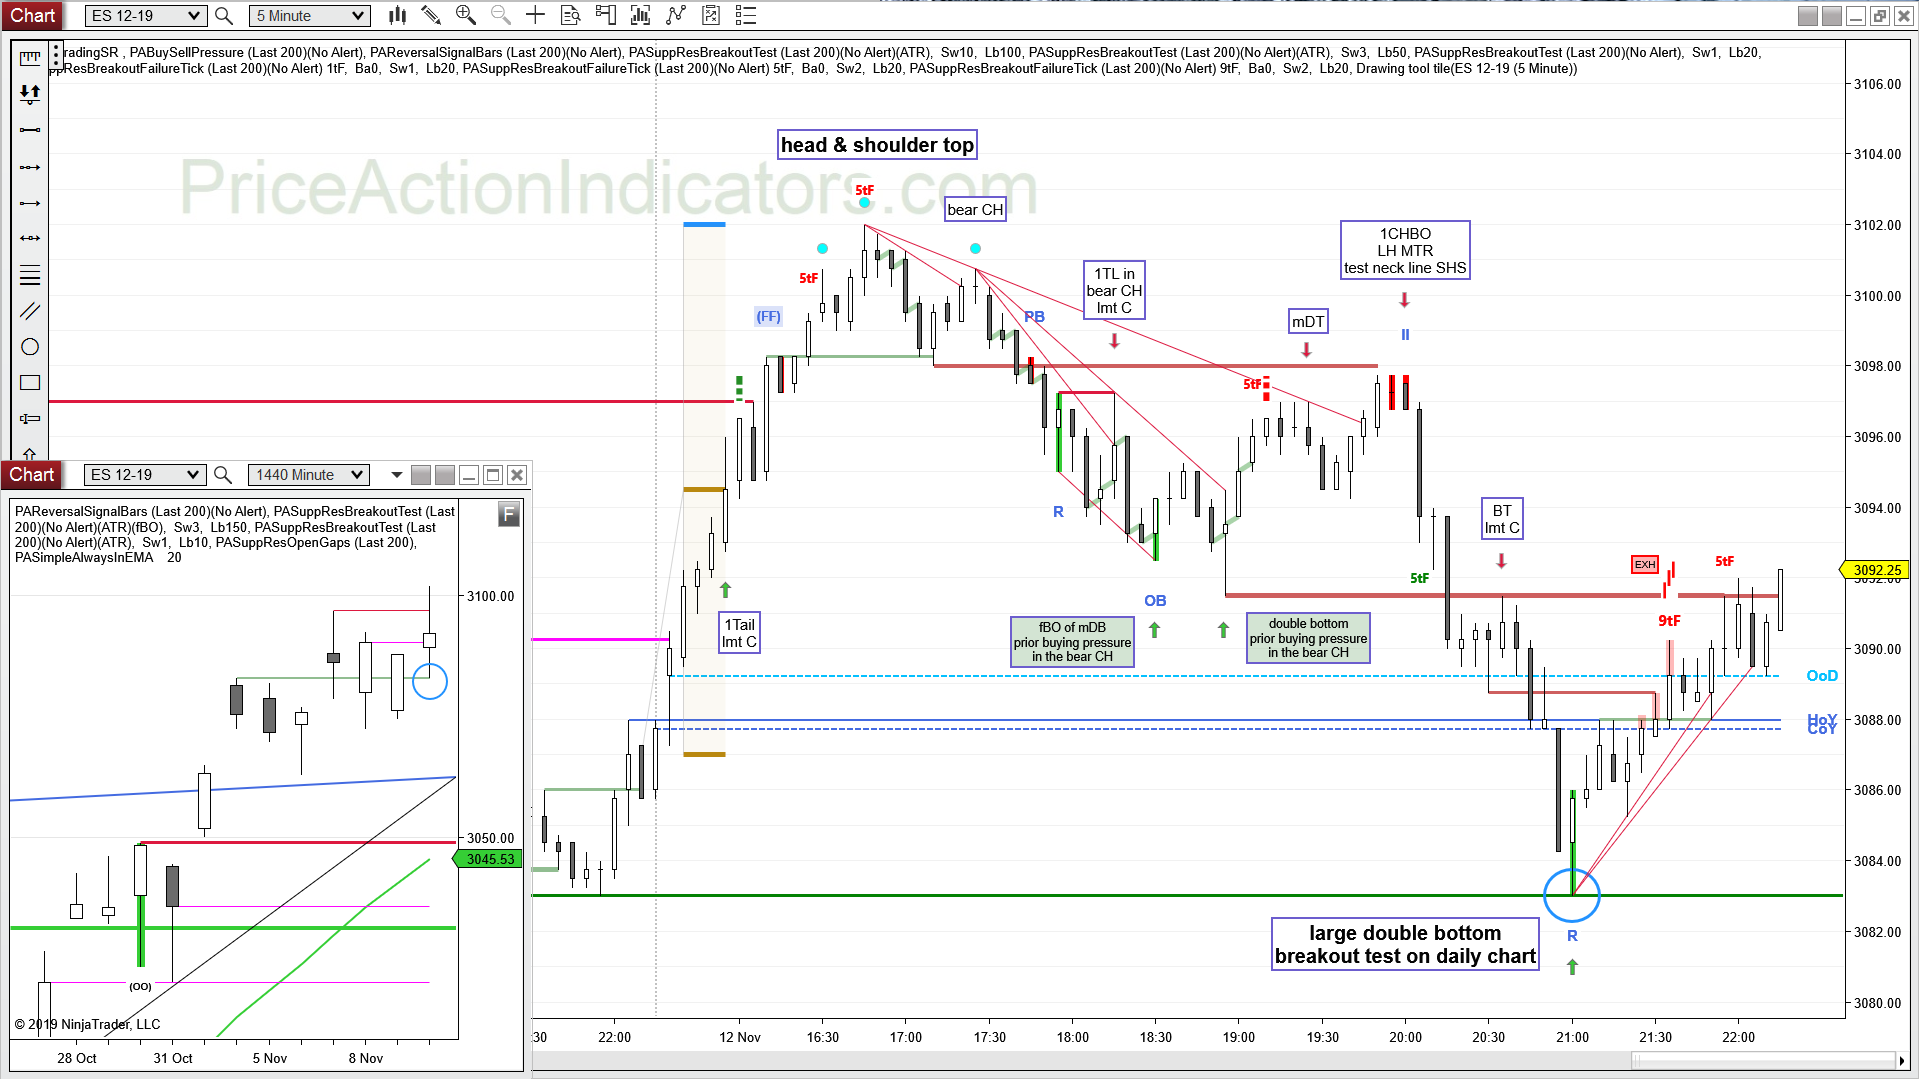
daily chart
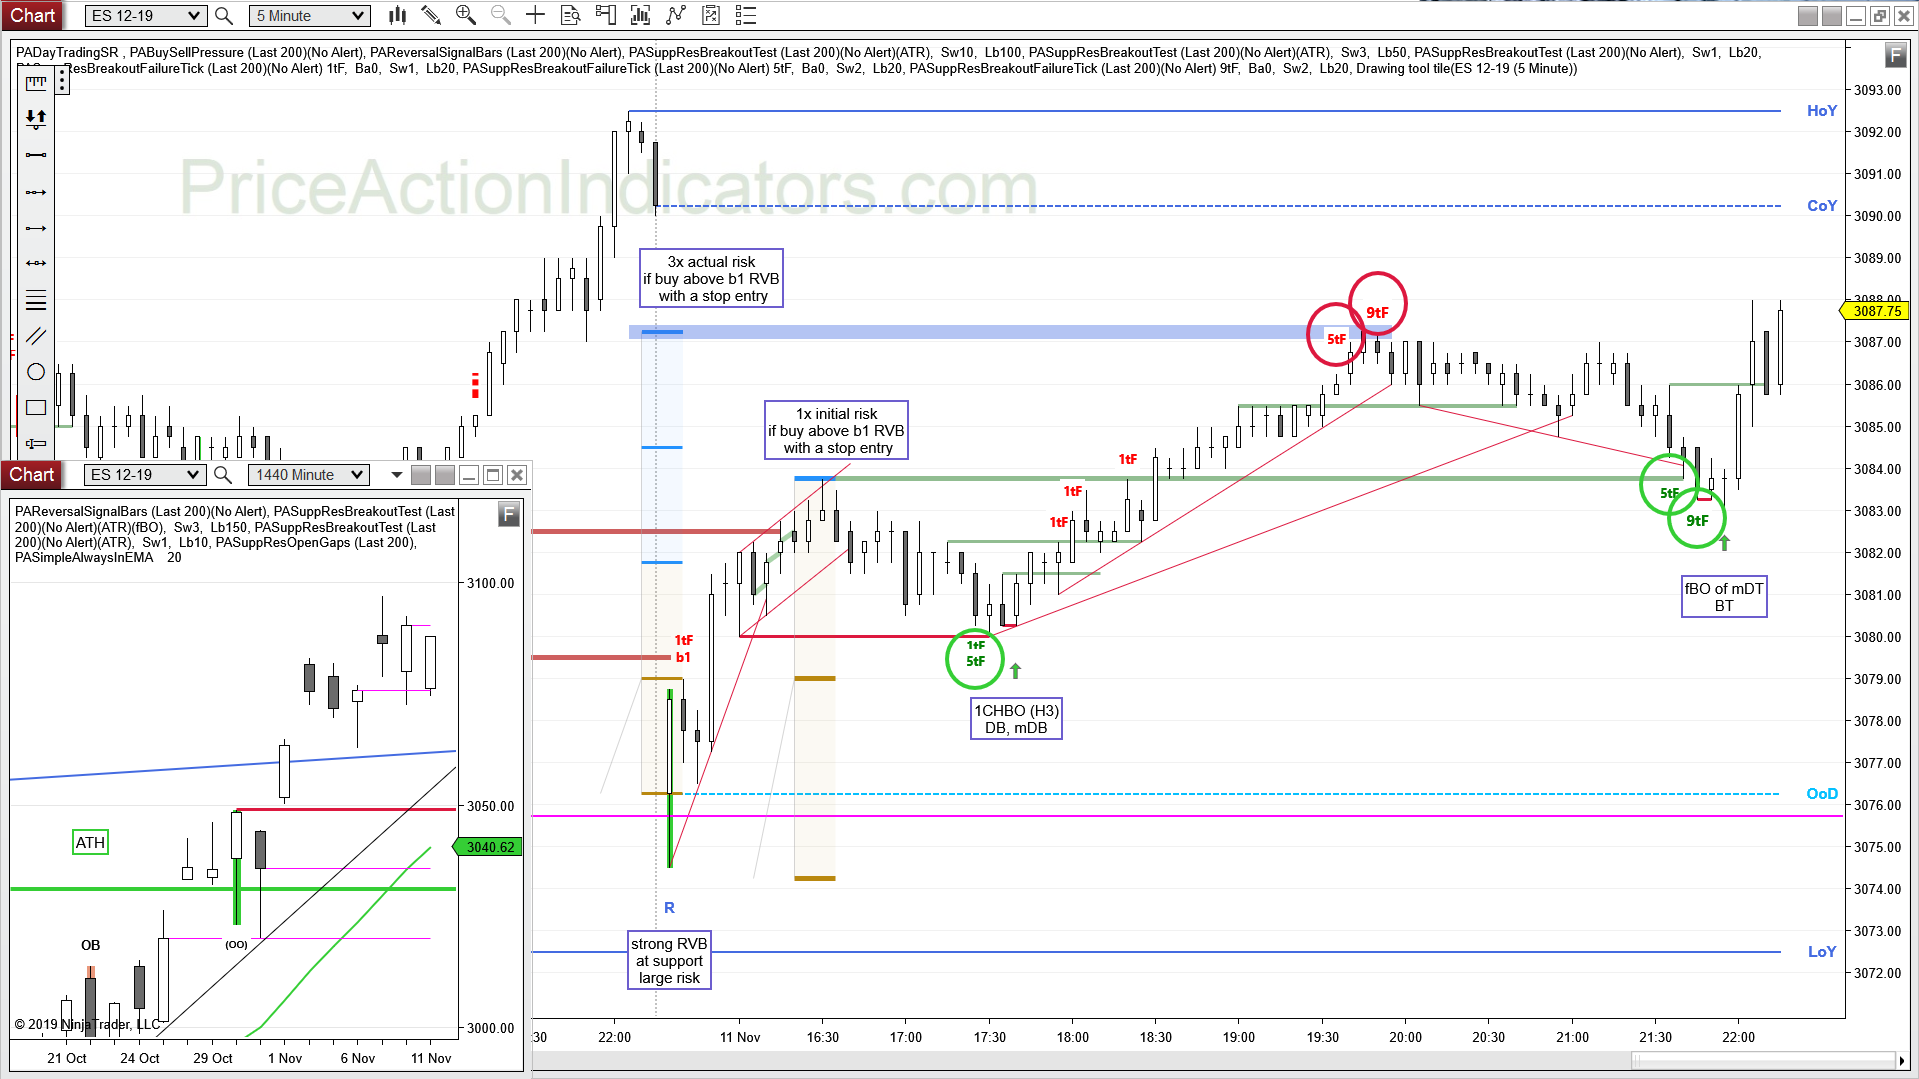
Always In Long (AIL) since 10/10
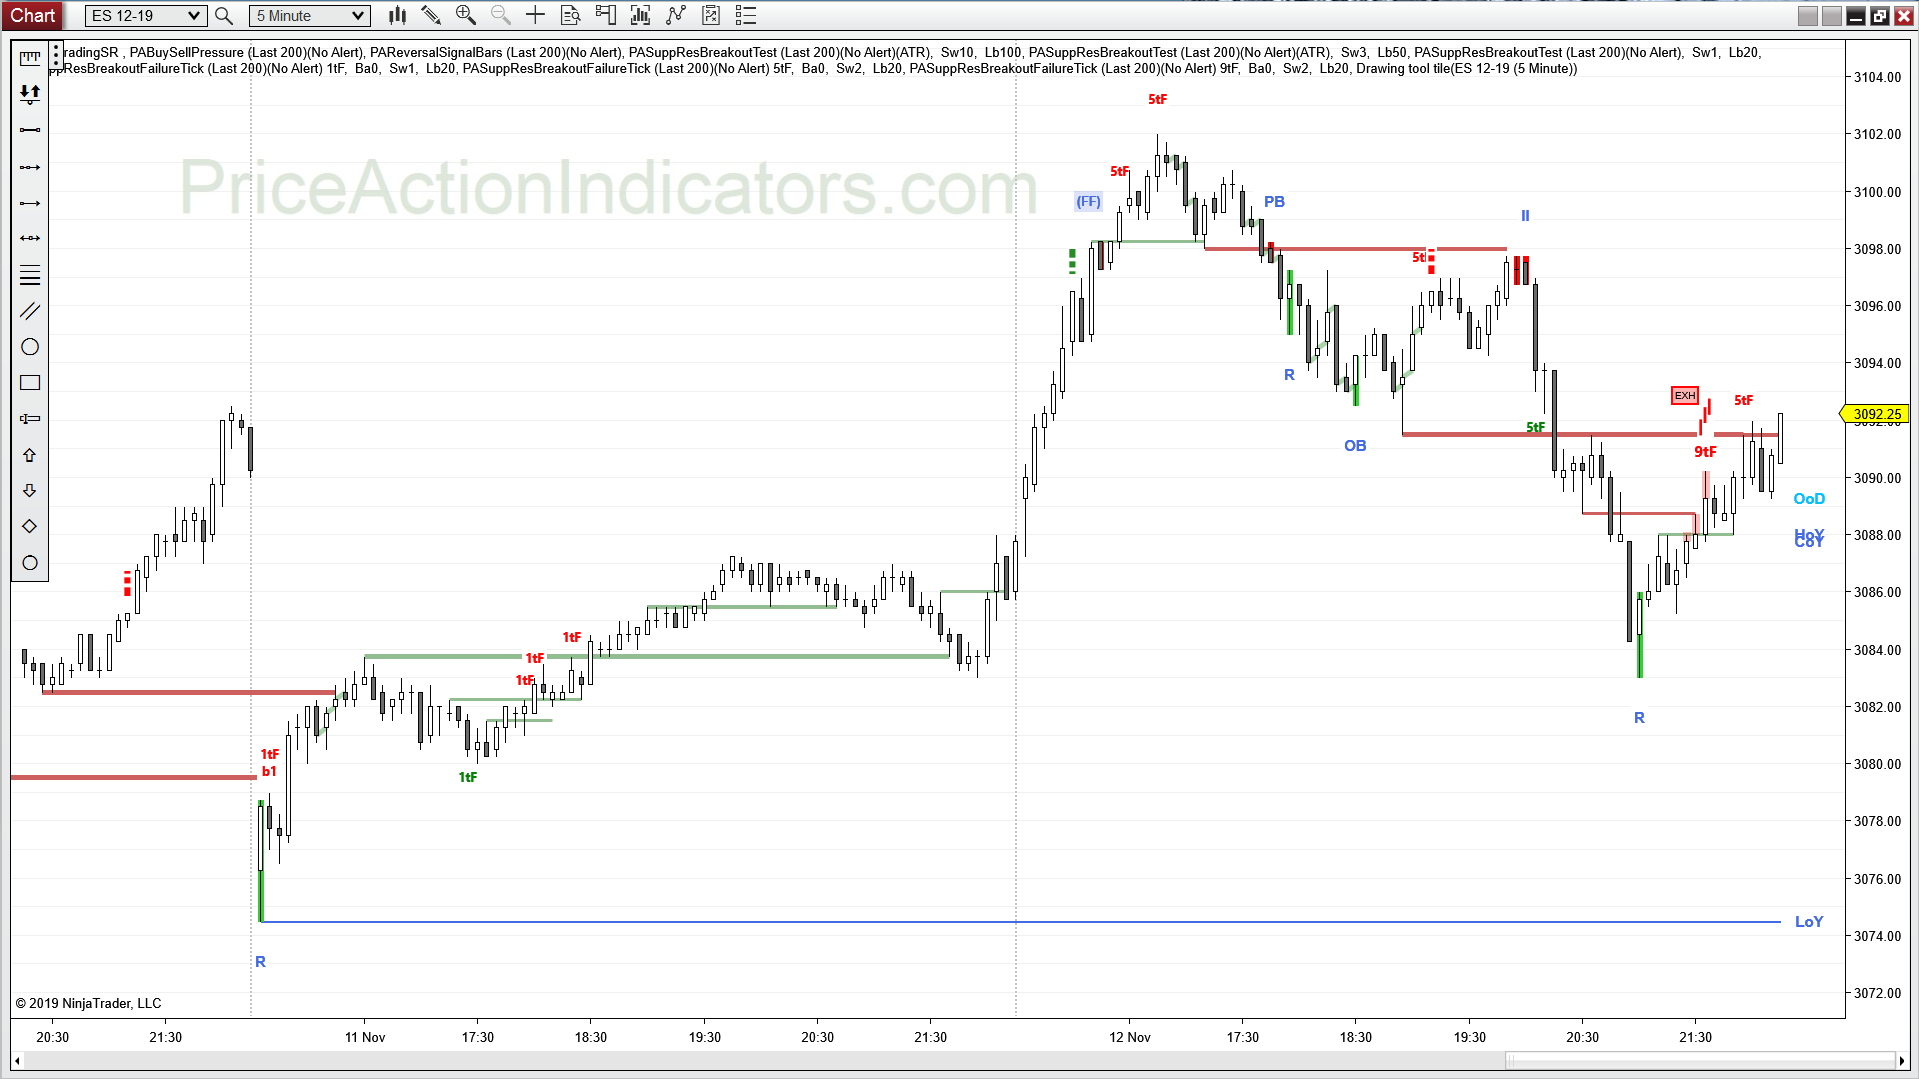
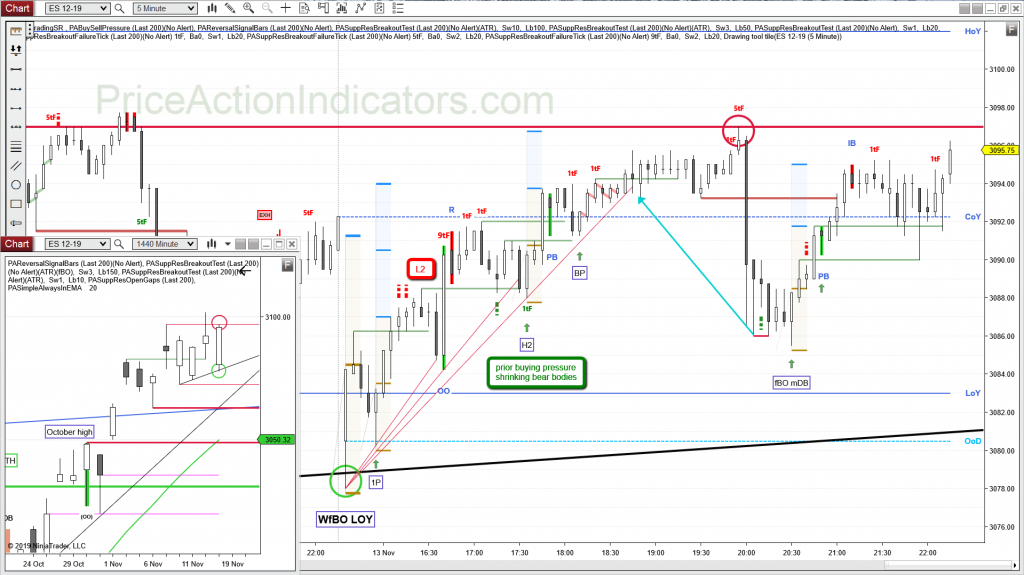
another test of 3100 and another H1 buy
some bears might see a head & shoulder top with the high of last week
Continue reading “E-mini ES 2019/11/13”