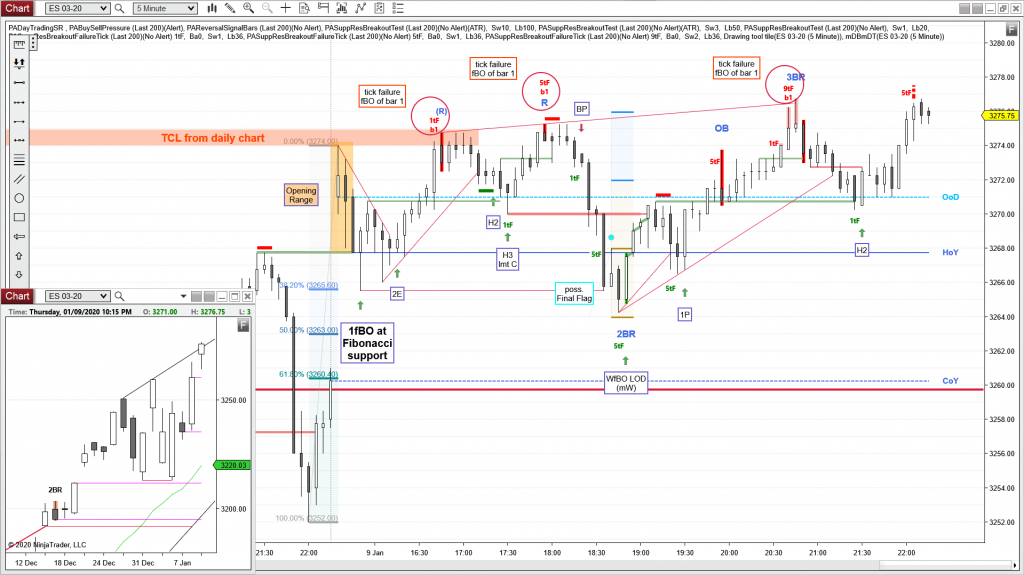
Bull gap, above HOY, Opening Range, 1fBO, 2E, H2, H3, FF, WfBO, 1P
Every new high of the day was a Tick Failure Breakout (red circles) of the Opening Range. Use the Support and Resistance – Breakout Failure Tick indicator to show that.
Sellers all day at the TCL from the daily chart, but we closed above at the end of the day.
E-mini S&P 500 Future 5 min chart (trend lines, arrows and boxed text drawn by hand)
daily chart
Always In Long (AIL) since 12/06
Follow Through for yesterday’s Breakout Bar
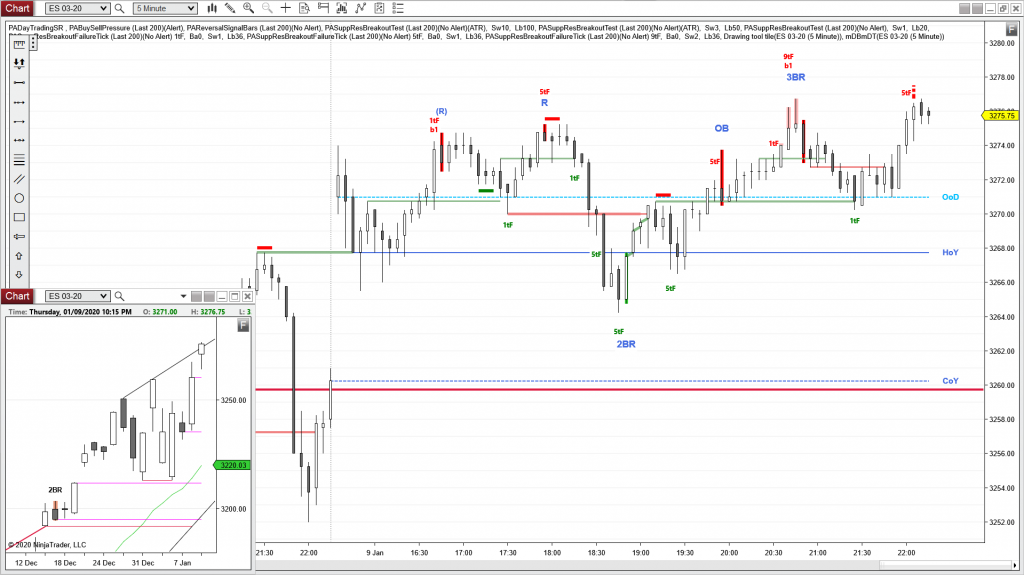
Here is the “naked” version of today’s chart, with just the indicators applied.


