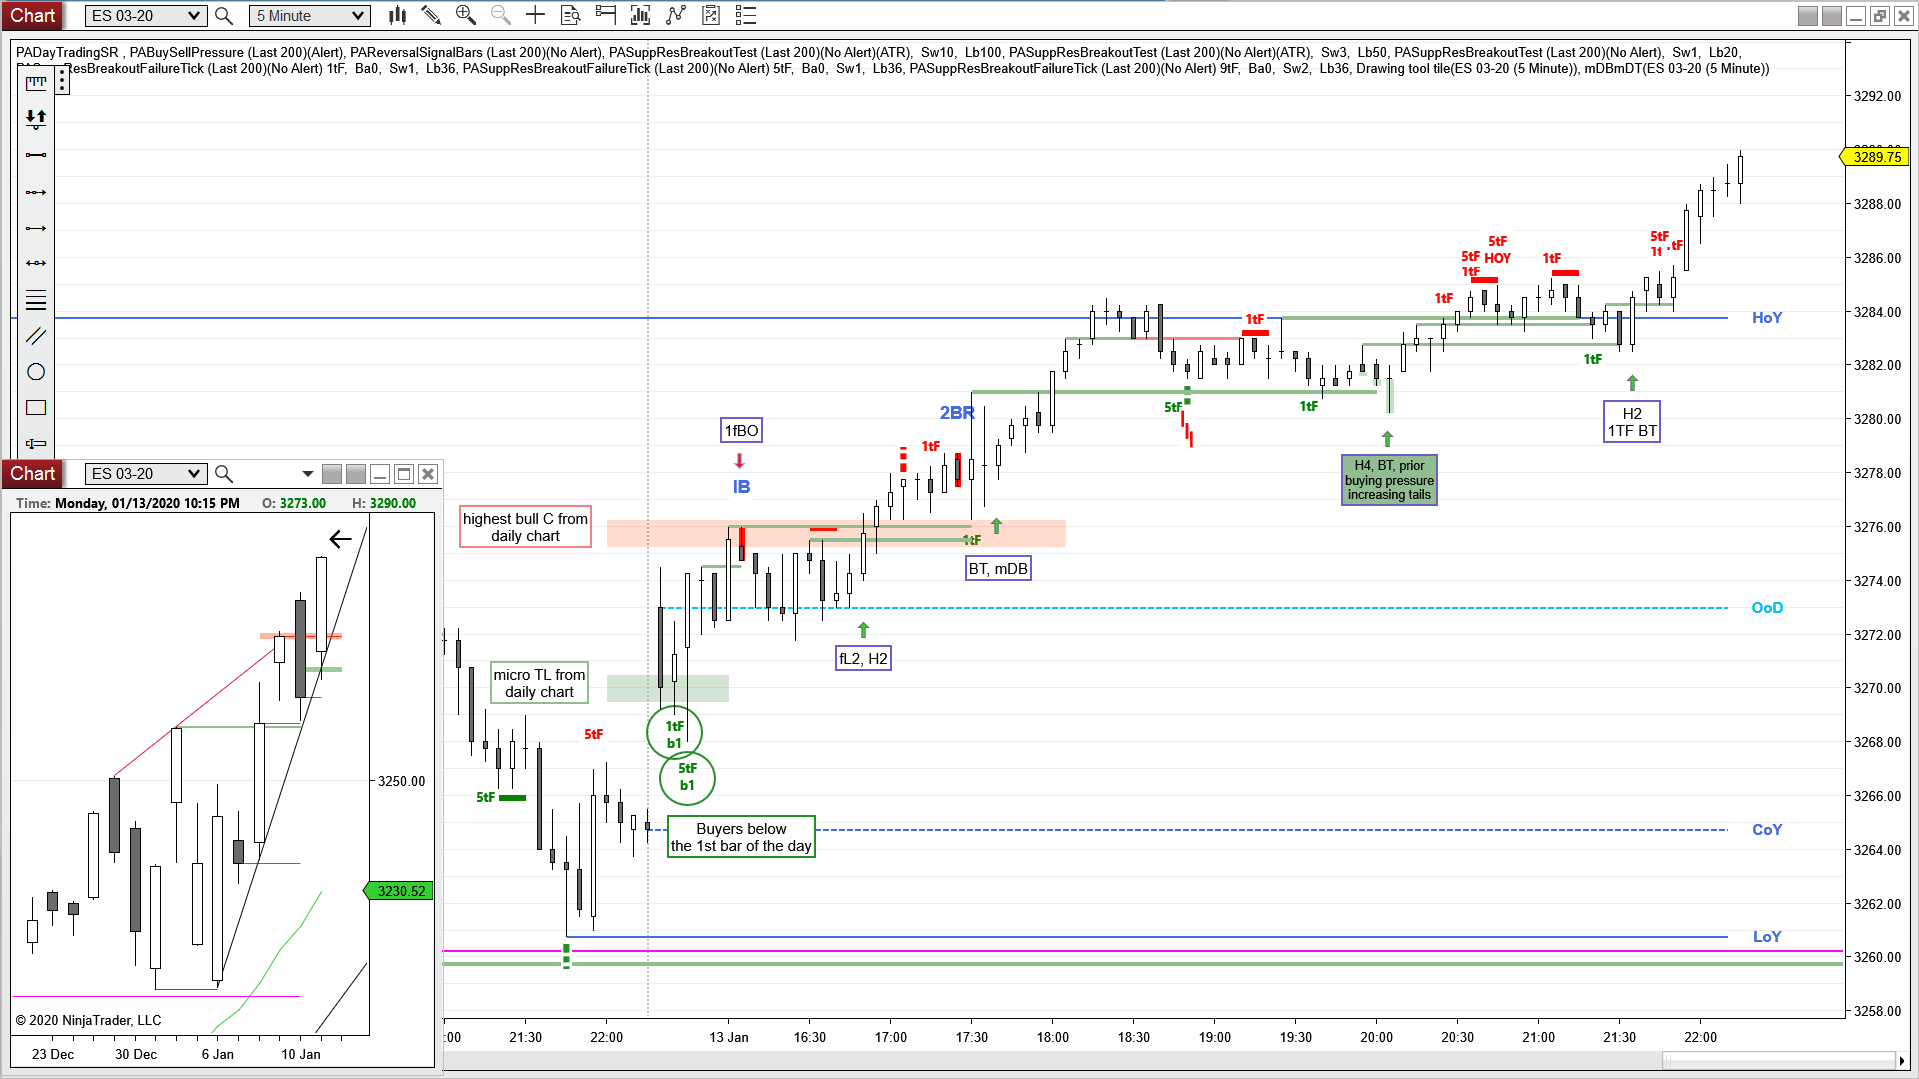
Bull gap, mid range, Opening Range, 1fBO, fL2, H2, BT, mDB, H4, 1tF BT
Some nice reactions at the S/R from the daily chart. Once we broke above the highest daily bull close (light pink area), that became support and we got a bull tend into the close.
E-mini S&P 500 Future 5 min chart (trend lines, arrows and boxed text drawn by hand)
daily chart
Always In Long (AIL) since 12/06
Aggressive bulls bought the Breakout Test of the high of last week
we couldn’t even close the gap with the COY
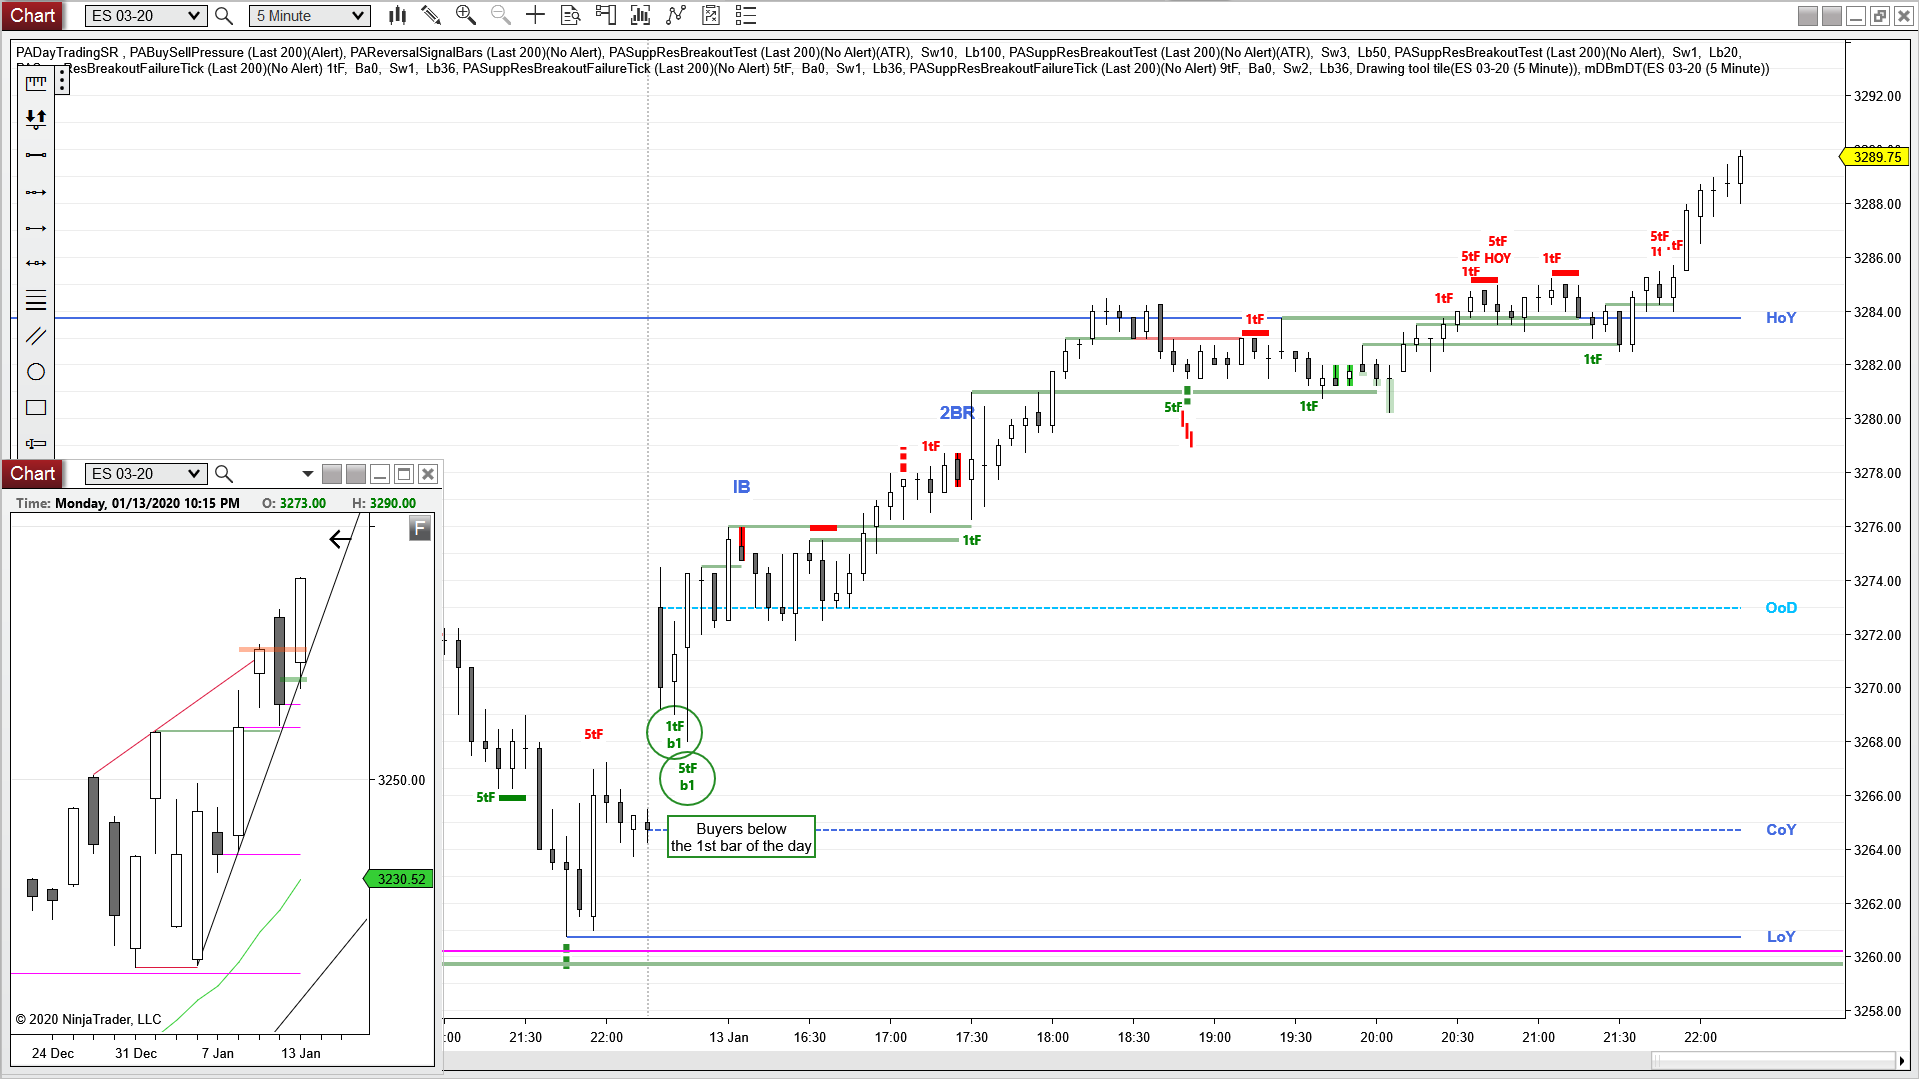
Here is the “naked” version of today’s chart, with just the indicators applied.
The Support and Resistance – Breakout Failure Tick indicator showed nicely the buying below the 1st bar of the day. which also was a TR bar mid range the prior day (a fade candidate).