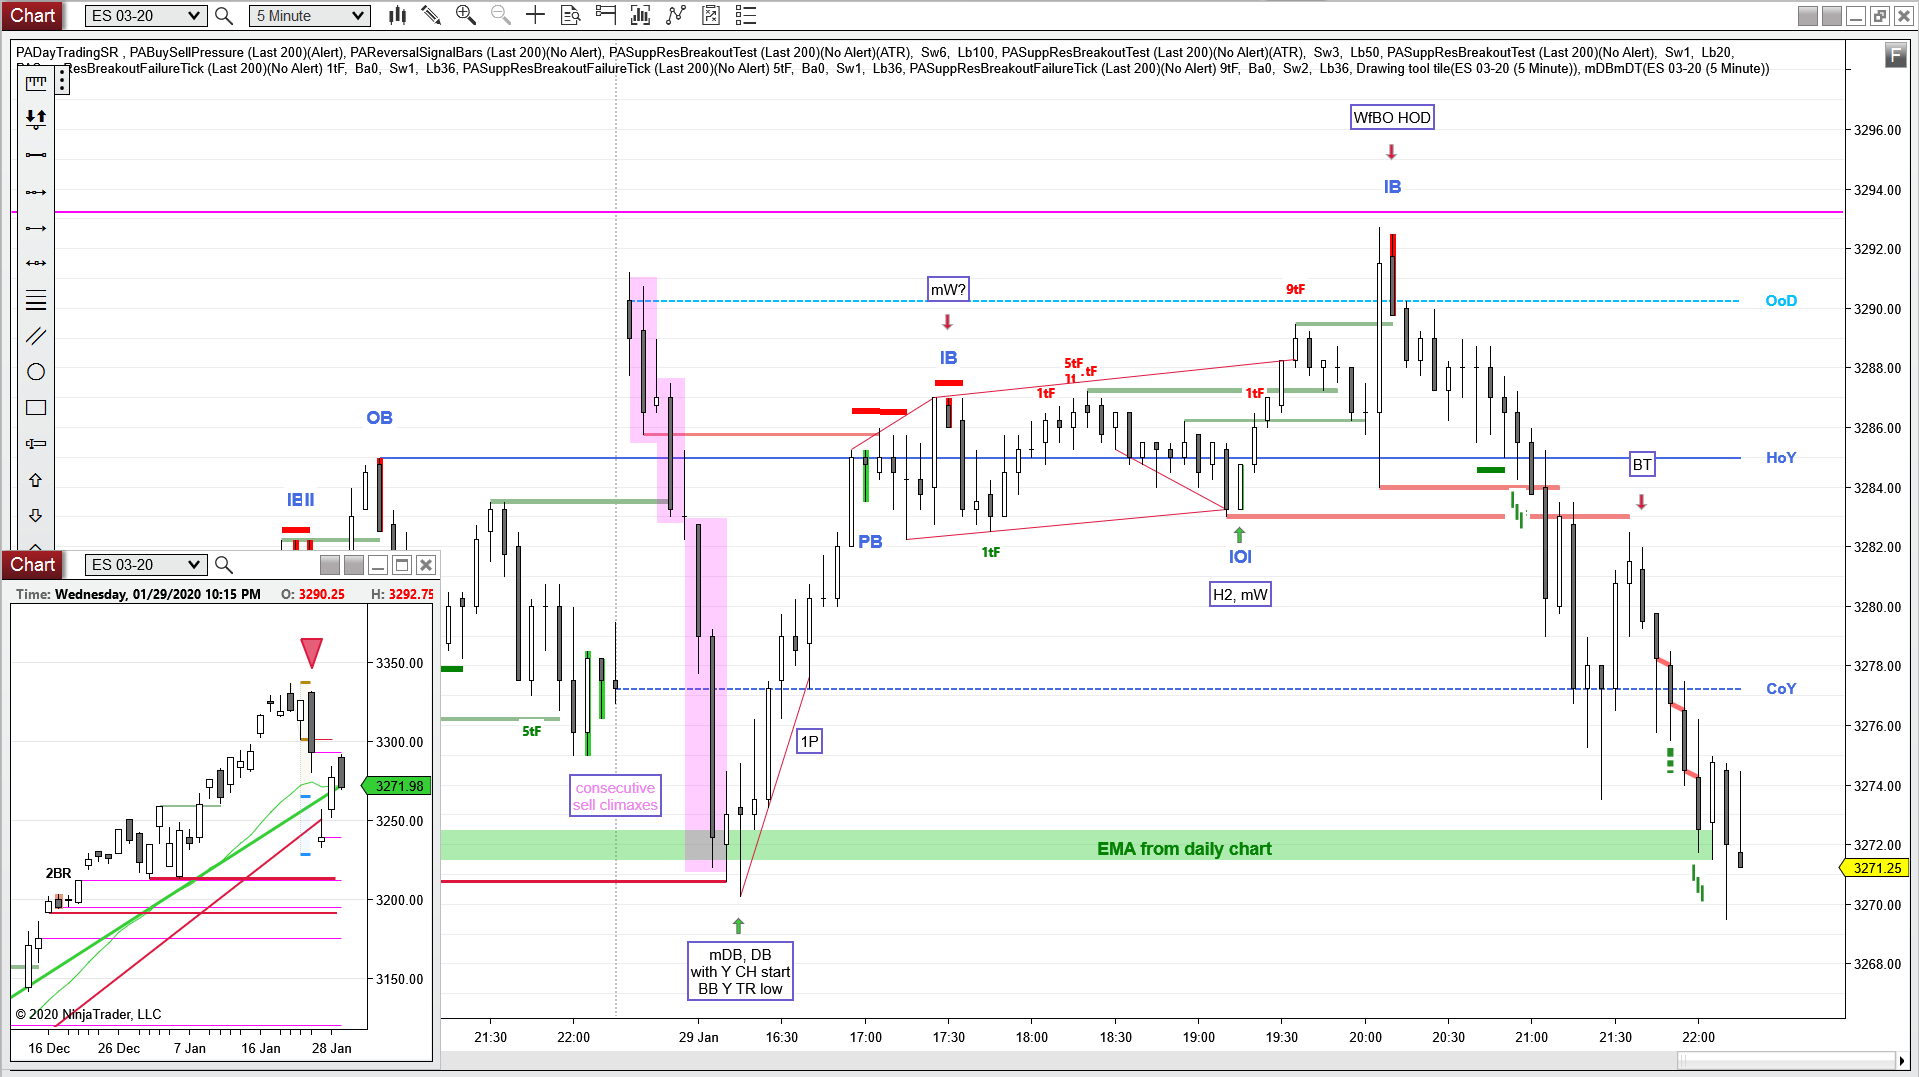
Bull gap, above HOY, fBO, SX, DB, mDB, 1P, mW, H2, WfBO, BT
the daily EMA was nice support, like yesterday
just take the price from the prior day and draw a support/resistance zone on your chart before the open
E-mini S&P 500 Future 5 min chart (trend lines, arrows and boxed text drawn by hand)
daily chart
Always In Short (AIS) since 01/24
Breakout pullback short SB for the bears, probably Srs on the close
1st bear close below the EMA since a while
over 300 pts of profit on the daily chart since the last buy at 10/14

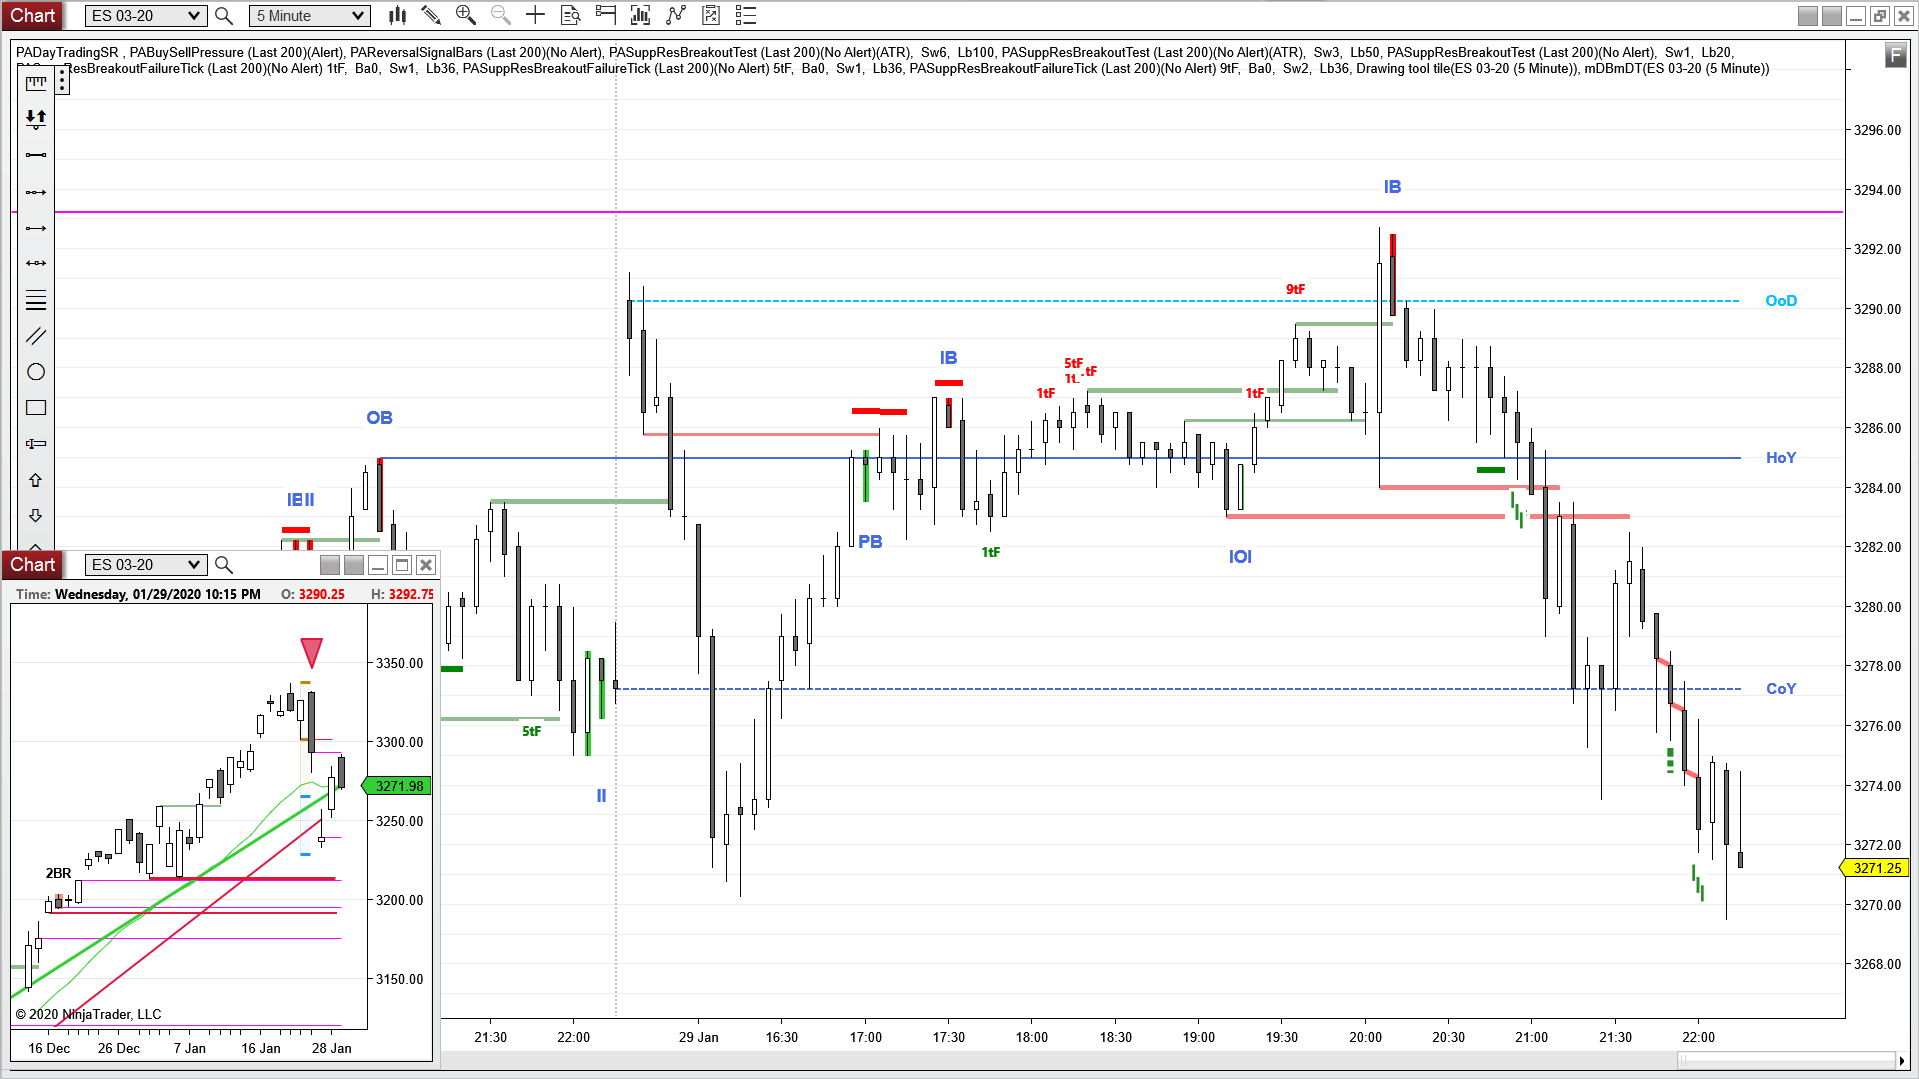
Here is the “naked” version of today’s chart, with just the indicators applied.