E-mini ES 2019/10/11

Bull gap. above HOY, T1B, mDB, 1P, fEB, 1CHBO, 1tF BT, DB, DP

The Buy Sell Pressure indicator had two nice signals, that were showing buying pressure before a bull signal bar.

E-mini S&P 500 Future 5 min chart (trend lines, arrows and boxed text drawn by hand)

daily chart
Always In Long (AIL) since 10/10
Double top with 10/01, L2 Signal Bar
E-mini ES 2019/09/27

Continuation, fBO, WfBO, LH MTR, fH2, 1tF BT

E-mini S&P 500 Future 5 min chart (all arrows/entries drawn by hand)

daily chart
Always In Short (AIS) since 09/24
three pushes dn to test support (the high of the August TR)
aggressive bears B the Close lmt (a successful breakout test)

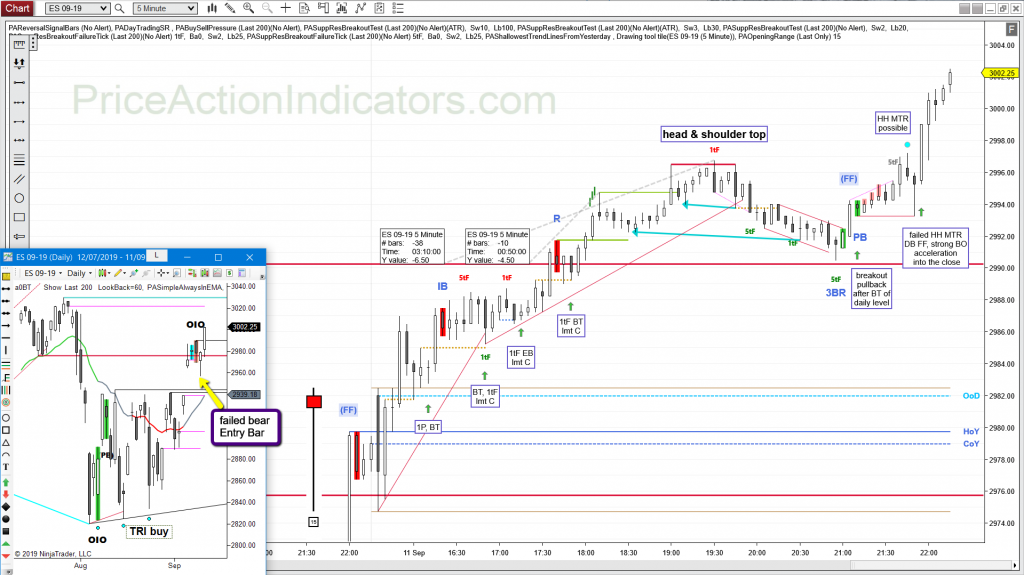
E-mini ES 2019/09/11

Continuation, 1P, BT, 1tF EB, 1tF BT, SHS, BP, DB, FF

another test (bars 1, 2) of the neckline from the daily double top (2975.75)
one can also see very nice, how bulls B the BO above Monday high and PT at 4 and 6 pts
later there was a breakout test of the Monday high and bull resumption into the close

daily chart
Always In Long (AIL) since 08/29
decent BO bar from yesterday’s failed bear Entry Bar
more up

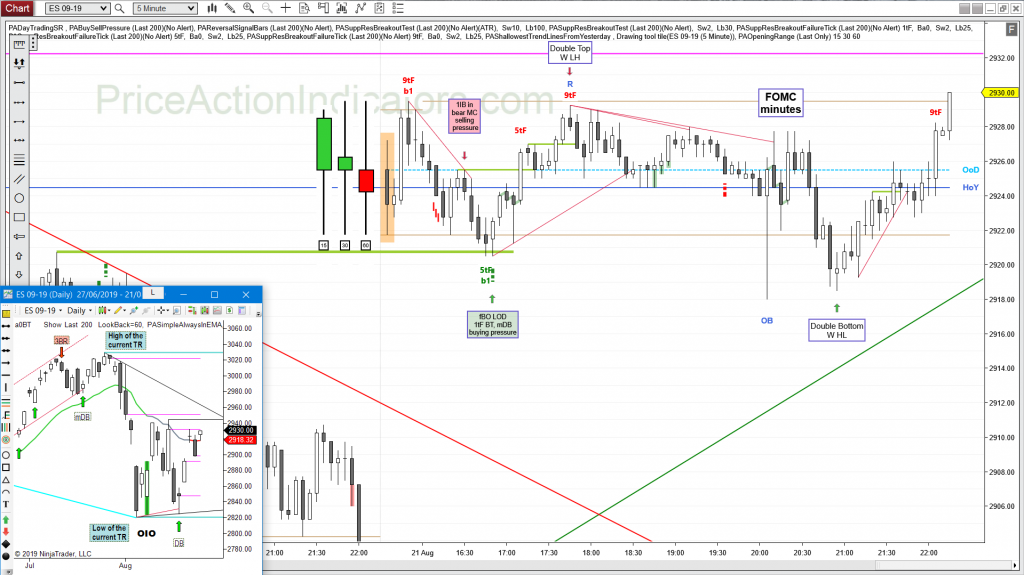
E-mini ES 2019/08/21

Bull gap, mid range, Opening Range, bear MC, 1IB, fBO, 1tF BT, DT, DB
FOMC report, small Trading Range day

Nice confirmation from the BuySell Pressure Indicator and the 5 tick failure on the fBO of the Opening Range.
The three higher time frames (15, 30 and 60 minutes) had trading range bars for the 1st bar. This might have been an early indication to look for fBO at the extremes of the day.

daily chart
Always In Long (AIL) since 08/19
another attempt to close that gap with the 08/13 close